Author’s note
Please note the following paper had to be updated to represent what occurred after the invasion of the Ukraine, which occurred after this paper was written but before it was published. This is the second part of a three-part article, and it was written so that all three parts are one article.
Introduction
In this, the second part of a three-part article, we will discuss renewables (wind turbines and solar). We will look at price and Energy Returned on Investment (EROI) to compare sources of energy. We will also look at OPEC, at the lack of investment (which is causing the overall supply of energy to decrease), and at what is happening in oil and gas, including inflation and the possibility of a super cycle due to the lack of investment.
With renewables, there is a need to develop long-term storage, using innovative ideas, to reduce both seasonal and daily variability. Long-term storage also, like with natural gas, prevents the price of electricity from going below zero dollars.
In this section, we will also show how underinvestment has affected investment in oil and gas, along with a possible solution. The recommended solution involves moving towards a one-third mixture of renewables, fossil fuels, and nuclear.
Wind turbines and solar are not the complete answer
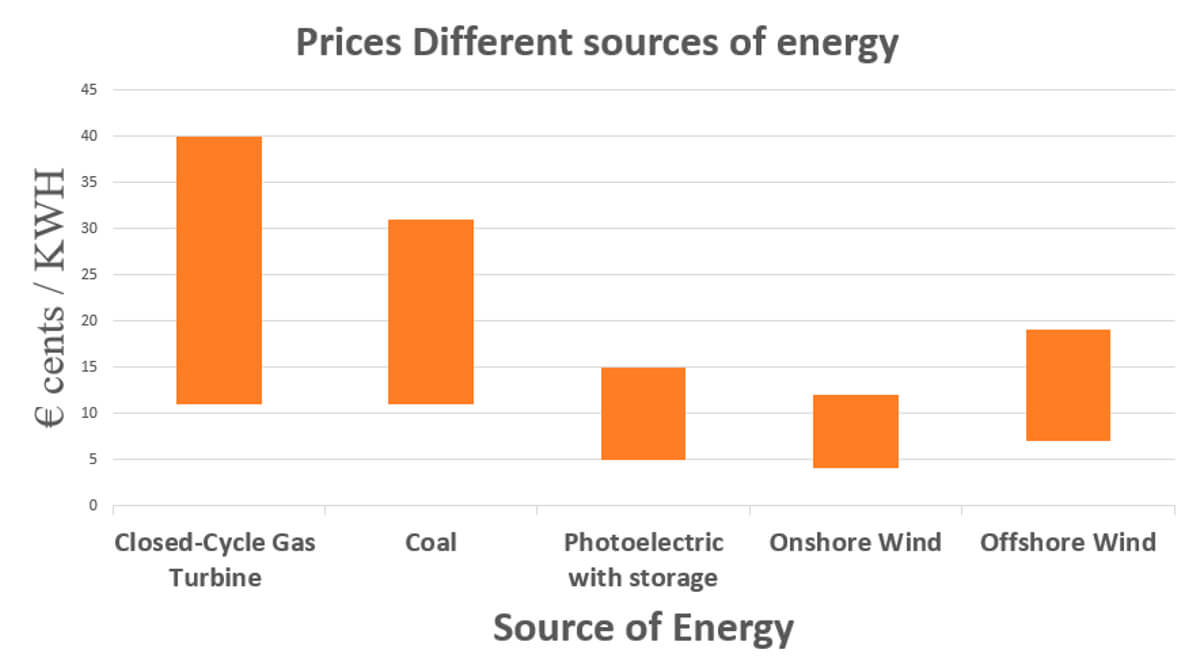
Figure 2 shows the levelized cost of electricity (LCOE) for diverse sources of electricity. It shows that renewables are the cheapest source of electricity generation.
Over the last decade, we have seen the price of renewables drop significantly due to price dropping following a technology learning curve. The global weighted-average cost of electricity of utility-scale solar PV, onshore wind, and battery storage in China plummeted by 77%, 35%, and 85%, respectively, between 2010 and 2018 (Stony Brook University, 2020).
Intermittency and variability
Many advocates for renewables argue that the low cost is the reason why we should switch to renewables, while neglecting to discuss issues with intermittency. When they address these issues of intermittency, they discuss lithium battery storage and adding more wind turbines or solar panels, but it is not that simple.
Regarding lithium battery storage, the problem is that lithium batteries only store electricity for a matter of hours. One of the ways to solve some of the issues with variability and intermittency is by distributing wind turbines across many counties, which creates geographic diversity. This distribution also helps when a weather event rolls in, as it may affect some turbines long before it moves across all of the turbines. With geographic diversity, grid operators have time to ramp up or ramp down other generation; and with geographic diversity, the grid can be designed to account for the wind’s tendency to blow at different locations at different times of the day (Diffen, 2011).
Less profit and diminishing marginal revenue
We need to be careful about installing solar and wind turbines everywhere because there comes a point where the amount of electricity generated from these renewables become too great, especially if they are competing against other sources of electricity, such as nuclear or hydroelectricity, and the price of electricity can go negative. The fact is that the more we build renewables, the more the cost of electricity decreases, which makes renewables competitive, but with lower electricity costs, there is less profit and diminishing marginal revenue.
Supply and demand dictate that electricity prices will tend to fall during the times that wind and solar are generating, which results in lower revenue to those generators. These two factors: technological progress and diminishing marginal revenue, pull carbon abatement cost in opposite directions (Das et al., 2019). An example of this pulling in opposite directions is during spring run-off: the dams must be opened to avoid flooding. The power generated by the hydroelectricity is competing with the power generated by the wind turbines because spring is the time the wind turbines perform their best. So, the excess electricity is given away.
All of these issues suggest the need to deploy grid technologies, such as storage and new transmission. To integrate wind and solar in an economically sustainable manner, there needs to be more planning than just building renewables. We are seeing plans by the Biden Administration for an offshore wind turbine farm to be built off the coast of Oregon, which will further add to this problem in the Pacific Northwest. So, instead of just building something because it looks good, there needs to be plans to determine how it affects the electricity costs in an area (Das et al., 2019).
Seasonal variability and long-term storage
Seasonal variability affects the potential role of wind in some regions of the country. An example of this effect is that during mid- to late-summer, wind turbines perform their worst. This suboptimal performance needs to be incorporated into the planning and building of renewables.
One of the ways to deal with seasonality is the long-term storage of electricity. Since lithium batteries store the electricity for only a matter of hours, we need another way to store electricity, such as the use of two water reservoirs, with one on top of a hill and the other at the bottom (Fig. 3). Excess electricity is converted to mechanical energy by transporting water to the top of the hill, and when electricity is required, we can convert the potential energy of water (being on top of hill) to kinetic energy (KE) by flowing water downhill. The kinetic energy is then converted to electricity.
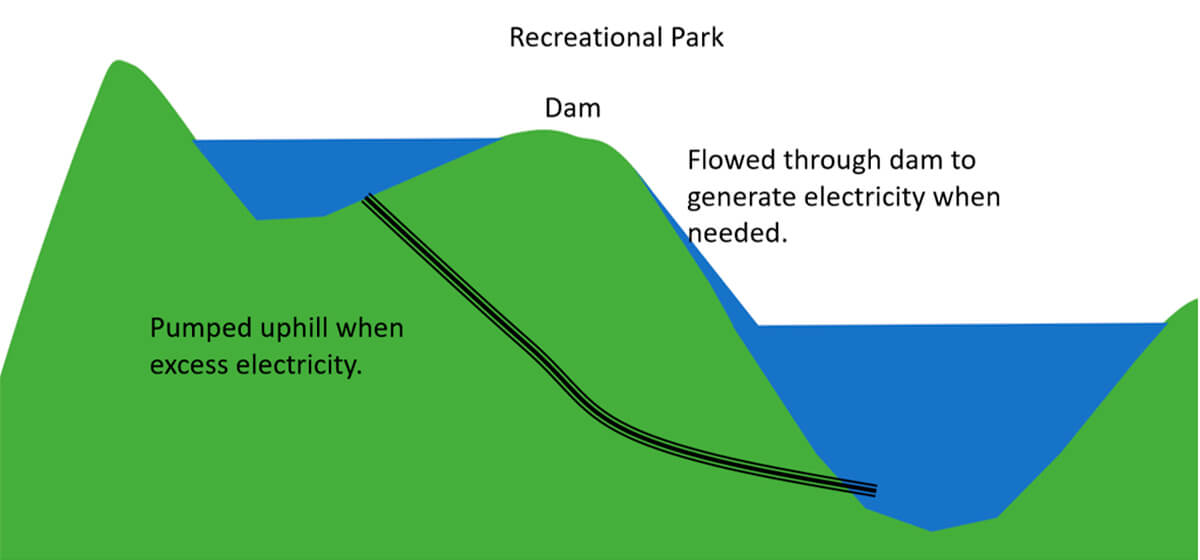
This “electricity storage” facility could be turned into a park for people to enjoy. It would help reduce the seasonality of both wind and solar. This is known as pumped hydro energy storage, and in the U.S., there are 43 operating pumped hydro plants with a total generating capacity of about 22 gigawatts and an energy storage capacity of 553 gigawatt-hours (CleanTechnica, 2022).
Another idea about how to store electricity is compressed air. The electricity generated from the renewables is converted into compressed air and stored in a mine. When electricity is needed, the compressed air turns a turbine, generating electricity. Both methods would hold electricity longer than batteries.
Climate change and renewables
One of the issues we are seeing with wind turbines is wind droughts, which have affected the amount of electricity being generated by wind turbines. The Intergovernmental Panel on Climate Change (IPCC) suggests that average wind speeds over Europe will be reduced by 8-10% as a result of climate change. Reductions in near-surface wind speeds are due to a phenomenon called “global stilling,” which is caused by smaller differences in temperature between hot and cold areas. It is this temperature difference which drives large-scale winds around the globe through a phenomenon called thermal wind balance.
Some are concerned that periods of stagnant, high atmospheric pressure over central Europe may lead to prolonged low wind conditions, which could become the most difficult challenge for power systems in the future (Bloomfield, 2021).
This stagnant high atmospheric pressure is also causing heat waves and water droughts in other parts of the world. In the summer of 2021, there were water droughts in California and Brazil, which reduced the efficacy of hydroelectricity and caused the demand for natural gas to increase.
Effect on energy markets
Some energy markets are struggling with blackouts and extreme price volatility with this energy transition. Many point to the intermittency and variability of renewables, but the issue comes back to a combination of an extreme temperatures, faulty planning, and a lack of flexible generation sources and sufficient electricity storage. There are concerns that some policy makers are adding wind and solar so rapidly that electric grids have become unstable, and many people are now pushing back, demanding that the entire system be stable and more reliable (World Oil, 2021; Lovins and Ramana, 2021).
Inflation and rising interest rates
Other factors that are affecting renewables are inflation and high interest rates.
In the last year, prices for solar panels have risen by more than 50%, and wind turbines by 13%, while battery prices are rising for the first time ever (Bloomberg, 2022a). Current shipping backlogs and commodity shortages are hitting renewables at a vulnerable time. After years of rapid advances in technology and manufacturing, there are now fewer opportunities left to cut costs without sacrificing profits. Prices of renewables will now ebb and flow based on the cost of raw materials and other market forces (Bloomberg, 2022a).
Higher interest rates are also threatening to increase costs for wind and solar projects due to developing new energy systems being capital intensive and often funded with debt. These increased costs are also occurring at a time when central banks are implementing a tighter monetary policy to curb inflation (Kimani, 2022a; World Oil, 2021).
Energy Returned on Investment
With renewables, we need to look beyond price and look at Energy Returned on Investment, or EROI. EROI is an early concept that easily demonstrated the advantages, as well as the investment needed, to exploit new energy sources. It is used to evaluate the efficiency of energy extraction and is being used increasingly frequently by energy researchers (Hu et al., 2013).
EROI can also be referred to as Energy Returned on Energy Invested (EROEI). EROI is the ratio of energy returned to energy invested in that energy source, along its entire life cycle. When the number is large, energy from that source is both easy to get and cheap (Fig. 4). However, when the number is small, the energy from that source is both difficult to get and expensive (Conca, 2015).
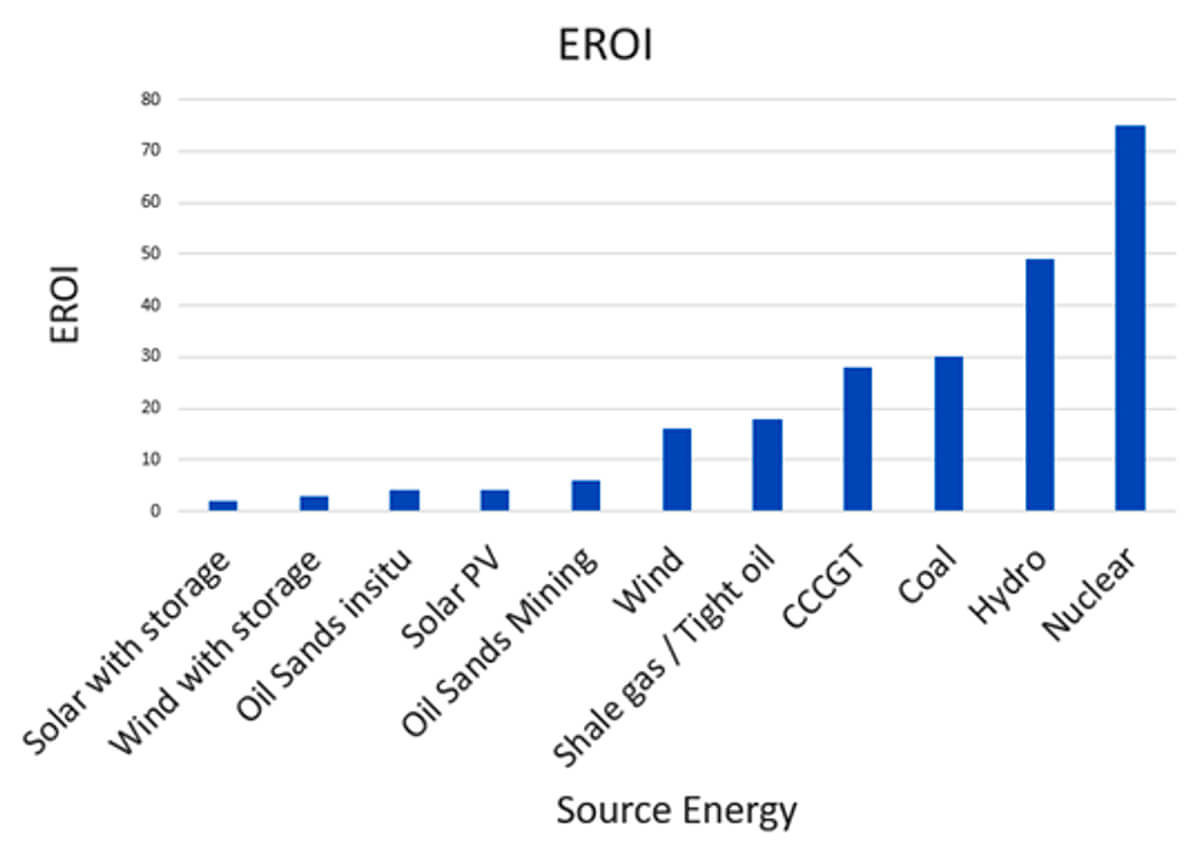
To obtain energy security, and to maintain a high EROI, it is recommended a blend of energy be one-third renewables, one-third fossil fuels, and one-third nuclear. It is believed that with this ratio, GHG emissions could be cut in half, and the average EROI would be 36 (Conca, 2015).
Fossil fuels still being needed, CCUS (Carbon Capture Usage and Storage) needs to be incorporated to reduce the GHG emissions further.
EROI and break-even prices
The break-even price (BEP) is the oil price needed to maintain economic viability of a project. It is used to decide which assets to acquire or in which assets to invest. Part of the BEP reflects the energy that is put into developing a project.
Oil and gas companies have had to turn to using more energy-intensive methods to get to conventional fossil fuels and to produce harder-to-extract fuels (such as tight oil) than before to be able to keep their production up. Using more energy-intensive methods caused the BEP to be $60 to $90 in 2014, but the development of innovative technologies and processes, as well as incorporating economies of scale, has significantly brought down the BEPs for tight oil and shale gas.
As an example, the BEP for oil sands is currently $55/barrel. This drop in BEP is due to the operators changing how they develop the oil sands, with future phases of oil sands being developed as smaller, incremental brownfield expansions, rather than large-scale greenfield projects. They are also achieving cost savings by tying these developments into existing central processing facilities (CPFs), rather than building new CPFs (Rystad Energy, 2021a). Operating costs have also fallen as a result of increased reliability, with less downtime and increased throughput slashing costs by as much as 50% (Beintein, 2019).
Implementing these changes has not only lowered the BEP but has also increased the EROI.
Hydrogen
Many are looking at electric vehicles (EVs) as the next wave of transportation, but we need to recognize some of the challenges that EVs present:
- Demand for lithium for car batteries
- Drain of power from the grid to “re-fuel” vehicles
- Larger vehicles, such as diesel trucks, construction vehicles, boats, and planes may have difficulties with the number of batteries required to power these means of transportation as well as the distance these vehicles can travel on a fully-charged battery pack.
Some are looking at FCEVs (fuel cell EVs) as an alternative to EVs, especially for replacing diesel fuel in trucks and heavy machinery. To help with the research and development of hydrogen, the Canadian government has created a $1.5 billion CAD ($1.2 billion USD) Low-Carbon and Zero-emissions Fuels Fund to increase the production and use of low-carbon fuels, including hydrogen (World Nuclear News, 2020).
In June 2021, the Federal Minister of Natural Resources, Seamus O’Regan Jr., also announced a $2.3 million investment in the Alberta Zero-Emissions Truck Electrification Collaboration (AZETEC) project. The project is led by the Alberta Motor Transport Association (AMTA), in collaboration with project partners: Hydrogen Technology and Energy Corporation, Zen Clean Energy Solutions, Canadian Energy Systems Analysis Research, Bison Transport, Trimac Transportation, and Suncor Energy. The project will validate the design, manufacture, and operation of long-range fuel cell electric trucks for operation between Calgary and Edmonton (Natural Resources Canada, 2021). This project coincides with the federal and Alberta governments signing an agreement with Air Products Canada to build a $1.3 billion blue hydrogen plant in Edmonton (Weber, 2021).
Hydrogen does have three times more energy than natural gas, but it is not a fuel, but a means to store or transport energy. It is a means to store or transport energy because hydrogen requires energy to produce it (Wise, 2006).
When hydrogen is used in a vehicle, it either needs to be compressed under 700 bar or 5000 PSI, or cryogenically cooled. It can be used in an internal combustion engine (ICE) or in a hydrogen fuel cell (HFC), where it generates electricity to power an electric vehicle (like a Tesla).
Toyota and other car makers tend to use HFCs. The major difference between a HFC and an EV is the recharging time. HFCs take as long as refueling a car with gasoline to “re-charge” or “re-fuel” the vehicle.
One of the drawbacks to hydrogen is that it has an EROI of about 1 due to the amount of energy needed to create it. The cheapest hydrogen is blue hydrogen, which involves heating methane gas to between 700–1100°C in the presence of steam and a nickel catalyst. This process will break up the methane molecules and form carbon monoxide (CO) and hydrogen (H2) (Wikipedia, 2021e).
The other drawback is how to store and transport it, with some wanting to convert it into ammonia (NH3) and others liking the idea of hydrogen paste, which is magnesium hydride. This is becoming an issue in the design of smaller vehicles, such as electric scooters and motorbikes. Companies like Honda are looking into it, and Kawasaki has formed an alliance with Yamaha to develop a hydrogen motorcycle (Punsalang, 2022).
Currently, these smaller vehicles need to incorporate a hydrogen tank that either needs to be able to hold compressed hydrogen gas or cryogenic hydrogen (super-cooled liquid hydrogen); it is one of the drawbacks of hydrogen for smaller vehicles (Jones, 2021). Some manufacturers are even looking at hydrogen paste instead of hydrogen for these smaller vehicles (Renewable Energy Magazine editorial team, 2021).
Alberta provincial government
The Alberta provincial government is moving towards having 30% of its electricity generated by renewable energy by 2030. With this transition, more natural gas generation will also be added to the grid. Currently, Alberta ranks third in Canada for installed wind energy capacity, which represents 9% of Alberta’s power generation. Alberta also has 6066 PV Solar systems installed with 77% being residential, 11% commercial, 11% farm, and 1% other (Green Alberta Energy, 2020).
Redesign of the grid for renewables and multiple energy sources
If we go to one-third renewables, we need to develop innovative ideas to try to minimize the inconsistent power supply to the grid. Gent (2019) provides examples, such as:
- Expanding the transmission infrastructure to shuttle power from areas where the wind is blowing to areas where it is not. This method involves having wind turbines geographically distributed across Alberta.
- Pairing renewable energy with energy storage (batteries) to build up reserves for when the sun stops shining. This method provides short-term electricity storage.
- Creating long-term electricity storage, using water or compressed air, that can be released when electricity is in demand.
- Using microgrids, which are smaller, self-contained grids that can connect and disconnect from the larger, main grid (Fig. 5).
- Supplementing solar and wind with another source of renewable energy, such as geothermal energy.
One of the ideas that has been put forth with solar and wind installations is to utilize smaller microgrids where the power is stored at battery siloes (Fig. 5). If there is excess electricity generated by the solar and wind installations, it is sold to the main grid. If for whatever reason (e.g., a storm), the power on the main grid is shut down, then the microgrid can continue to provide power.
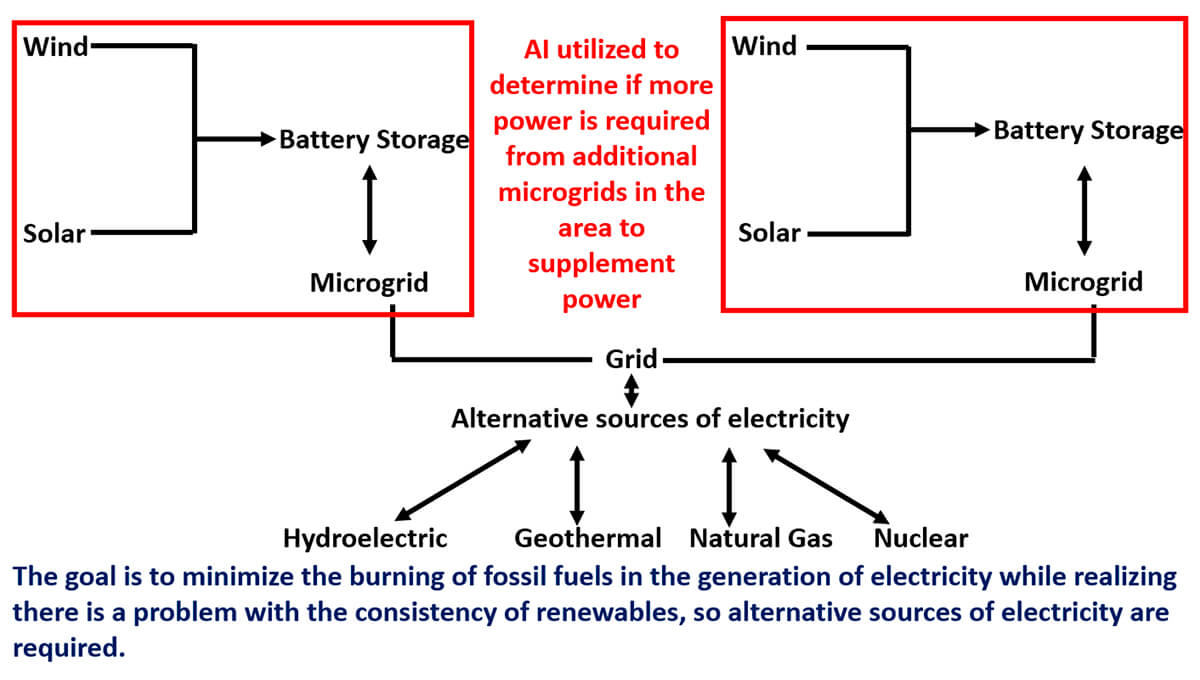
This idea moves towards being able to buy and sell power from one microgrid to another. If we had an overseeing artificial intelligence (AI), this power transfer could be done on the fly. The AI could use blockchain to enable these energy exchanges between customers. The blockchain acts as an electronic ledger, keeping track of the buying and selling of power.
To manage the small grids and multiple energy sources, we need to incorporate a smart grid that utilizes AI to decide which source of energy should be used based upon numerous factors, such as weather, season, supply, demand, and so forth. The decision to use which source needs to be autonomous. Part of this method will be to prevent the price of electricity from going too low.
Underinvestment in oil and gas
In 2021, we had the lowest oil and gas discoveries in 75 years (Rystad Energy, 2021b). This lack of discovery reflects the fact that there is a $600 billion shortfall in the upstream investment which is needed between 2021 and 2030. This shortfall is causing issues with spare capacity in countries like Angola and Nigeria, where companies like BP, Shell, and Total have traditionally been active. The issue comes back to the fact that, in the last seven years, oil and gas globally have lost two-thirds of their exploration budget (Adenubi, 2021; Coleman, 2021).
Some concerns from investors include that carbon prices and additional regulations to limit carbon emissions could make many oil and gas assets unprofitable as governments press for net-zero emission economies by 2050 (Paraskova, 2021a).
We already see that the EPA is advancing more stringent regulations governing the flaring of methane at drilling sites across the country. These regulations will require a comprehensive monitoring program for new, and existing, well sites and compressor stations, a prohibition on gas venting (and a mandate for its capture and sale), and the establishment of new performance standards for certain infrastructure along the natural gas supply chain (Johnson, 2021).
Divestments
Because of concerns about climate change, there have been around 1500 investment institutions overseeing a combined $39.2 trillion of assets under management that have divested from oil and gas. The question institutional investors need to ask is, “Does divestment really work?” The divested equity and bonds of major international listed oil and gas companies are driving oil and gas production lower due to capital discipline that is being exercised by most public traded oil and gas operators, but it has not decreased the demand. In all the scenarios that have been modelled, demand for oil and gas increases before it decreases. When the demand will decrease differs quite a bit, with some saying it will occur in 2025 and others saying it will in the mid-2030’s (IEA, 2021).
Demand for oil, gas, and coal is increasing. The equity and asset divestments will quickly be picked up by non-OECD investment funds and private equity funds that want to grab the available stocks, bonds, and assets, as the margins in oil and gas, and even coal, are very impressive (Widdershoven, 2021).
Institutional investors are reconsidering divestment. In a recent study by Almazora (2020), 59% of institutional investors support active company engagement and stewardship to integrate sustainability, compared to 38% last year. Only 36% consider adopting divesture, which is down from 53%. Therefore, we are seeing activist investors, like Engine No. 1 and Kimmeridge Energy Management Co., on oil and gas companies’ boards.
Activist investors
Activists on oil and gas boards are causing boards of directors to become central players in shareholder engagement. Strategy now tends to be on the agenda of most board meetings, with questions about performance and strategy being front and center (McKinsey and Company, 2017).
Activist investors are not just about ESG, but can be people like Warren Buffet, Carl C. Icahn, and Bill Ackman. They are individuals, or groups, that purchase large amounts of shares in a public company in order to make major changes in the company. Activist investors tend to target companies they believe are mismanaged or could be run more profitably. Their goal is to fix the underlying issues to increase the company’s value and then profit from the rise in its share price. Activist investors’ intentions are to increase shareholder value. When they decide to buy a large block of stock, the value increases, but when they decide to unload that stock, the price will decrease (Ingham, 2014; Cummans, 2021).
Berkshire Hathaway purchases 10% stake in Occidental Petroleum
Warren Buffet, who is known as the oracle of Omaha, recently bought a 10% stake in Occidental Petroleum because of Occidental's operational gains, debt repayments, dividend hike, and focus on generating long-term, sustainable free cash flow which most oil and gas operators are currently practising. Most investors have shied away from oil and gas stocks due to concerns the industry is in secular decline, low returns, green energy expansions and clients wanting more environmentally friendly investments (Tyson, 2021). We are also seeing hedge funds flirting with oil and gas companies again because of capital discipline (Tyson, 2021).
Capital discipline
Due to the lack of investment, North American oil and gas operators have been practising capital discipline, allowing them to pay down their debt, buy back stock, and increase the dividends they pay out. The energy sector was the top performing sector this year. Oil and gas operators have posted their highest cash flow in 13 years.
Capital discipline has reduced the amount of oil and gas that is being produced in the U.S. (Fig. 6). Instead of re-investing all the cash flow back into drilling and completions, we are seeing companies only re-investing 50% of the cash flow.
US oil shale plays
If we look at what has been happening in terms of drilling, completing wells, and production in the Permian (Fig. 7), we see no large increases in drilling (Fig. 7A), but the number of rigs has been steadily increasing. At the same time, we see large drawdowns on the drilled uncompleted wells (DUCs) (Fig.7B), which correspond to the increase in production (Fig. 7C).
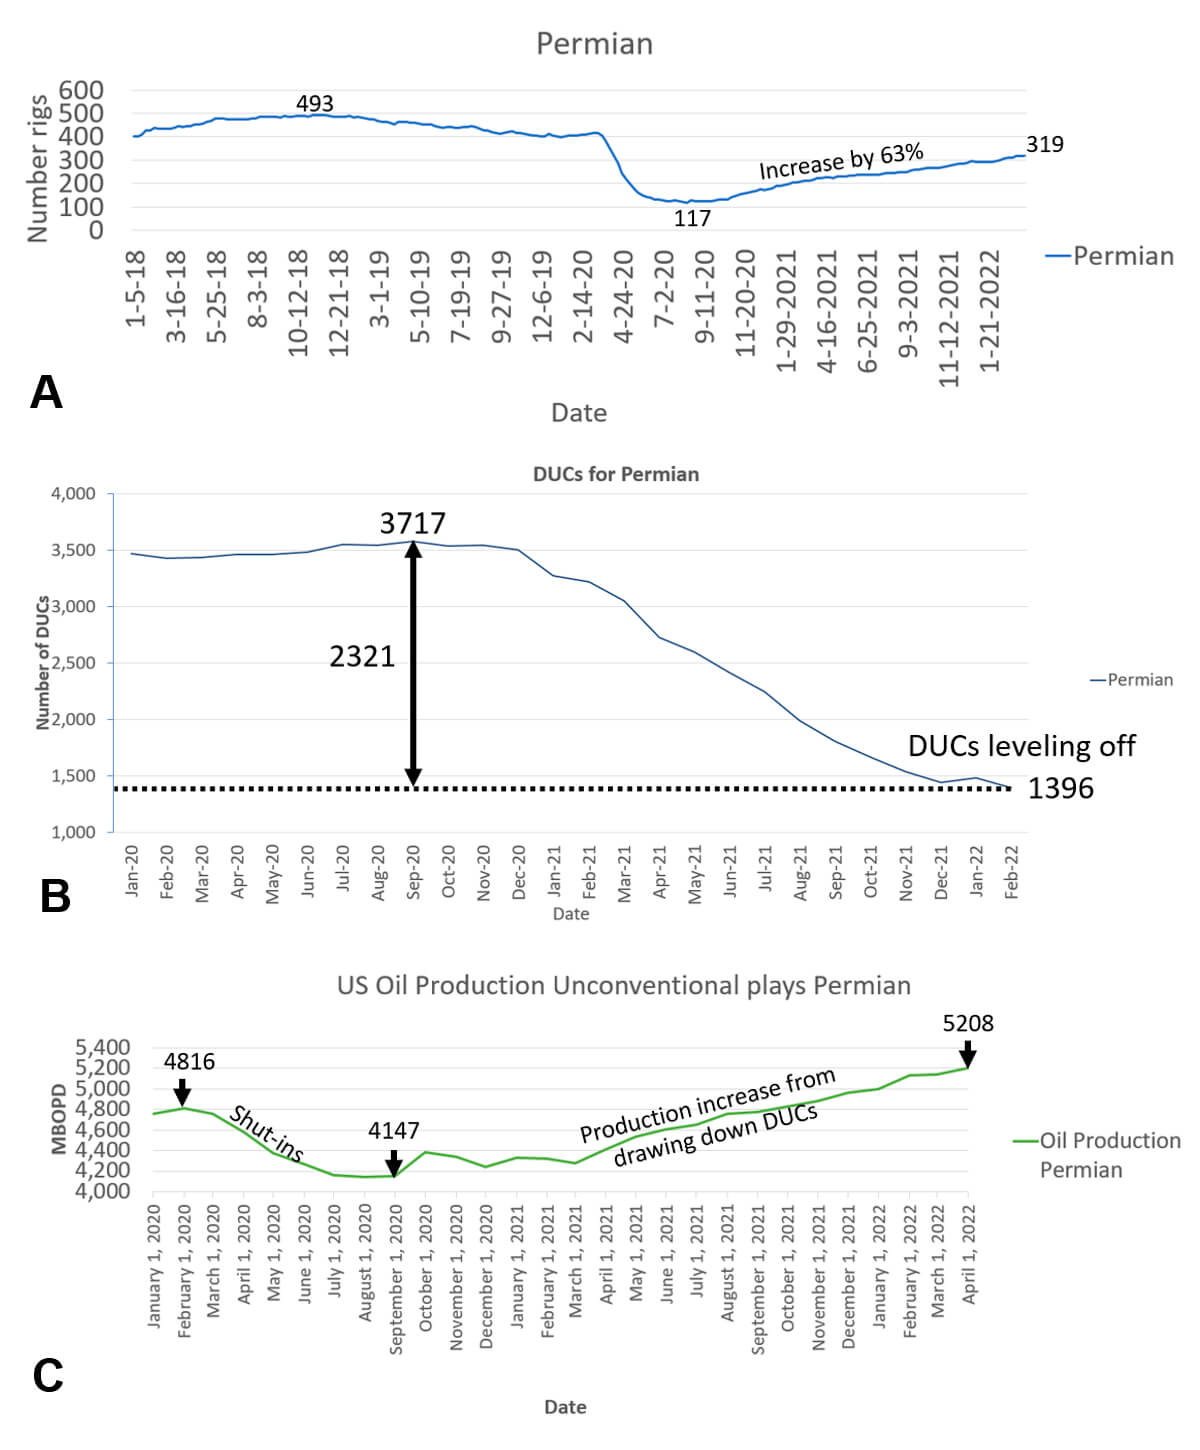
The growth in production in the Permian is coming from the high rate of completions from existing wells. The number of completions per month rose to above 400, resulting in strong month-over-month production growth, while new wells drilled per month have remained below 350 (Kimani, 2022b).
Some believe the increase in the rig activity is due to the private equity companies taking advantage of the high price of oil and natural gas, while the public traded companies are practising capital discipline and drawing down the drilled, but uncompleted, wells.
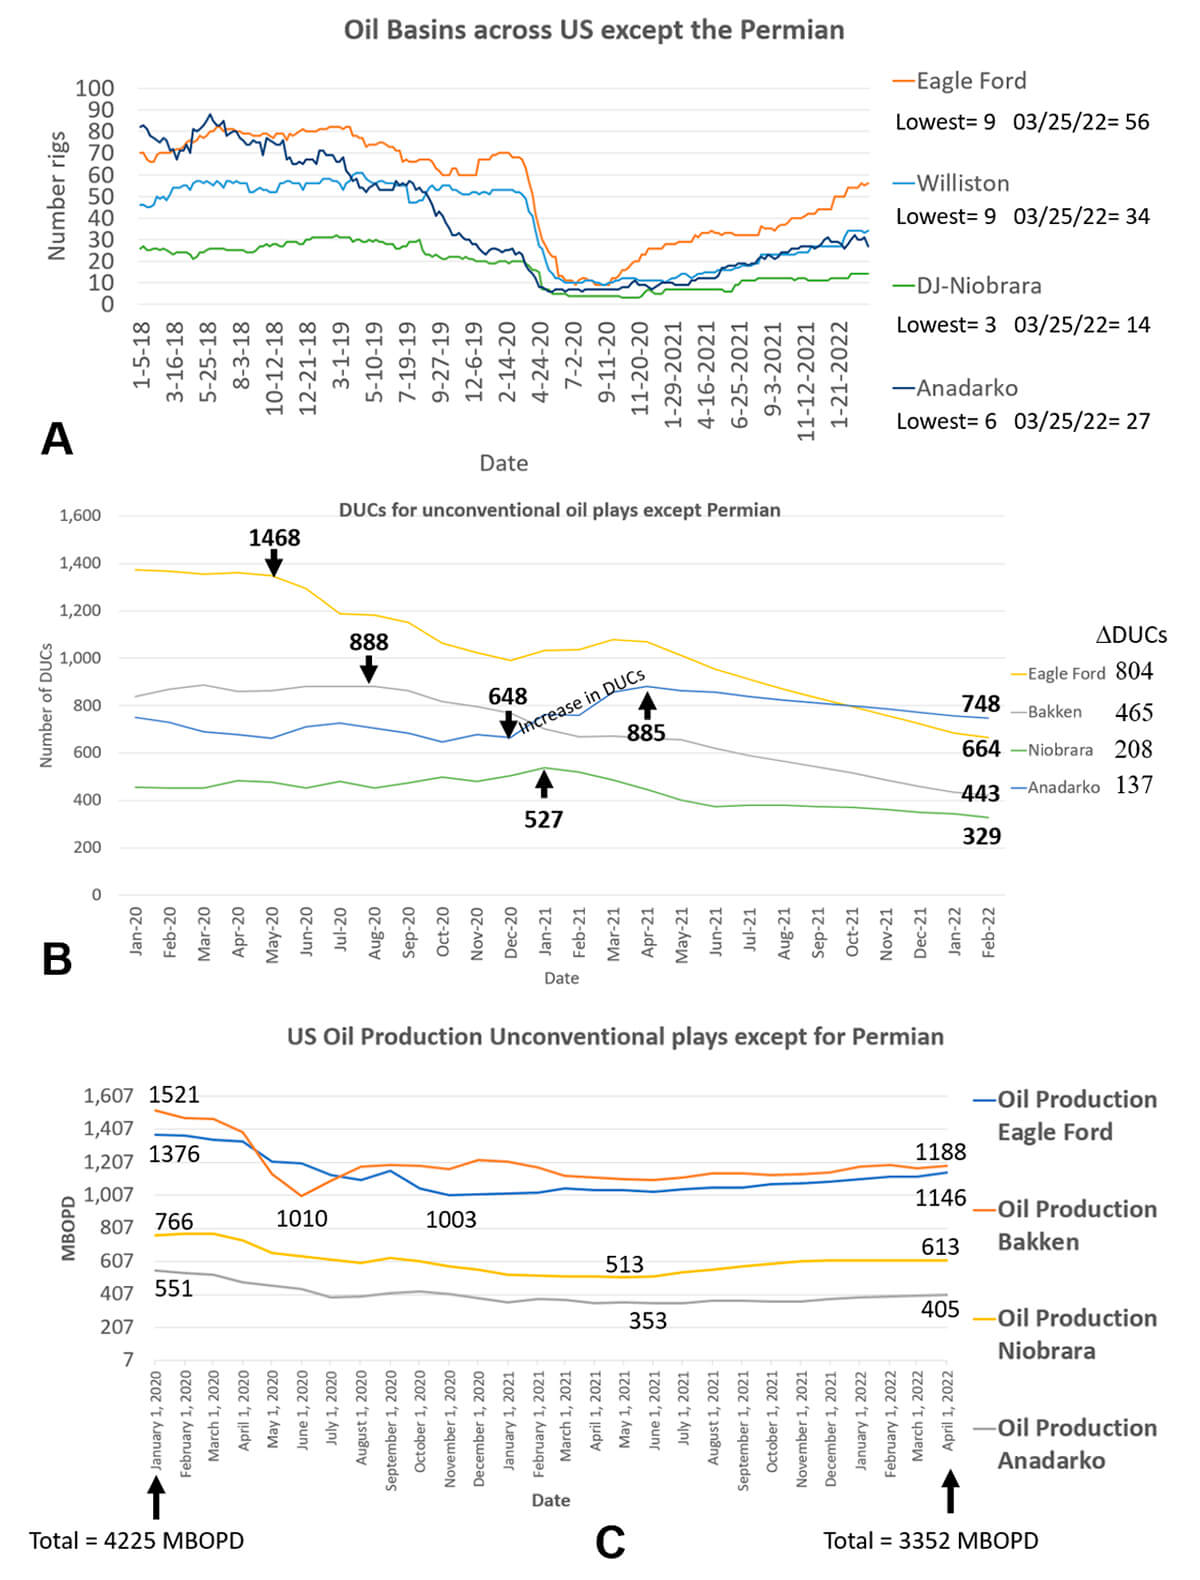
We can also look what is happening in the other oil basins (Fig. 8).
The rigs in all the other oil basins (Fig. 8A) are slowly climbing, but not to 2020 levels. There are drawdowns of drilled uncompleted wells, especially in the Eagle Ford, Bakken, and Niobrara, but the Anadarko drilled uncompleted wells increased from December 2020 to April 2020 and then decreased again. During this time, they probably had to drill these wells, and by shutting them without completing them, they only paid 40% of the cost (Fig. 8B).
We can see that, despite the drawdown of the drilled uncompleted wells, production remained flat, which shows the drawdown of the uncompleted wells equals the depletion rate, so production is relatively flat (Fig. 8C). Depletion on shale play wells is about 70%–75% of their reserves in the first year (Schulte and Felton, 2020).
Price of oil
The price of oil depends on the blend of oil (Fig. 9). WCS (Western Canadian Select) is a heavy with sulfur content and tends to be discounted, causing a differential between WTI (West Texas Intermediate) and WCS. We have this differential because of the lack of pipelines. WCS also competes with heavy oil that comes from other countries, such as Mexico and Colombia and offshore Gulf of Mexico. There has also been heavy oil found offshore Guyana at Orinduik.
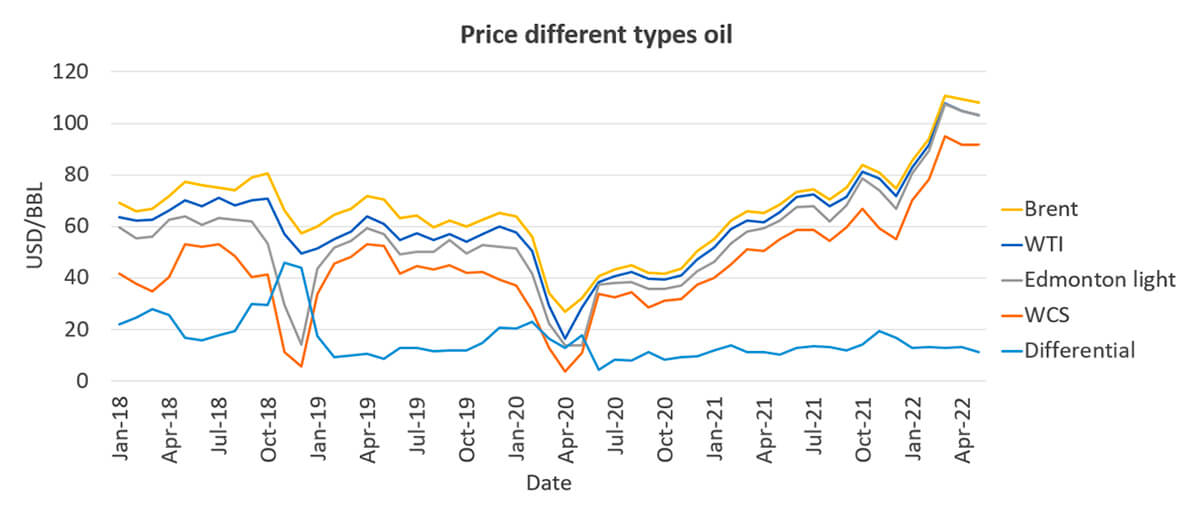
There was an increase in the differential in November 2021 because of the heavy oil wells in the Gulf of Mexico (Mars corridor in the Mississippi Canyon area) that were coming online after hurricane Ida.
There are also sanctions against Venezuela and Iran, countries that supplied heavy oil in the past to the U.S. The ongoing wildcard for the price of oil is if the nuclear talks between the U.S. and Iran are finally successful, which would remove the sanctions against Iran and could lower the price of oil. Some expect this will not happen until second quarter of 2023 (Paraskova, 2022a).
In the next few years, oil supply from Latin countries will decrease for several reasons. Oil exports from Mexico are expected to decrease by 70% between 2021 and 2023 due to political reasons (Bloomberg, 2021). In Colombia, the lack of major conventional oil and natural gas discoveries over the last decade has left the country with meager proven reserves of 1.8 billion barrels, which is sufficient to only support oil production for another six years. Colombia still holds considerable unconventional oil and natural gas potential. The La Luna geological formation, in the Middle Magdalena Valley, is estimated to hold up to 4.6 billion barrels of recoverable oil resources and 14 trillion cubic feet of natural gas (Smith, 2021; Tuttle, 2020).
Forecast of price of oil 2022 at the end of 2021
Capital discipline, and OPEC+ unable to meet its production quota due to underinvestment, will lead to a tight oil market. Local events that cause oil to be shut-in (like freezing in Texas due to a polar vortex) can put pressure on the oil market, especially until they bring the Permian fully back online.
There is uncertainty what will happen with the price of oil in 2022 with some predicting the price averaging around $70 to hitting as high as above $100 per barrel (Paraskova, 2021c).
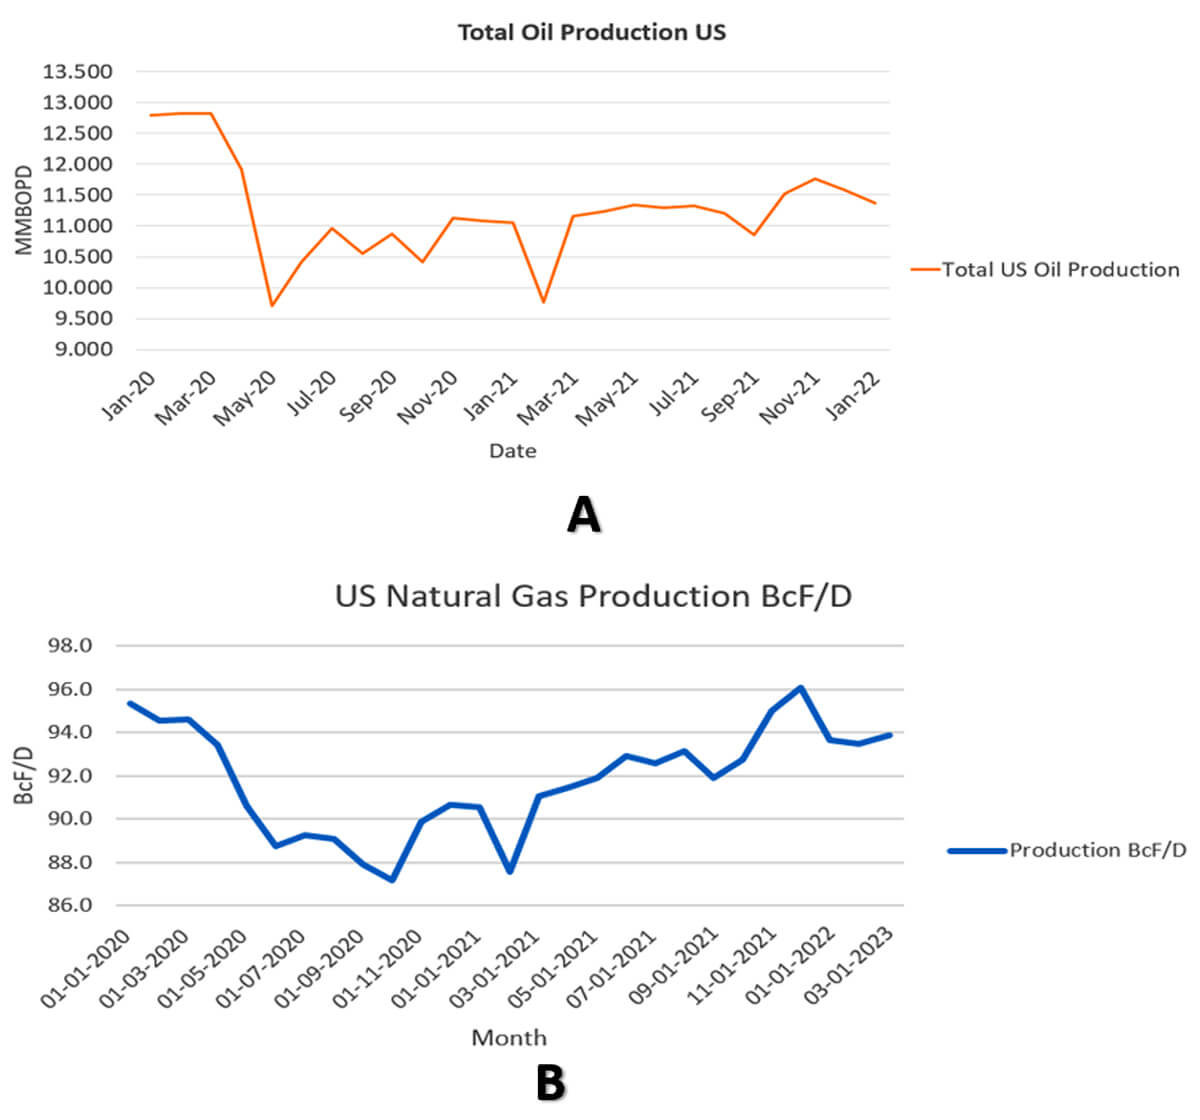
U.S. natural gas plays
The Henry Hub monthly spot price (Fig. 10) fell 25% between November and December, as weather forecasts shifted warmer through the middle of December for North America, reducing concern about tight domestic supplies amid a global shortage of the heating fuel caused by issues in Europe.
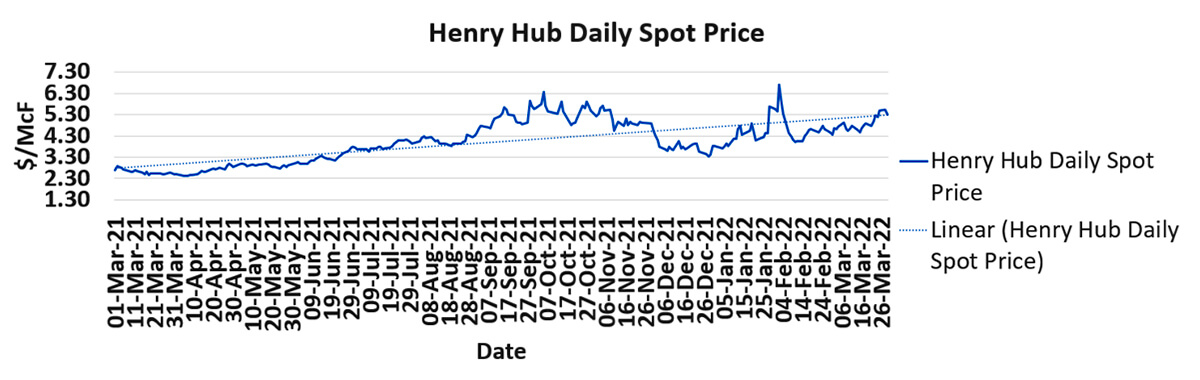
Some of the decrease in the price of natural gas is due to traders selling short, betting it will go lower.
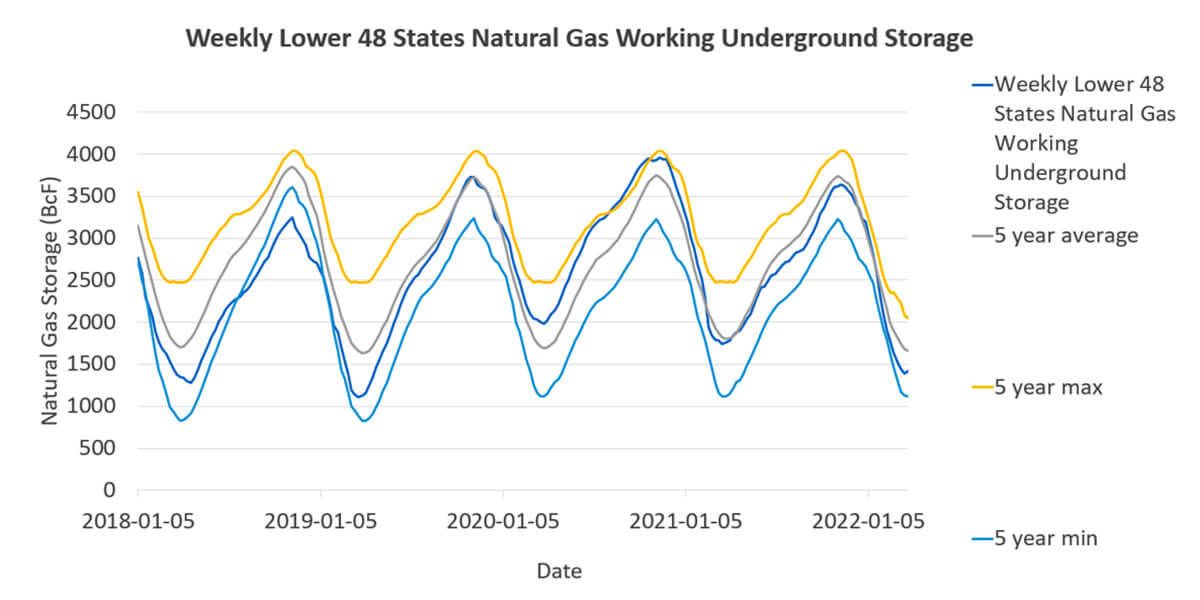
There is expected to be long-term pressure on the price of natural gas due to the amount in storage. For most of the year, we have been tracking the 5-year average (Fig. 11).
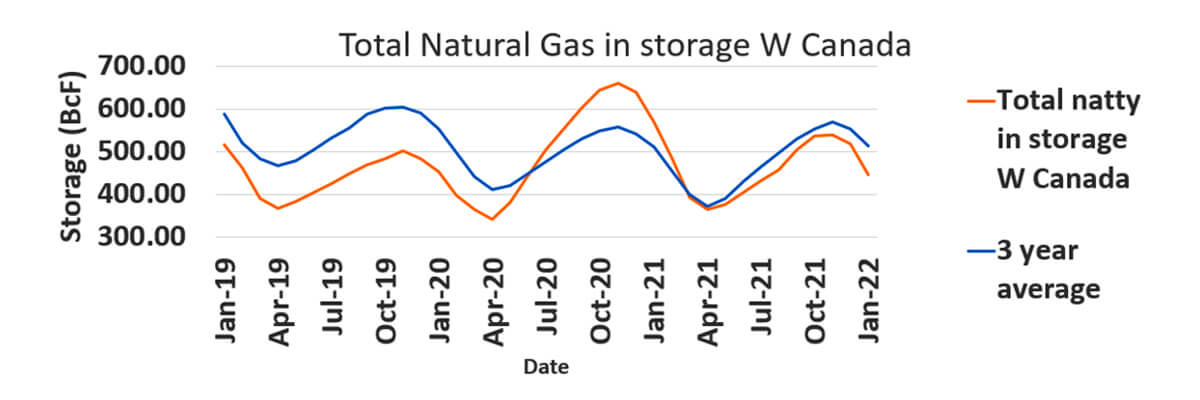
If we look at the situation in Western Canada, we also see the amount of natural gas in storage is low (Fig. 12).
With recent heat in the summers, we have tended to have a drop in the storage of natural gas because it is used for the electricity required for air conditioning, and in the winter, with the cold temperatures we see, natural gas being used for heating. As a result, there are major withdrawals from storage (Fig. 13).
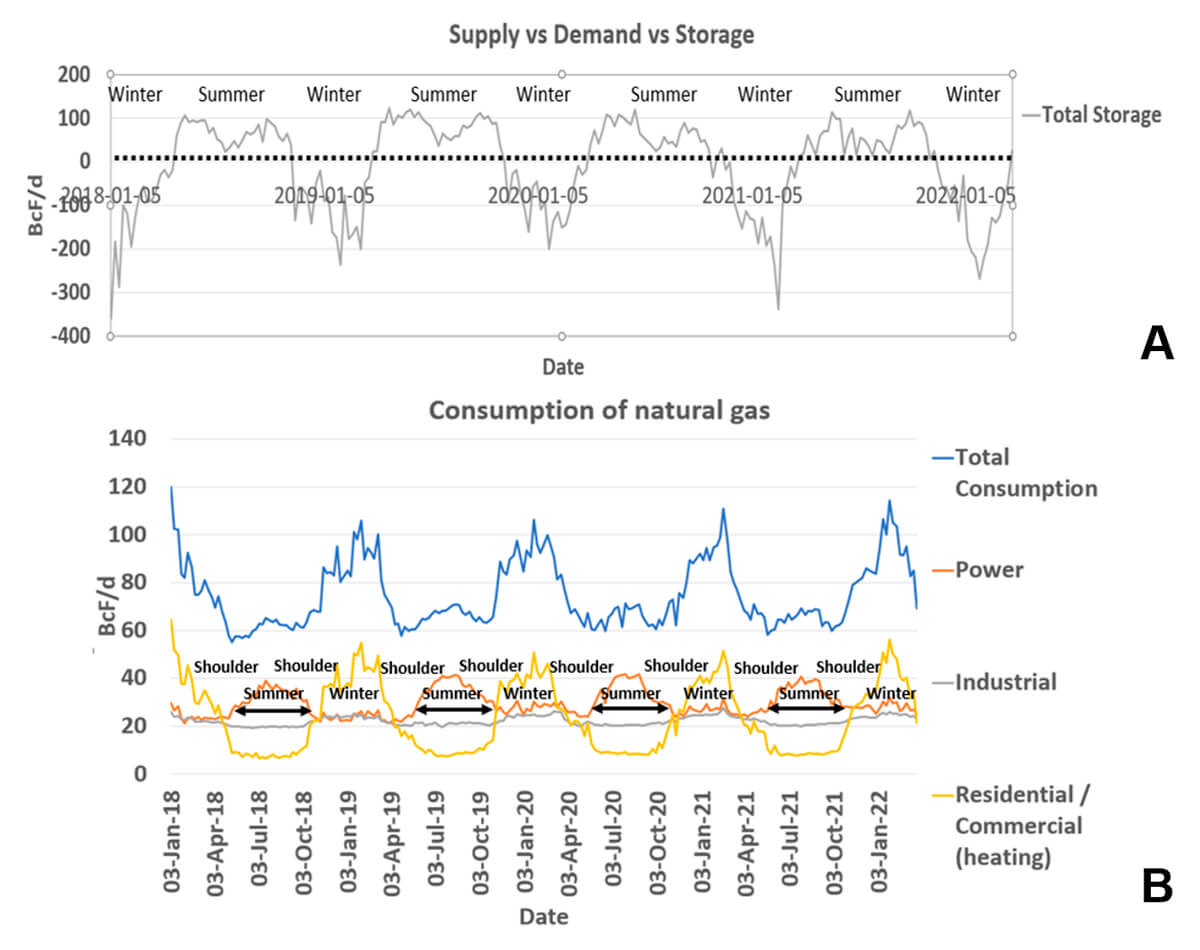
Climate change is affecting the jet stream, which is causing heat waves, caused by blocking events, in the summer and polar vortexes, which are pulling cold temperatures to the mid-latitudes, in the winter.
Both events are causing the natural gas storage to be around the 5-year average, which puts pressures on the price of natural gas. One of the issues is that we have had La Niña winters for two years in a row, and they tend to be colder winters.
About 55% of the U.S.’s natural gas is coming from the U.S. shale gas basins: Appalachia (85%) and Haynesville (15%). The other 45% is coming from associated gas in the tight oil basins.
Just like the oil basins, we can look at what is happening in the U.S. gas shale basins.
In Figure 14, notice that the rig count (A) is flattish from February 2021 to now, and the DUCs began to increase from February 2021 until about May 2021. They were flattish until August 2021, when they started to be drawn down. The production of the gas basins (C) steadily increased, with the Haynesville production increasing faster than the Permian and Appalachian.
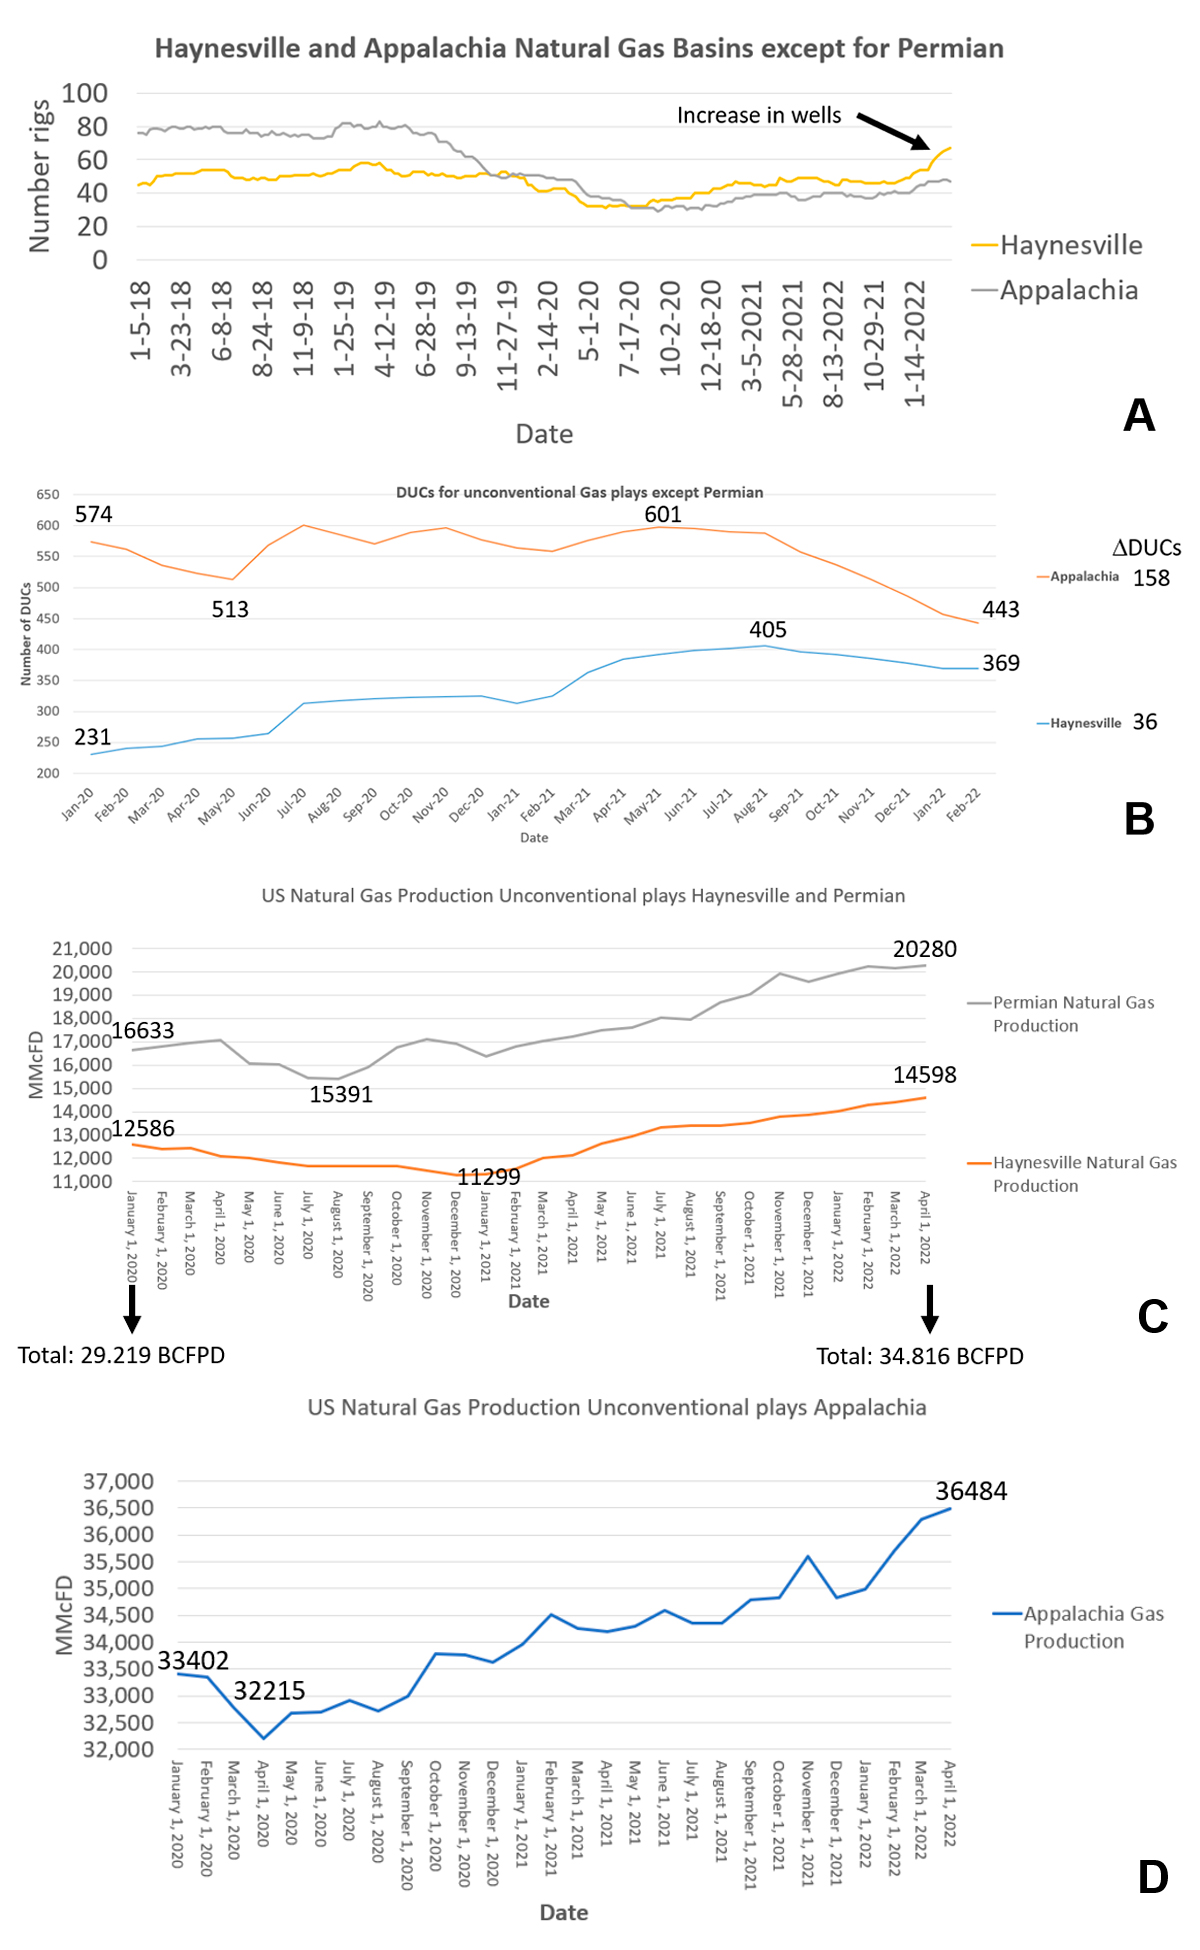
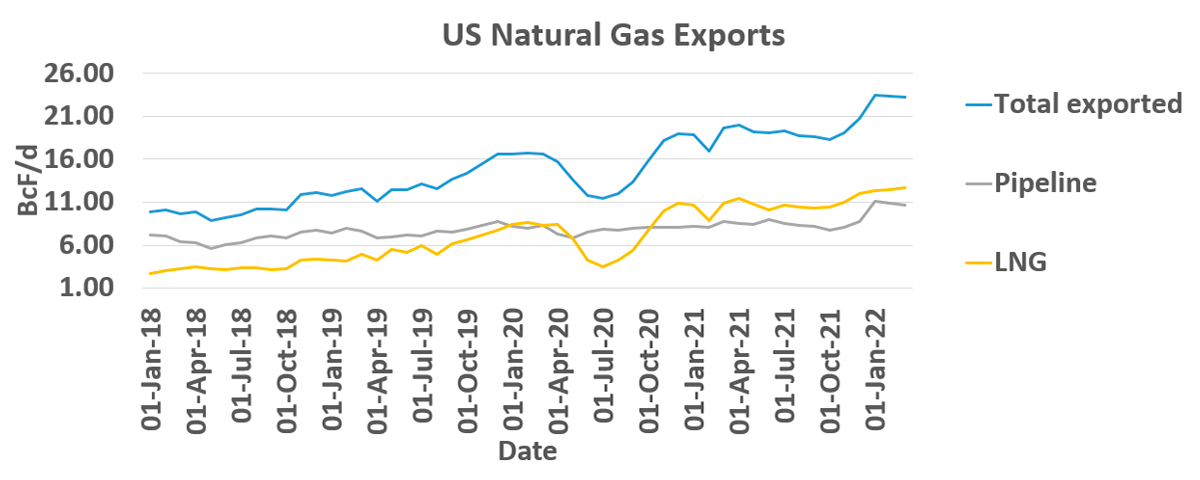
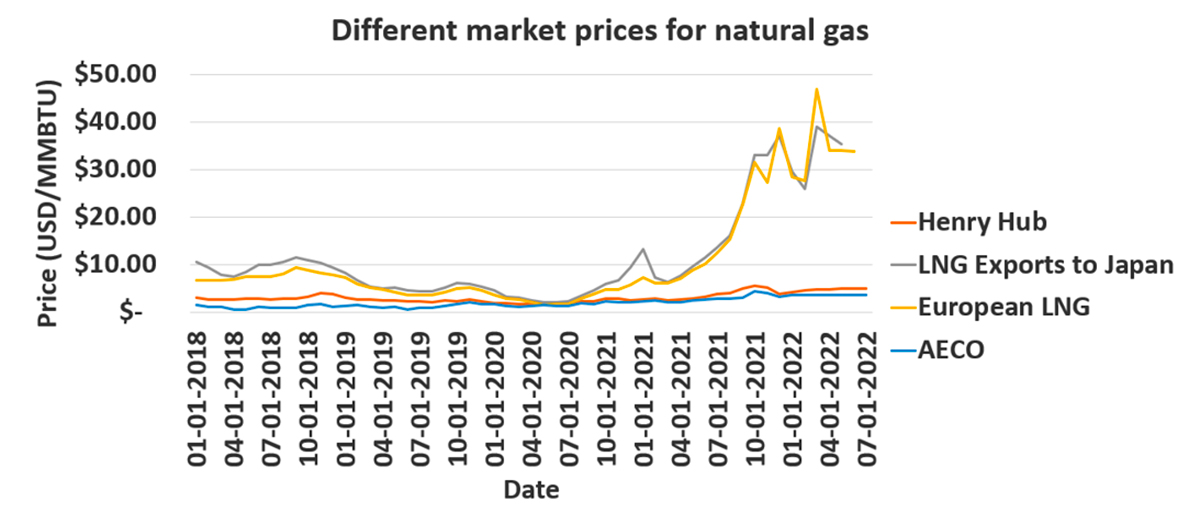
Figure 15 shows that the amount of LNG has surpassed 12 BCFPD, to meet the needs in Europe. In Figure 16, we can see how the price of LNG in Europe has jumped up due to the demand. One of the reasons for this price jump is the controversary around the Nord Stream 2 pipeline, with Germany suspending the process of certifying it and the U.S. imposing sanctions against it. Rising tensions between the Ukraine and Russia have also affected gas prices.
Other issues in Europe include that France had to shut down nuclear plants due to faults with welded pipes, Europe has been suffering a wind drought, and Germany is also planning to decommission all 17 of its atomic energy facilities by the end of 2022 (Bloomfield, 2021; Dalton, 2021; Mandal, 2021).
In Asia, China has been signing long-term contracts to minimize cost. So far, eight Chinese companies, including state-owned national oil companies, have signed nearly a dozen long-term contracts with overseas suppliers for a volume of nearly 980 BCF/year, or 2.7 BCFPD, more than half of which were signed in the September–November period when spot LNG prices hit record highs (Yap, 2021).
As the world transitions to cleaner energy, LNG is expected to be part of the solution for electricity generation as well as for producing blue hydrogen.
Russia has already signed a long-term deal with India to supply $25 billion USD worth of LNG over the next 20 years. Russia is investing heavily in infrastructure along the NSR (Nothern Sea Route) in the Russian Arctic, hoping for year-round sailing along this shipping lane. India wants to be a gas-based economy in the future. In 2021, India wanted to increase supplies of Russian oil and liquified natural gas and to use the NSR (All India, 2018; Danilov, 2021).
LNG Canada is expected to start up in 2025. The shipping route from Kitimat, B.C. to Asia is about 50% shorter than from the U.S. Gulf of Mexico (Shell, 2021).
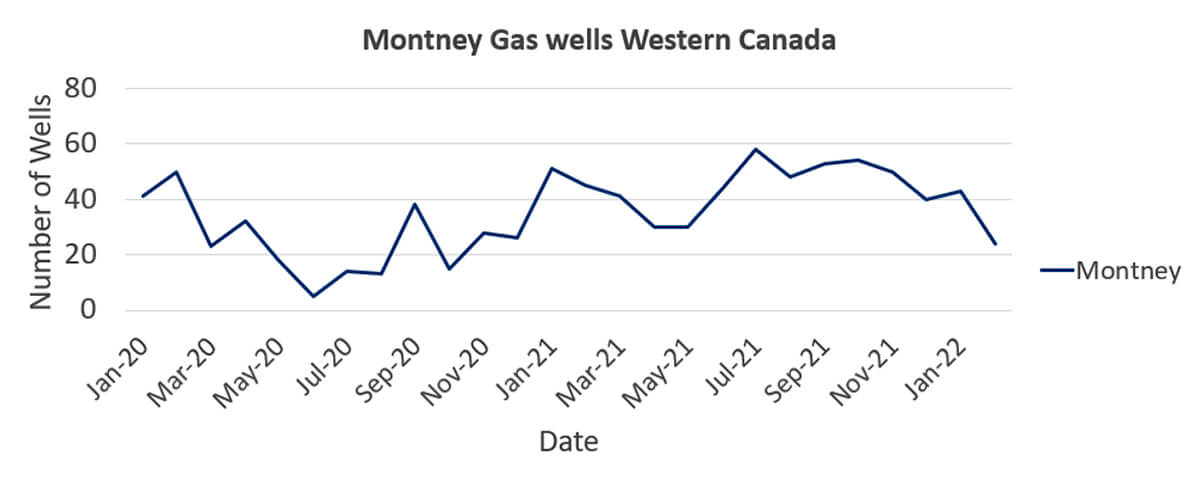
Montney
Most of the natural gas and natural gas liquids (NGLs) production in Western Canada are from the Montney formation.
With LNG Canada starting production, there will be more demand from the Montney, and it will use the Coastal GasLink pipeline, which is a 670-kilometre pipeline, to transport the natural gas from the Montney to the LNG Canada facility in Kitimat, B.C. We see in Figure 17 that there was even activity in the Montney during the downturn (April 2020–December 2020).
The Montney (Fig. 18) can minimally be broken down into three layers: upper, middle, and lower. We have also seen companies that are drilling the Montney also drill the Doig, which overlays the Montney, making this a fourth zone of interest.
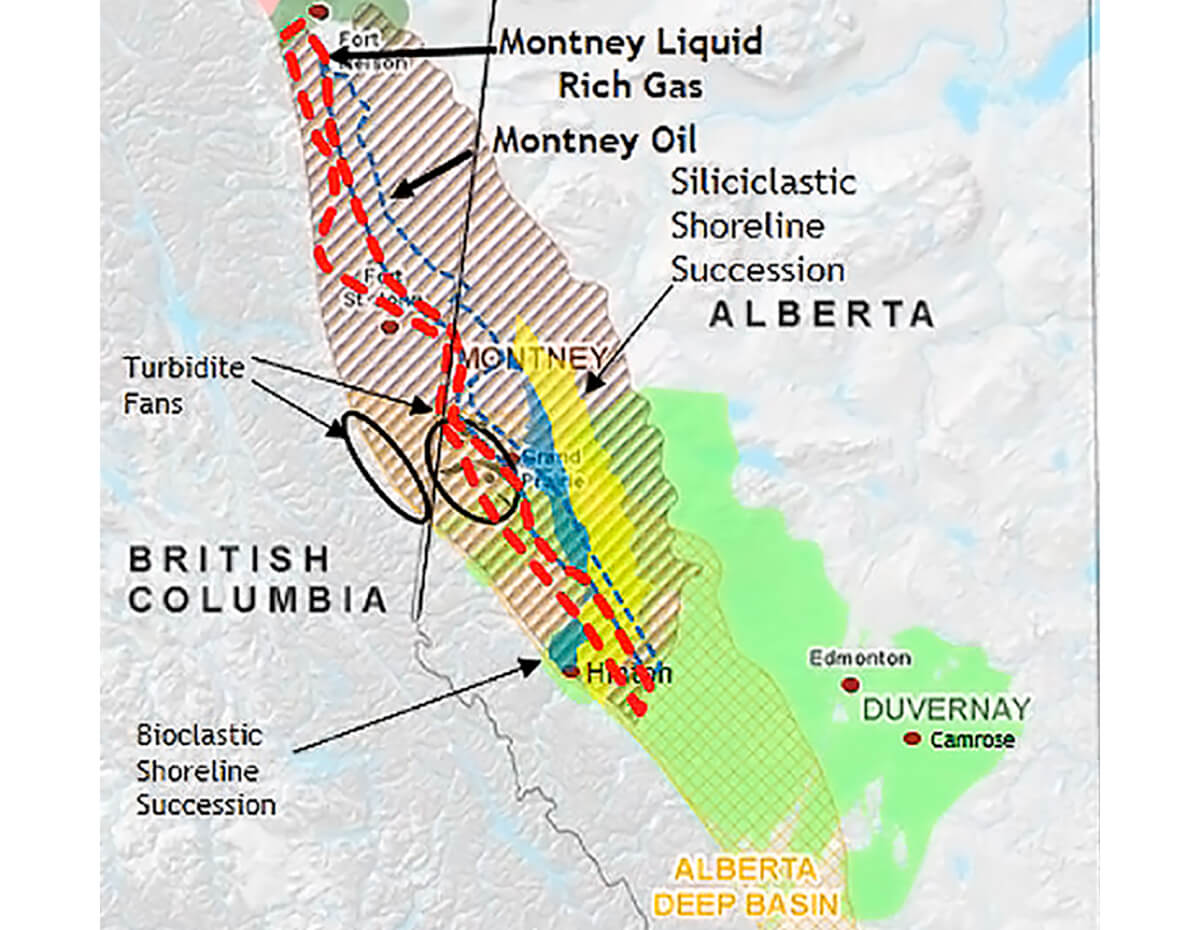
When companies first started drilling the lower Montney, they used the same frac parameters that they used for the upper Montney, with poor results. ConocoPhillips then decided to increase the intensity of its completions in three of its wells at Blueberry by pumping up to 10 times the proppant tonnage and fluid volumes per well versus its competitors’ wells. The higher intensity completion design yielded production results that were on par with the company’s upper zone completions from the same pad and are amongst the best lower zone producers (with significant liquids) in the Northern Montney (Horton, 2020; Fockler, 2020).
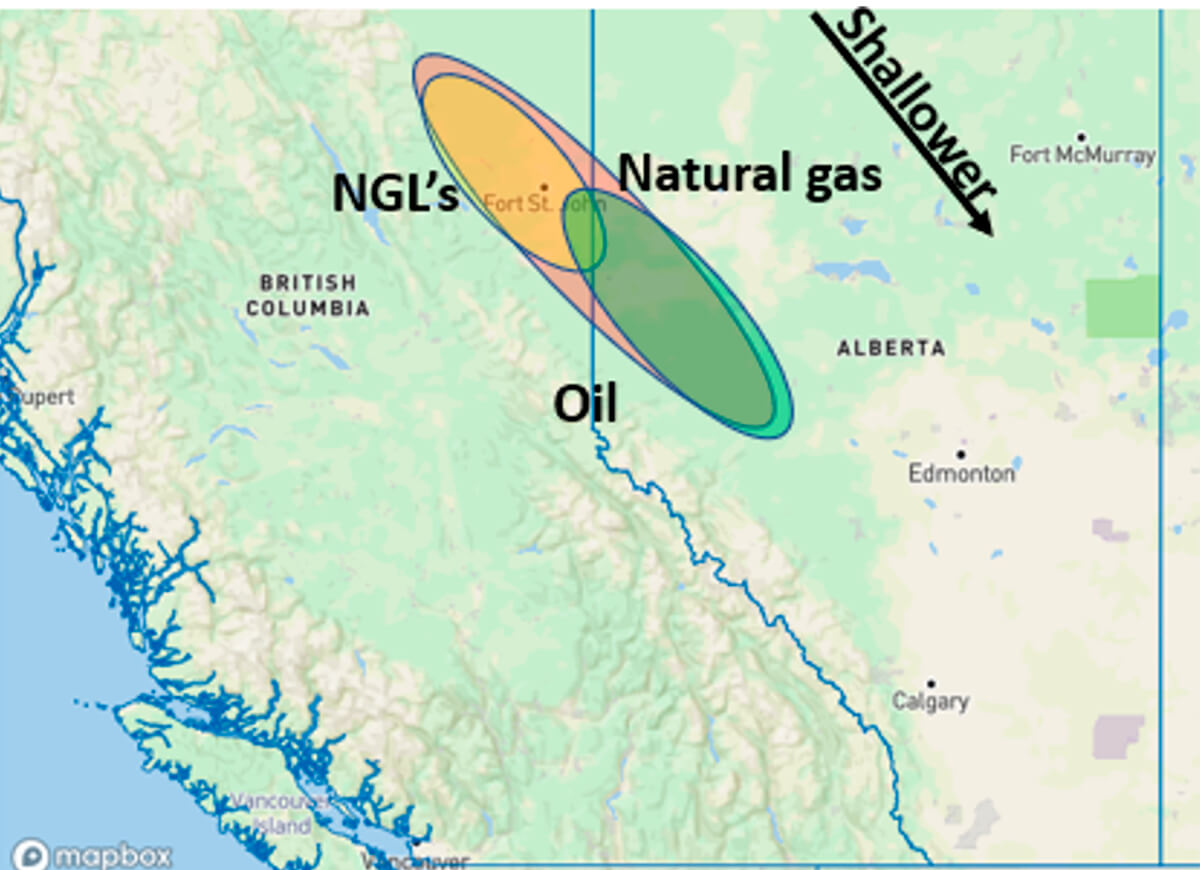
In the Montney, we have oil over gas, while in conventional plays, gas is over oil. The fluid distribution is based upon the geochemistry of the source rock and upon the temperature, which is controlled by the depth (Fig. 18).
Most of the drilling is occurring in N.E. B.C., which tends to be in the liquid-rich window (Fig. 19).
Fracture orientation
The Montney induced fractures tend to grow in a linear fashion because the ratio of maximum-to-minimum horizontal stress (SHmax/Shmin) is greater than 1.0, and the proppant tonnage will then keep these linear fractures open (Fig. 20).

Canada’s oil and gas industry
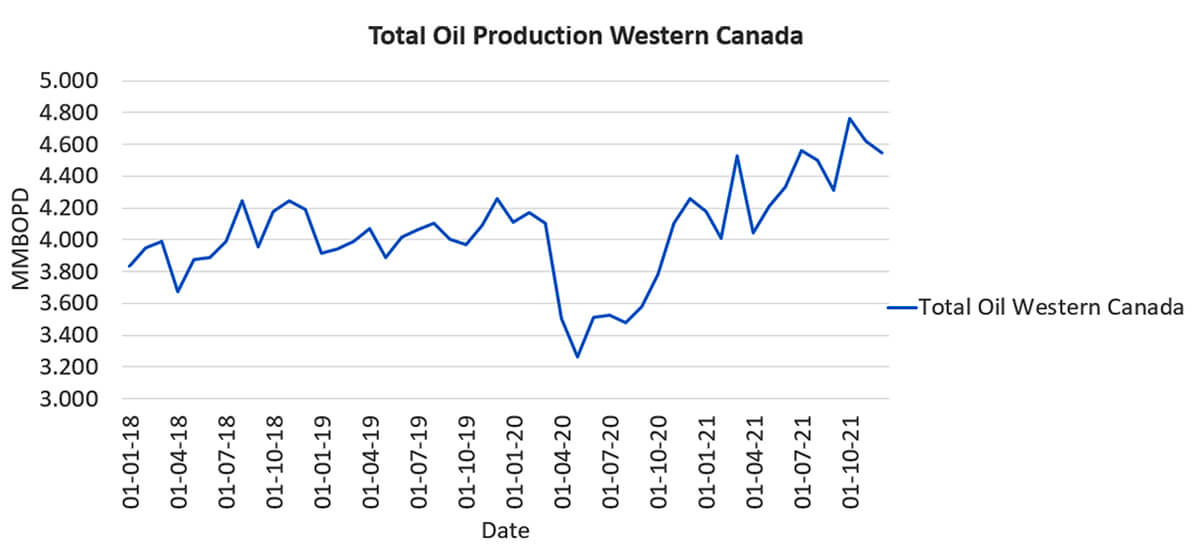
Despite high prices because of high demand, Canadian operators are choosing to spend on dividends, share buybacks, and increase production in existing assets instead of taking on new, large expansion projects (Kimani, 2022b).
We do see oil production in Western Canada is increasing (Fig. 21) and this is due to the increase in pipeline capacity has increased with Enbridge Line 3 coming online. Enbridge Line 3 expansion allows the line to pump a maximum of 760,000 BOPD, which is up from the 390,000 BOPD it could pump in the past almost doubling its capacity (Bakx, 2016).
Two-thirds of Western Canada’s oil production comes from oil sands. The oil sands can be broken into open pit mining, which makes up 20% and Steam Assisted Gravity Drainage, or SAGD, which are the other 80%. SAGD is used for deposits located at a depth greater than 200 m and a minimal thickness of 15 m to place two parallel horizontal wells. SAGD utilizes two horizontal wells being drill parallel to each other with the upper horizontal well, which is used for steam injection, and a lower production well that is placed as close as possible to the bottom of the reservoir and is used to extract the viscous bitumen to the surface (Wikipedia, 2021i; Anderson, 2012; Medina, 2020; Jaremko, 2022a).
With SAGD wells, the overburden, or cap rock, has special relevance since it must provide a barrier to prevent the loss of steam to shallower strata or, in the worst case, to surface (Medina, 2020).
How SAGD works is the injected steam forms a steam chamber and at the edges of the chamber, the steam condenses, which liberate heat mobilizing the bitumen by reducing the viscosity. Gravity drives the condensed water and hydrocarbons to the production well and the bottom of the chamber (Medina, 2020).
Oil sands tend to be unconsolidated sand so sand control such as slotted liners are required. Oil sands has also created Cold Heavy Oil Production with sand (CHOPS), which produces the sand with the oil. The permeability in CHOPS are wormholes that develop as the oil and sand are produced. CHOPS is used when the reservoir is located at a depth greater than 400 metres and the thickness of the reservoir is low (Talinga et al., 2021).
A typical oil sands SAGD project takes about three years to develop and open pit mines take about 5 years. They require financing, especially for the steam generation, engineering and design, steel, equipment, labour, new export takeaway capacity, and time (Jaremko, 2022a). In Figure 22, see that the number of bitumen wells drilled have not significantly increased, but operators are looking at ways to boost output. The goal is to increase production by a few hundred thousand barrels in 2022 (Reuters, 2022).
One of the ideas being looked at to boost production are longer laterals. In the unconventional plays like the Montney, longer laterals have increased production because more “reservoir rock” is exposed to the well and it has lowered drilling and completion (D&C) costs per foot, making long laterals more economical (Schulte and Felton, 2020).
In the last few years in the oil sands, there was a push to develop the tools to make long thermal wells to reduce Capital Expenditures (CAPEX), and in a recent study by Izadi et al. (2022), it was found that flow control devices (FCD) are the key enablers and an innovative strategy to drill longer wells. The Izadi et al. (2022) study also found using the completion strategy of combining long wells with FCDs improved the normalized oil production by 33% compared to short wells.
OPEC+ and lack of investment
OPEC+ has been unable to meet their production quota because of investment constraints that have resulted in declining supply. OPEC’s and Russia’s crude exports increased by about 1.8 MMBOPD since June 2021. The average monthly increase has only been about 300,000 BOPD, which is less than the agreed-upon 400,000 BOPD. This lower increase is due to countries like Angola and Nigeria dealing with an exodus of oil majors, years of underinvestment, maintenance issues, and unplanned outages. Currently, Saudi Arabia, the UAE, and Kuwait are providing most of OPEC’s production increases, but it may cut into their spare capacity (Reuters, 2021; Seeking Alpha, 2021).
As expected in January 2022, due to the harsh sub-zero temperatures, Russia had to shut-in wells and reduce pipeline flows. These shut-ins and reductions will reduce Russia’s ability to meet production quotas. Russia was expected to expand its oil production in 2022 and to continue growing it into 2023, but pandemic-related supply chain breakdowns and the threat of further lockdowns are creating headwinds on the planned ramp-up of industry activity to support the projected production growth.
The U.S. and the European Union have invoked sanctions against Russia in response to, among other incidents, the invasion of the Crimea and Eastern Ukraine, which will impact plans to grow petroleum production. Even more sanctions may be forthcoming. There is an additional problem: recent investment in developing greenfield and brownfield petroleum projects will not be enough to support the required growth in production, and with declining output from mature oilfields, particularly in Siberia, offsetting any new production, it will be difficult for Russia to grow production (Smith, 2022).
These examples show that, despite what the IEA believes, OPEC+ does not have the spare capacity to meet global oil shortages. This inability to meet oil shortages is coming at a time when the U.S. is still producing 1.2 MMBOPD less than what they produced in January 2020. It also means that, in spring 2022, we should expect the price of oil to continue to increase.
Saudi Aramco’s CEO, Amin Nasser, said at the World Petroleum Congress that oil and gas will play an essential and significant role during the transition and beyond. Admitting this reality will be far easier than dealing with energy insecurity, rampant inflation, and social unrest as the prices become intolerably high. These high prices may lead to seeing net zero commitments by countries start to fall apart (Ambrose, 2021).
Inflation
In the U.S., during December 2021, there was a 7% inflation rate, which is the highest in the last four years. In the U.K., the inflation rate was the highest in 30 years at 5.4%, and in the Eurozone, consumer prices jumped up by 5% in one month (Slav, 2022a).
We currently have inflation for various reasons (Oberoi, 2021; Paraskova, 2021b; Kenton, 2021):
- Demand has been quite strong for most products.
- Supply for many goods has not been keeping pace with demand.
- Higher raw material prices force producers to increase finished product prices.
- Underinvestment in upstream oil and natural gas since the 2015 oil price crisis, along with pressure on oil and gas companies to curb emissions, caused oil and gas companies to cutback production while practising capital discipline. These cutbacks have caused higher energy prices, which increases logistic costs for most goods, causing prices of goods to increase.
- Higher wages have been implemented.
- The U.S. government is pursuing an accommodative fiscal policy (federal reserve expands the money supply to boost the economy) because growth is slowing. The infrastructure bill and Build Back Better bill are long-term positive but add to inflation in short-term. The U.S. government has adopted a policy of increasing spending to help control inflation by addressing supply-side bottlenecks.
The concerns about inflation include:
- It reduces purchasing power.
- With inflation input, prices are higher, consumers can buy fewer goods, and revenues and profits decline.
- The economy slows for a time until a measure of economic equilibrium is reached.
Commodity prices soar, which erodes an investment portfolios. Current inflation is about lack of supply and not demand and underinvestment in commodities. Raising interest rates is a traditional way of slowing the economy down by making it more expensive to borrow money and encouraging people to save rather than spend. The issue is this inflation is more about lack of supply than demand so to fix the supply issue we need to change our fiscal and regulatory policies (Nguyen, 2022; Nutting, 2022).
Commodity super cycle
A super cycle is defined as an extended period of strong demand growth that suppliers struggle to meet, resulting in a rally that could last more than a decade (Mowra, 2021). Underinvestment tends to precede a super cycle, and it is the primary reason that producers are unable to meet demands. There have been four super cycles (Mowra, 2021):
- 1910s: the rapid industrialization of the U.S.
- 1930s: global rearmament before WWII
- 1960s: re-industrialization of Germany
- 2000s: rapid industrialization of Brazil, Russia, India, and China
The rapid industrialization of China resulted in an increase in demand for metals and natural resources, such as crude oil, copper, iron ore, and coal. India is expected to surpass the U.K. to become the fifth largest economy by 2025, and third largest by 2030 (Press Trust of India 2020), and to do this, India will require natural resources and fossil fuels.
Another issue is the fiscal and monetary policies of the governments to stimulate the economy are increasing the costs of commodities with lithium and energy (propane, natural gas, oil) leading the pack (Mowra, 2021).
With higher prices for oil and natural gas, oil and gas operators increased spending, especially after 2020, when most oil and gas operators were targeting $40 per barrel. High prices of oil and gas and capital discipline will re-attract investors into oil and gas.
With a third of the TSX benchmark composed of oil and gas firms and miners, we see the TSX has outperformed their U.S. counterparts. The S&P/TSX Composite has gained 2.6 per cent this year, while the S&P 500 Index slumped over 7 per cent. This is due to a rally in producers of crude oil and gold amid rising geopolitical tensions (Marotta, 2021).
At the start of the year, before the invasion of Ukraine, the Canadian Association of Petroleum Producers were predicting an increase in investment by 22% and predicted an increase of 18% in production or 4 MMBOPD (Slav, 2022b).
Tumultuous time for oil and natural gas prices after invasion of the Ukraine
This section was added before publication as an update to the forecast made above and to consider the unusual circumstances the world finds itself in with the invasion of the Ukraine. President Obama said it best when he addressed the annexation of Crimea using an illegal referendum in Crimea:
“…Ukrainians shouldn’t have to choose between the West and Russia. We want the Ukrainian people to determine their own destiny, and to have good relations with the United States, with Russia, with Europe, with anyone that they choose…” President Obama, March 20, 2014
February 24, 2022, Russian forces invaded the Ukraine. For many around the world this was shocking, but this was not the start of the conflict. The conflict really began in February 2014, after deadly clashes between protesters and security forces in the Ukrainian capital Kyiv which culminated in the ousting of elected President Viktor Yanukovych and the overthrow of the Ukrainian government. The protests were over President Yanukovych's sudden decision not to sign a political association and free trade agreement with the European Union (EU), and instead he chose closer ties to Russia and the Eurasian Economic Union (Wikipedia, 2021g; Wikipedia, 2021h).
The invasion of Ukraine has led to economic sanctions against Russia by the West and, because Russia is the largest exporter of natural gas and the second largest provider of crude, it has created a tumultuous time in the pricing of oil and natural gas and an increase in inflation (see Fig. 8 and Fig. 16).
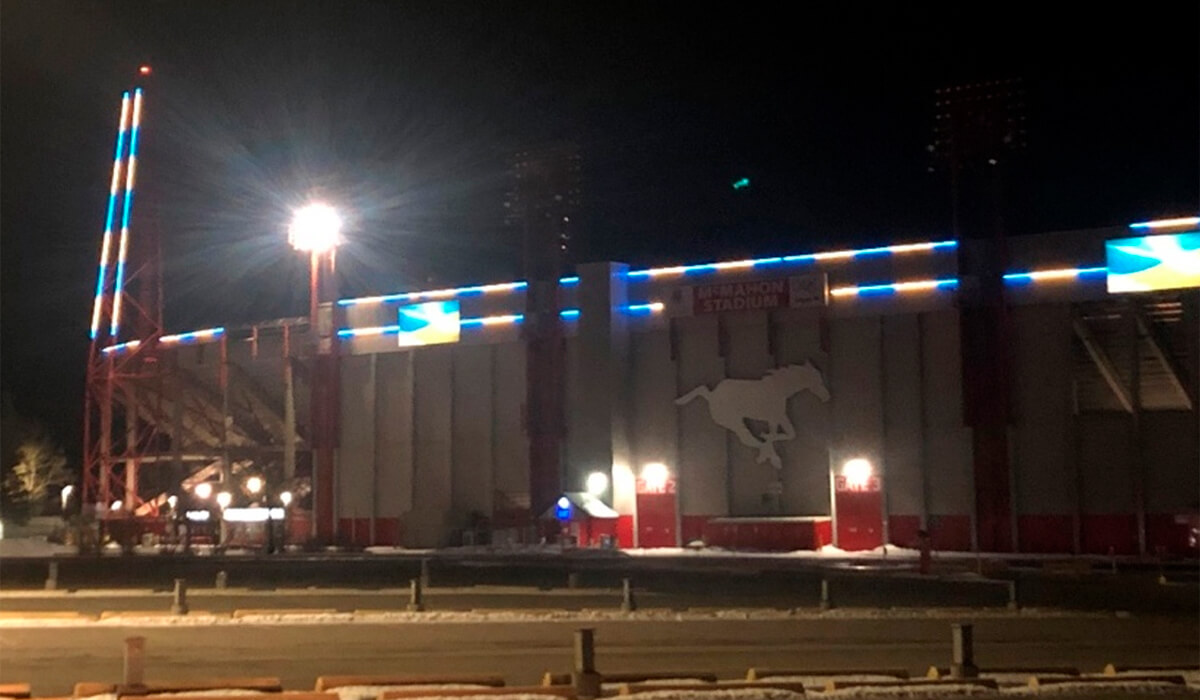
Many countries have shown their support for Ukraine, and many are imposing economic sanctions against Russia. Figure 23 shows how Calgary is showing their respect towards the Ukraine people by lighting up its football stadium with the colours of the Ukrainian flag.
IEA has reported that around 3 MMBOPD of supply of oil could be lost from Russia in April due to sanctions. Europe has not sanctioned Russian oil and gas stating that Europe’s supply of energy for heat generation, mobility, power supply and industry cannot be secured in any other way (Paraskova, 2022b; von der Buchard and Suque, 2022).
The U.S. was importing 209,000 bpd of crude oil and 500,000 bpd of other petroleum products from Russia which now needs to be offset (Al Jazeera, 2022a). The effect on the U.S. will not be that much, but the effect globally will be many other countries would also no longer be importing Russian oil, and that would decrease the supply of oil in an already tight market, which would drive up the price of oil and in turn drive inflation, and that will affect the U.S. economy (Al Jazeera, 2022a). Currently, central banks are trying to avoid runaway inflation because it can lead to a recession.
Many believe that the production should come from the shale plays but the oil from the shale plays tends to be light oil and Russian oil is heavy. Shale plays are easy to dial back by shutting wells in and have been easy to increase production by completing DUCs but a significant number of DUCs have already been completed. Not all DUCs that are being tracked by the EIA end up being good producing wells. There are other issues with increasing production in the shale plays / unconventional plays (Paraskova, 2022b):
- Time lag between drilling and first oil
- Years of underinvestment and current capital discipline
- Federal policies toward the oil industry that discourage drilling
- Supply chain bottlenecks
- Significant labour shortages
- Lack of infrastructure and pipeline bottlenecks
- Sand shortages (Hampton, 2022)
- Steel tubing shortages (Slav, 2022c)
- Operators that have gone bankrupt in 2020 (Rapier, 2022)
- Depletion rates. With conventional wells the depletion rate is a minimum of about 3 per cent and, for unconventional plays, on average it is more than 20 per cent. To be conservative the global decline rate is approximately 7 per cent which means to keep production flat on a 100 MMBOPD base need to add 7 MMBOPD of production (Rapier, 2022; King, 2020).
Investors are asking to keep production flat and are pushing back on increasing the production.
It is not to say operators are not drilling, they are. The number of rigs has continually increased, and we see that in figures 6A, 7A and 13A. Drilling is up 60 per cent year-over-year according to the Baker Hughes North America rig count (Rapier, 2022).
Private equity companies have been one of the main drivers of increasing the rig count. They are trying to take advantage of the high price of oil and natural gas while publicly traded companies have been drawing down their DUCs. This is because private equity companies do not have stockholders who are requiring significant returns. Example of this is the increase in rigs in the Haynesville (fig. 13a) which is mostly operated by private equity companies.
Even if shale plays manage to increase production, it cannot grow by more than 1.4 MBPD this year given labor and infrastructure constraints (Paraskova, 2022b). As shown above to keep global production flat we need to increase the production by a minimum of 7 MMBOPD (King, 2020).
Canada
Many in the U.S. Congress and the Alberta government are pushing to resurrect the Keystone XL pipeline, which would have a capacity of 830,000 BOPD. This oil would not be just for the U.S. market, but it would give Western Canadian Select (WCS) access to the global market, which is limited in Canada with just one pipeline, TMX, going to tidewater which has a capacity of 300,000 BOPD. With the current twinning of the TMX it will expand the capacity to 890,000 BOPD but has met many protests which has caused it to be delayed. Getting WCS to the global market will increase the supply of oil to places like Europe and Asia (Varcoe, 2022).
In December 2021, Canadian exports from the U.S. Gulf Coast averaged more than 180,000 BOPD, reaching 300,000 BOPD in December, which is a record. The oil is being sent to India, China and South Korea (Kelly and Williams, 2022).
Canadian oil sands operators are looking at ways to increase production from existing oil sands projects in the near term and believe it can be increased by another 200,000 to 400,000 BOPD. Knowing that, Minister of Natural Resources, Jonathon Wilkinson, has pledged that Canada will increase oil exports by 300,000 BOPD (Oil sands 130000 BOPD; conventional 60000 BOPD; Newfoundland 10000 BOPD) and 600 MMcfd to help other nations to move away from Russian energy supplies (Al Jazeera, 2022b; Jaremko, 2022b; Bloomberg, 2022b).
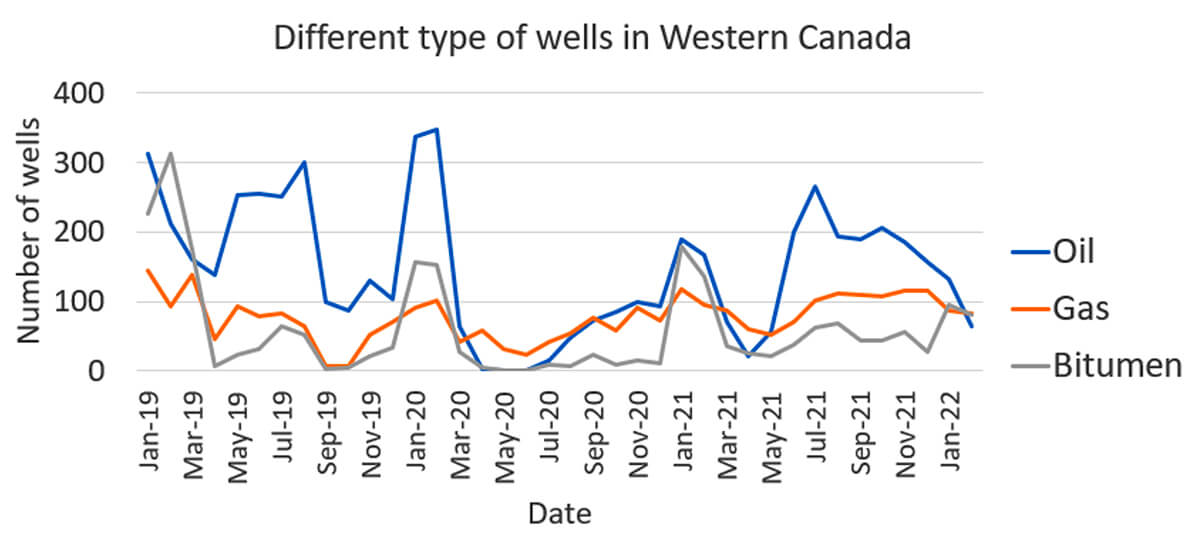
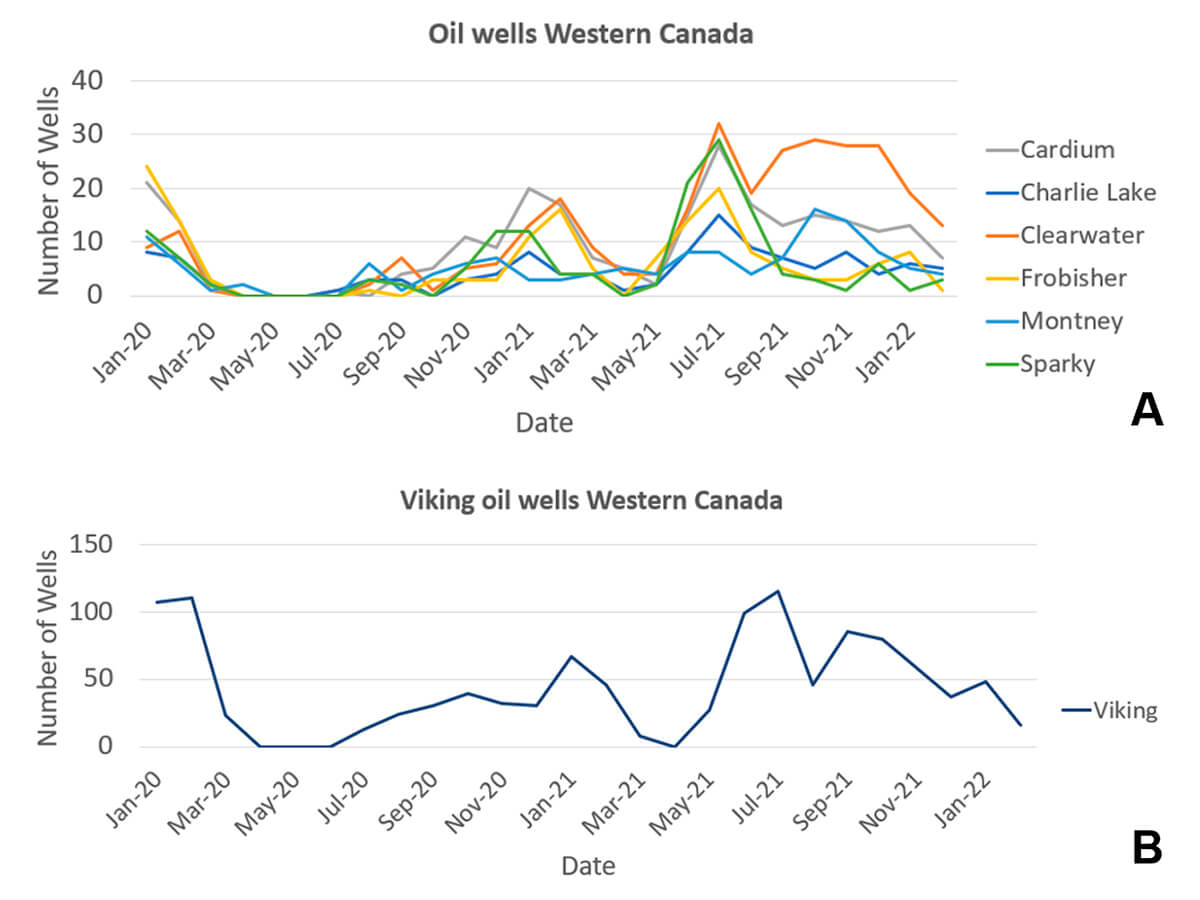
Conventional drilling of plays like the Viking, Cardium, Montney, Charlie Lake, Clearwater, etc. are suffering similar issues drilling as the U.S. shale plays with one of major issues being a significant labour shortage that has affected the industry this year making it hard to staff rigs and quickly drill more wells (Stephenson, 2022).
How operators plan to increase this production is by bringing forward production increases that were already expected for 2023 and 2024 but this will not occur until the second half of the year because of the seasonality of the oil and gas industry (Bloomberg, 2022b). We can see that seasonality in Figure 24, with decreases in drilling during the springtime due to road bans prohibiting movement of heavy equipment during the spring thaw.
Figure 24A shows a lot of activity in the Clearwater which is being produced using unstimulated open-hole multilateral horizontal wells that maximize reservoir contact and economically produce the heavier crude oil. This play does not involve completions but involves drilling multi-leg wells. The horizontal lengths seem to be fixed at 1600 metres or 1 mile with operators experimenting with leg count and inter-well spacing to maximize reservoir exposure, maintain drilling efficiencies, and minimize costs (GLJ, 2022).
With the sanctions in place in late March 2022, we see Russian oil exports down 25.4% (Paraskova, 2022c) and U.S. oil exports climbing reaching 3.8 MMBOPD for the week of March 18, the highest since July 2021. The increase in the export of oil is causing domestic oil that typically goes to storage being exported through the Gulf Coast (Kelly et al., 2022). The U.S. will be requiring more oil to meet the world’s demand; it is not so much about the domestic but the global market.
LNG in Canada
We see similar issues on the limitation to the global market for our natural gas with only one LNG facility currently being built in Can

Related Reading


Join the Conversation
Interested in starting, or contributing to a conversation about an article or issue of the RECORDER? Join our CSEG LinkedIn Group.
Share This Article