Abstract
Several physical seismic models of simple wedges were built to assess amplitude effects commonly associated with the classic ‘Widess’ wedge. Rather than producing simple tuning associated with thin beds, 2D zero-offset seismic surveys over these physical models showed a surprising number of high-amplitude dipping events corresponding to pure-mode , mixed-mode, and doubly-converted multiples within the wedge. Finite-difference exploding reflector models, using numerical versions of the same wedge velocity models, were generated to assist in the identification of these events. Amplitudes of the top-wedge and base-wedge reflections show additional complexities not observed in simple acoustic seismic models of the wedges. Migration of the physical model data was accomplished using 2D poststack Kirchhoff time and depth migration. This study suggests that puremode and converted-wave multiples can be significant, high-amplitude events in data recorded in the presence of high-velocity rocks with a wedge-like geometry.
Introduction
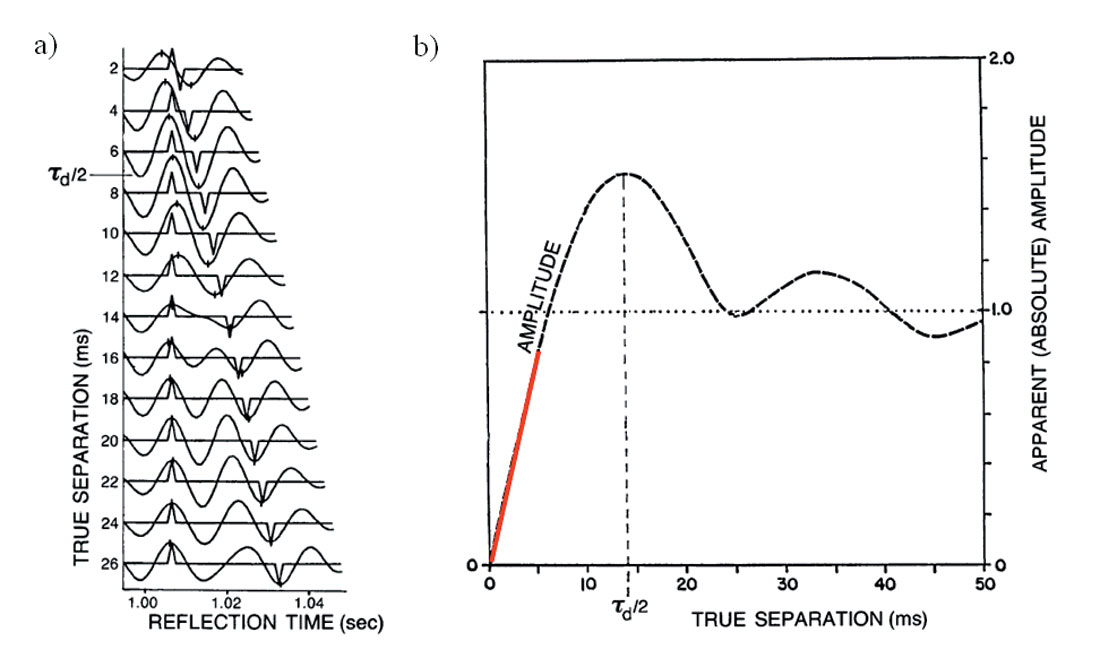
Wedge models are important in seismic imaging; they are analogous, for example, to wedges of carbonate rocks carried in thrust faults in the Rocky Mountain Foothills, edges of thin salt pillows, and irregular permafrost or basalt encountered in Canadian frontier basins. Widess (1973, 1982) provided a foundation for understanding how the amplitude of reflection events changes as the thickness of a bed decreases below the dominant wavelength of the seismic data. The wedge model considered by Widess involves two equal but opposite reflection coefficients, from the top and base of a thinning bed. When the bed thickness is large, the top-wedge and base-wedge reflections are separate. As the bed thickness decreases, the two events become closer together in time and start to interfere, forming a composite reflection event. When they are separated by half a period (two-way time), or a quarter wavelength (one-way distance), amplitude tuning, or maximum constructive interference, occurs. Widess found that as the bed thickness decreases further, below one eighth of a wavelength, the amplitude is, to a first-order approximation, linearly related to the thickness of the bed (Figure 1). The spikes in Figure 1a) indicate the reflection coefficients for the top and base of the bed, positioned in time as they become closer together. Also shown are the traces corresponding to the associated reflection events from the two interfaces. In Figure 1b) the amplitude of the composite reflection event as a function of time separation of the reflections is displayed. It shows the constructive interference resulting in tuning at a separation of half the dominant period of the wavelet and the approximately linear amplitude relationship for small separations or, equivalently, small bed thicknesses.
We furthered the study of wedge reflections by analysing 2D seismic data recorded over simple wedge models in the physical modelling laboratory at the University of Calgary. In addition, similar numerical wedge models were produced using a finite-difference technique. The physical model data yielded several unexpected high-amplitude events; raypaths for these events were identified by comparing the numerical and physical model datasets, as well as by numerical analysis and graphical raytracing.
Physical seismic modelling generates a seismic response using a laboratory-scale geological model (Edwards, 1992). A model is constructed using materials such as metal or plastic. A source, typically a piezoelectric transducer, emits seismic energy into the model and the reflected wavefield is recorded. The assumption underlying the physical modelling approach is that scaled physical mechanisms are identical to field physical mechanisms, in other words that seismic waves propagate identically in both settings (Ebrom and McDonald, 1994). Historically, physical modelling was used when computing technology was not adequate for numerical modelling. However, even with modern advances, physical modelling can still lead to better understanding of wave propagation in complex media such as 3D elastic and anisotropic models. In addition, since the physical models have known geometries and physical properties, they are ideal for comparisons with numerical models and field data from similar geological situations, as well as for tests of processing, imaging, and modelling algorithms (Lawton et al., 1998).
At the University of Calgary, the Consortium for Research in Elastic Wave Exploration Seismology (CREWES) maintains physical modelling facilities capable of both acoustic and elastic modelling, as described by Cheadle (1988) and Lawton et al. (1989). Anew, high-precision elastic physical modelling system is currently being assembled and should be operational in late 2007.
The Wedge Models
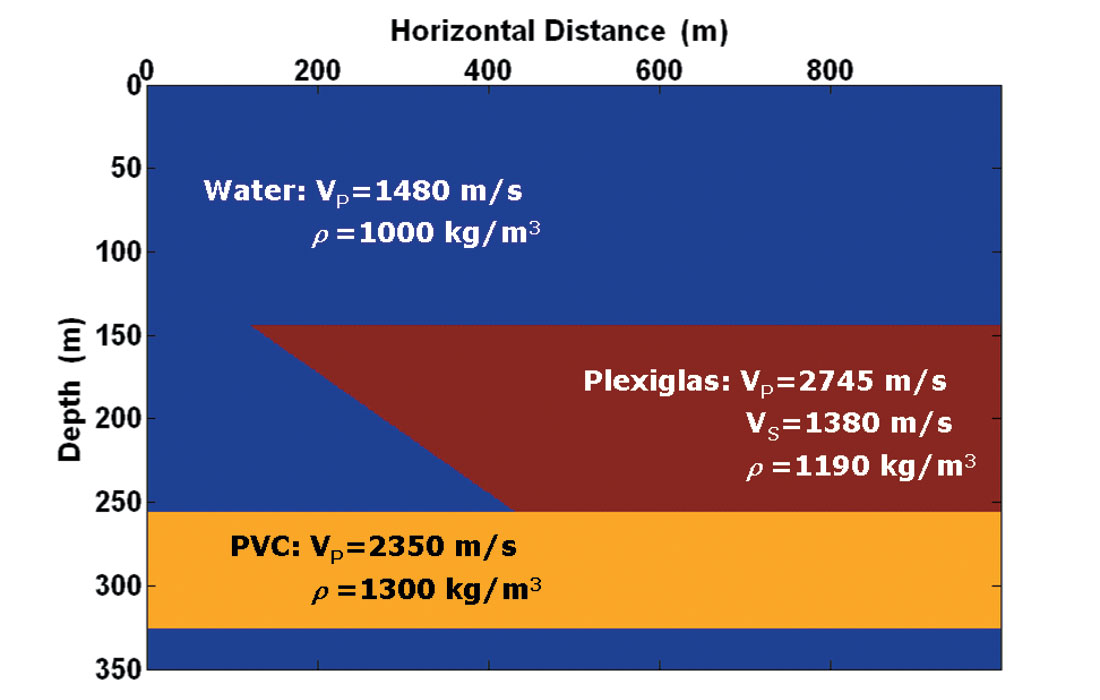
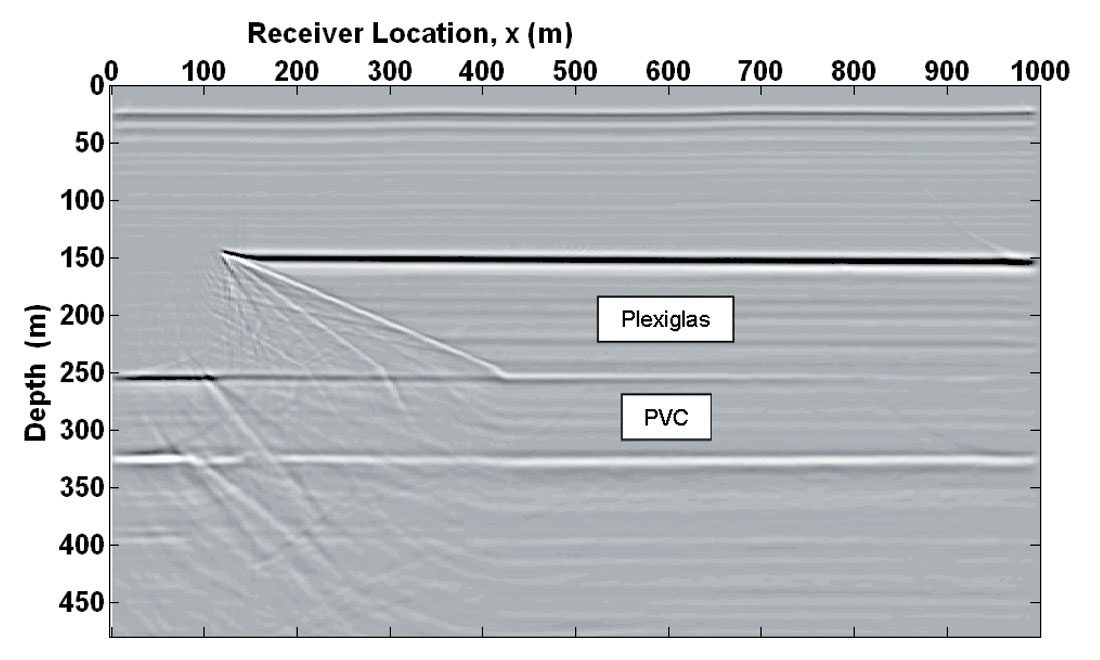
The wedge models in this study consisted of Plexiglas resting on a PVC slab and immersed in water, as shown in Figure 2. The scaling factor used for distance in the models was 1:2500, so that the approximately 40 cm long by 20 cm deep model represented 1000 m in horizontal distance and 500 m in depth. In this discussion the laboratory scale dimensions of the physical model will be referred to as “scaled”, while the represented field dimensions will be called “field scale”. The velocities and densities of the materials in the model were not scaled and these properties are shown in Figure 2. Four different wedge geometries were modelled: the so-called 5, 10, 15, and 20 degree wedges. This article will focus on the results from the 20 degree wedge.
A 2D zero-offset survey was conducted over each of the four wedge models, each with 400 traces at a trace spacing of 2.5 m (field scale). The source and receiver consisted of spherical piezoelectric transducers in water, emitting frequencies in the range of 100 to 600 kHz (scaled) (Hrabi, 1994). The source pulse generated was a linear-phase wavelet produced by the staggering of three separate wavetrains (Edwards, 1992). Though the source and receiver had an offset of zero in the inline direction, they could not be located truly at zero offset due to their physical size. They were therefore placed side-by-side aligned perpendicular to the acquisition direction, giving them an offset out of the plane of the section of approximately 40 m (field scale). This offset was neglected in the analysis of the data, though the direct arrival between source and receiver was identified. Since the velocities in the model were unscaled and the distance scaling was 1:2500, the time scaling used was necessarily 1:2500 as well. The number of time samples recorded was 4096 for each of the four surveys. Data were recorded at a sample rate of 0.125 ms (field scale), with a record length of 0.512 s (field scale). Raw (ungained) data for the 20 degree wedge are displayed in Figure 3.
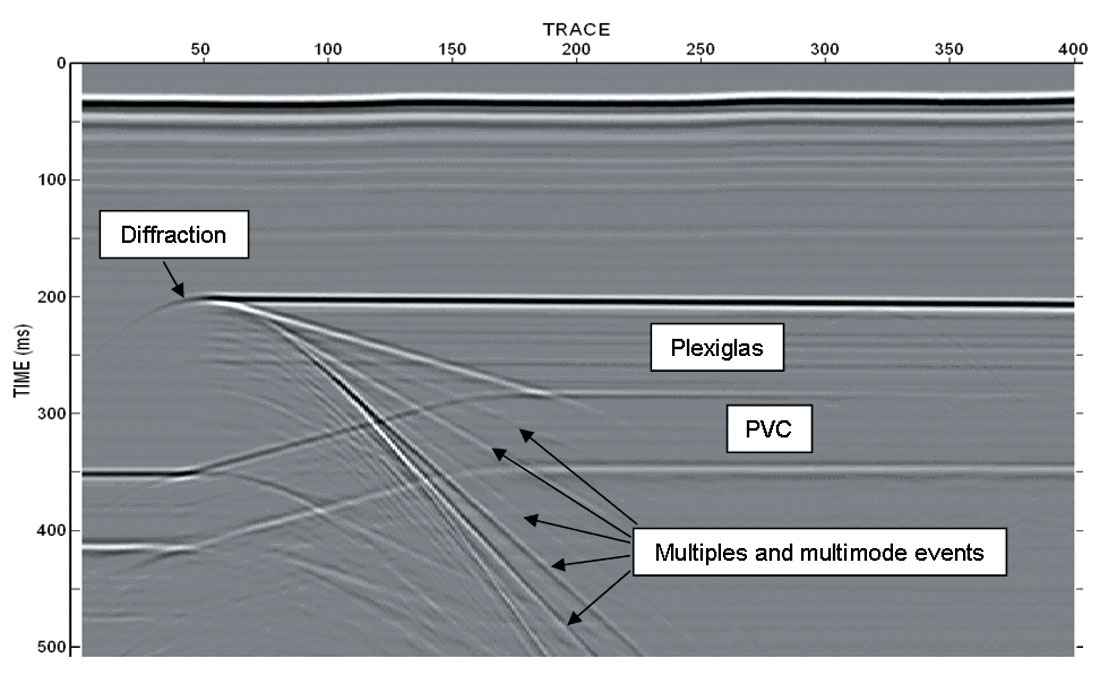
The direct arrival from source to receiver is clearly seen at 25 to 30 ms. The event corresponding to the top of the wedge appears at approximately 0.195 to 0.2 s. The top and base of the PVC appear at 0.345 s and 0.415 s, respectively, on the left side of the data and are subject to pull-up under the higher velocity Plexiglas wedge. Diffracted energy is clearly visible at the tip of the wedge. The data also display other events whose origin was not immediately certain, in particular, the dipping events originating near the tip of the wedge. The presence and especially the high amplitudes of these events were unexpected when the model was first designed.
Numerical Modelling
A primary objective of the study was to identify the events visible on the physical model data. To facilitate this, numerical models were created and used, along with graphical raytracing, to find the traveltimes and modes of the different events. The numerical modelling method used was a 2D acoustic finite-difference algorithm (Youzwishen and Margrave, 1999). Exploding reflector models were created using the known wedge model geometries and velocities. An exploding reflector model is one in which sources are placed along each reflector in the model and are initiated at time zero, allowing waves to propagate to the surface at velocities equal to half the physical velocities. The exploding reflector model approach was chosen for this study because exploding reflector models are good approximations for zero-offset sections (i.e. similar to the surveys recorded over the physical models). The parameters for the modelling were chosen to be as similar as possible to the physical model data: the receivers were located on the surface every 2.5 m, the time sample rate and step size were 0.125 ms, and the wavelet was zero phase. The grid spacing was chosen to be 1 m in order to achieve suitable detail in the velocity model. An Ormsby filter of 10-15-100-120 Hz applied to the models produced an acceptable trade-off between resolution and removal of numerical dispersion. The exploding reflector model for the 20 degree wedge is shown in Figure 4.
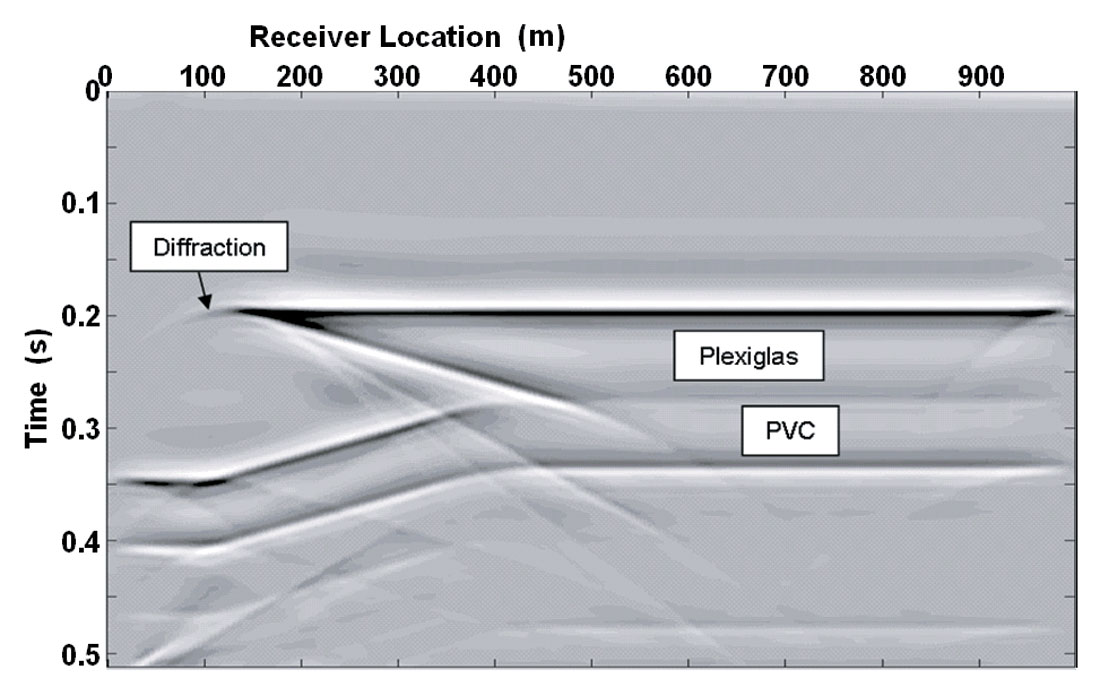
The exploding reflector modelling simulates multiples, but because the finite-difference algorithm used was acoustic, the models do not include mode conversions. Some edge effects are present due to the inadequacy of the absorbing boundary conditions, as discussed by Youzwishen and Margrave (1999).
Event Identification
Examination of the exploding reflector models, combined with graphical raytracing, allowed for the identification of events visible on the physical model data. These included primary reflections, pure-mode as well as mixed-mode multiples, and diffractions. Pure-mode P-wave multiples were designated by the expression P[PP]nP and mode-converted S-wave multiples by the expression P[SS]nP where n is the number of ray segments within the wedge. The traveltimes for both of these types of multiples were found to obey a single analytical expression, given by
where νP and νW are the velocities of Plexiglas and water, respectively (νP can be the P-wave or S-wave velocity), dW is the depth of the water above the wedge, D is the dip of the wedge, n is defined as above, and x is the distance from the source-receiver pair to the tip of the wedge. The parameter x in the expression is restricted to distances that will actually produce reflections from the angled part of the wedge. Figure 5 shows the exploding reflector model for the 20 degree wedge with lines plotted according to this expression, falling on events that correspond to the pure-mode P-wave wedge multiples.
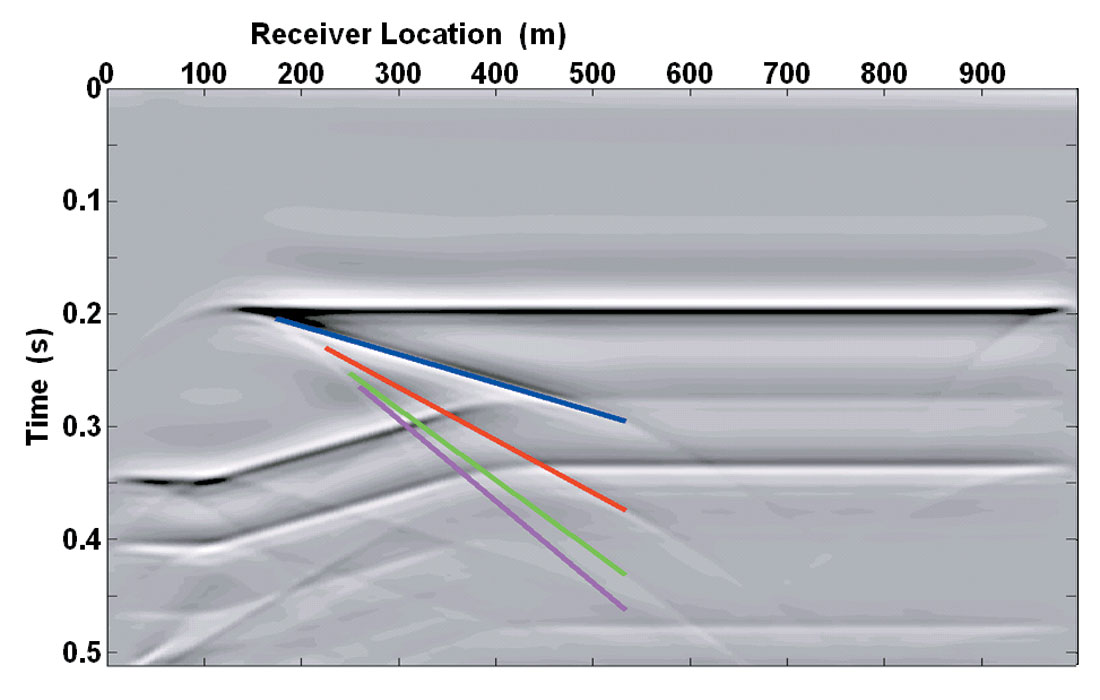
During the analysis it was found that there is a maximum number of pure-mode wedge multiples possible for a given wedge angle. For pure P-wave events, the number of multiples is given by n*D < 90°. This means that for the 20 degree wedge there are a maximum of four pure P-wave events from the angled part of the wedge. For events that convert to shear waves in the wedge, of the form P[SS]nP, the same relationship holds, but there is an additional constraint related to the critical angle at the upper surface of the wedge. The relationship is given by sin(n*D) < γ, where γ is the ratio between the S-wave velocity of Plexiglas and the P-wave velocity of water. This means that for the 20 degree wedge there are three events of this type possible.
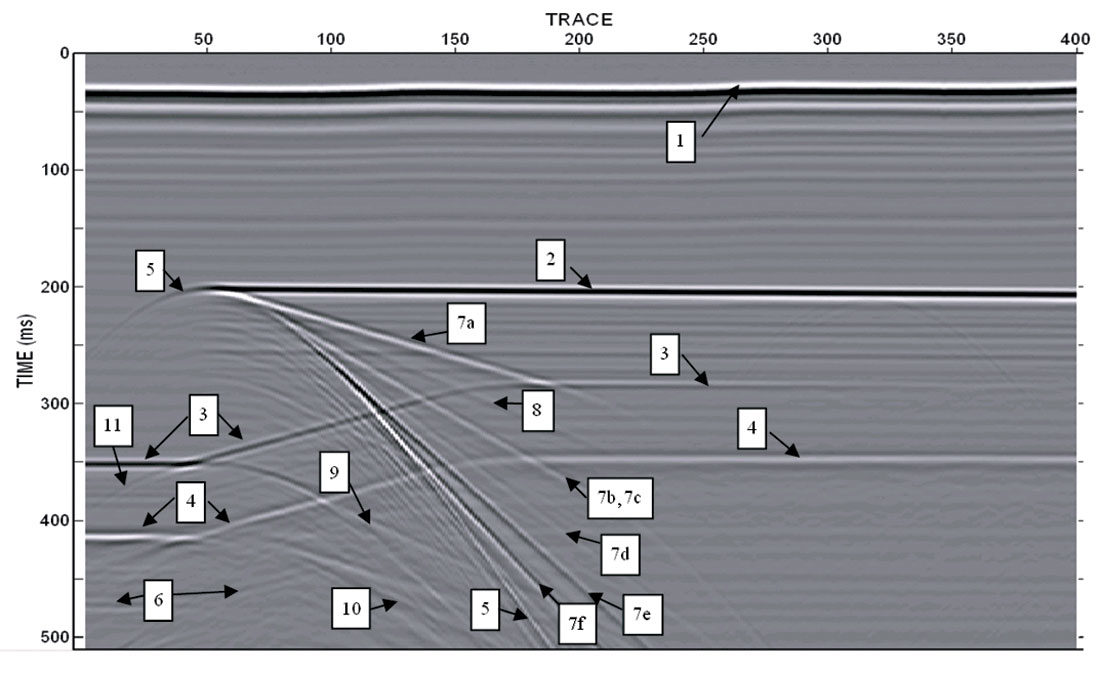
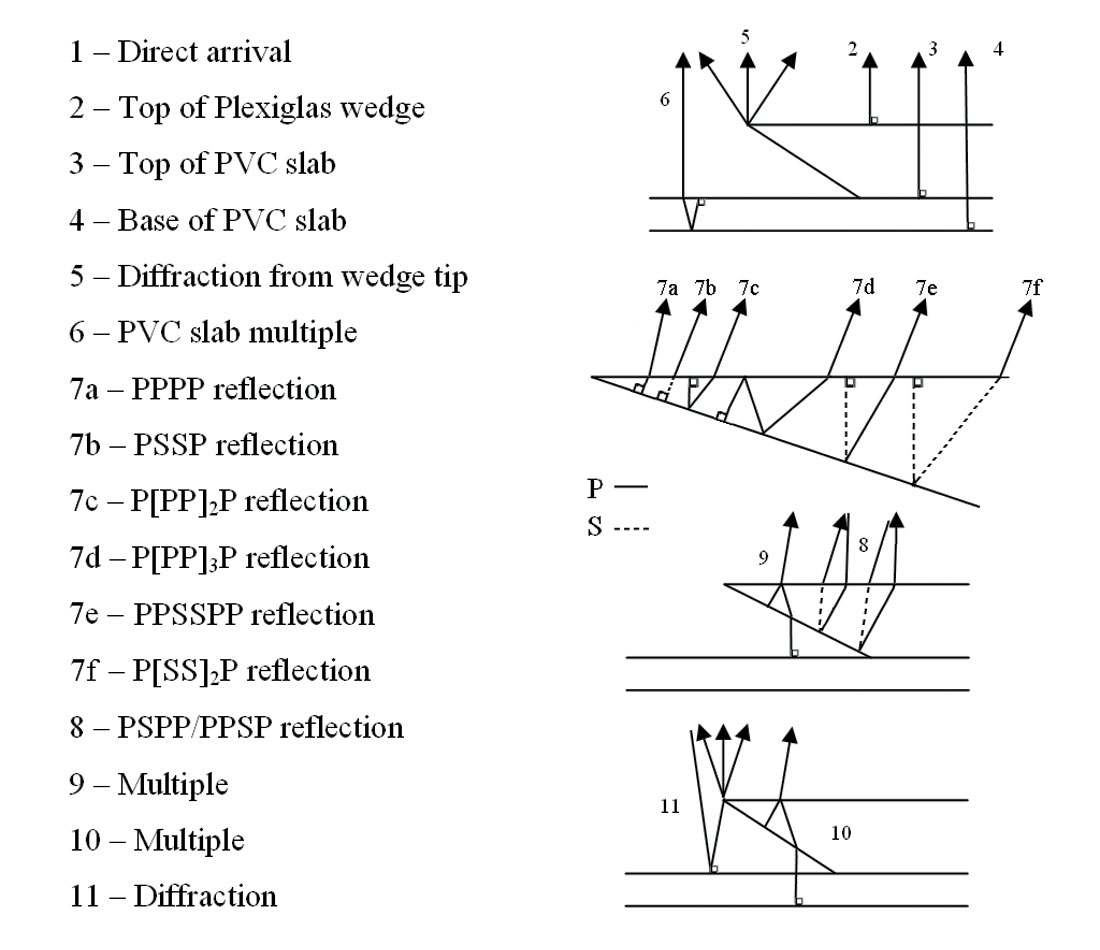
Figure 6 shows the physical model data from the 20 degree wedge with all events identified, as determined from the exploding reflector models and using raytracing. Two events of interest not previously mentioned are the high-amplitude PPSSPP event and the PSPP or PPSP event. The first is a converted-wave multiple that underwent mode conversion upon reflection at the base of the wedge, instead of upon transmission through the top of the wedge; the second is an example of a zero-offset yet non-normally incident reflection, which has a non-reciprocal raypath. The high-amplitude mixed-mode and converted-wave multiples are caused in part by the velocities of the model, particularly the fact that the S-wave velocity in the wedge is quite similar to the P-wave velocity in water.
Amplitude Analysis
Motivated by the unexpected high amplitudes of the multiples and multi-mode events in the physical model data, an analysis was performed to determine the predicted relative amplitudes of the events. This was accomplished using the Zoeppritz equations to calculate the reflection and transmission coefficients for the interfaces encountered by the different events; the appropriate angles of incidence, reflection, and transmission were found using the geometries of the raypaths determined by raytracing. Table 1 lists the predicted amplitudes of the events, normalized to a value of 1000 for the primary PP reflection from the top of the wedge. The true amplitudes of the events are less than those predicted by this analysis since the effects of spreading loss and attenuation were not considered in the amplitude calculations. However, the exercise does confirm that some of the multiples and multi-mode events are indeed predicted to have significantly high amplitudes, as is seen in the physical model data. Amplitudes of some of the closely-spaced dipping events are also affected by constructive and destructive interference.
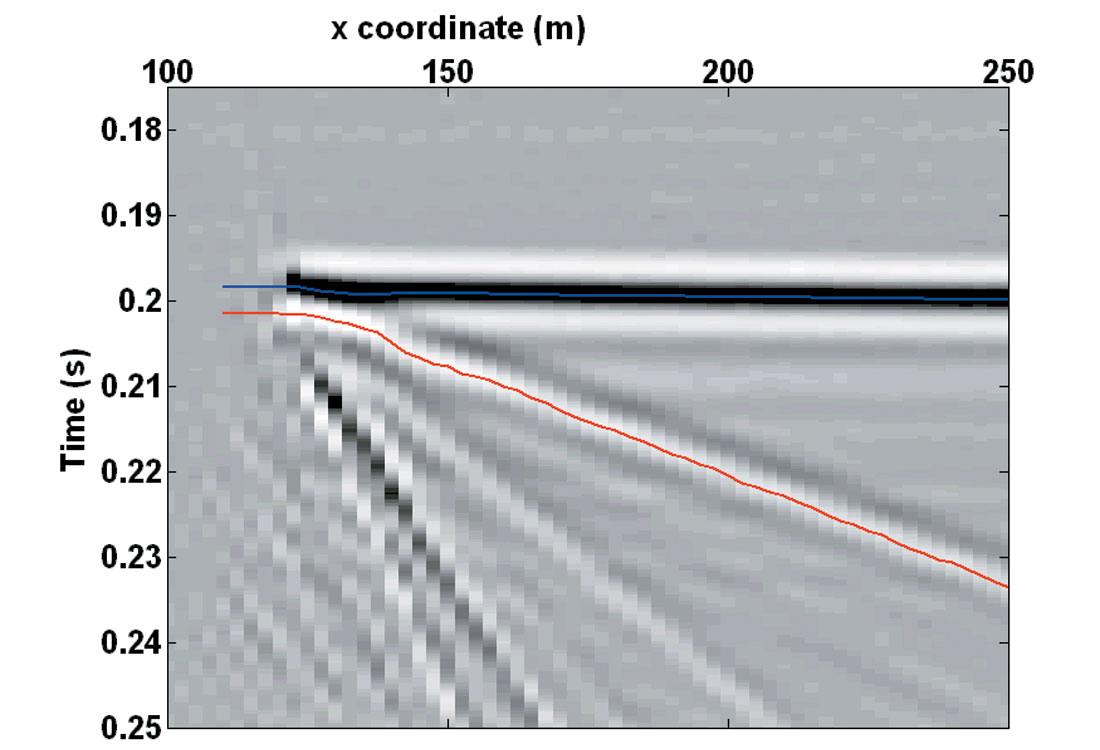
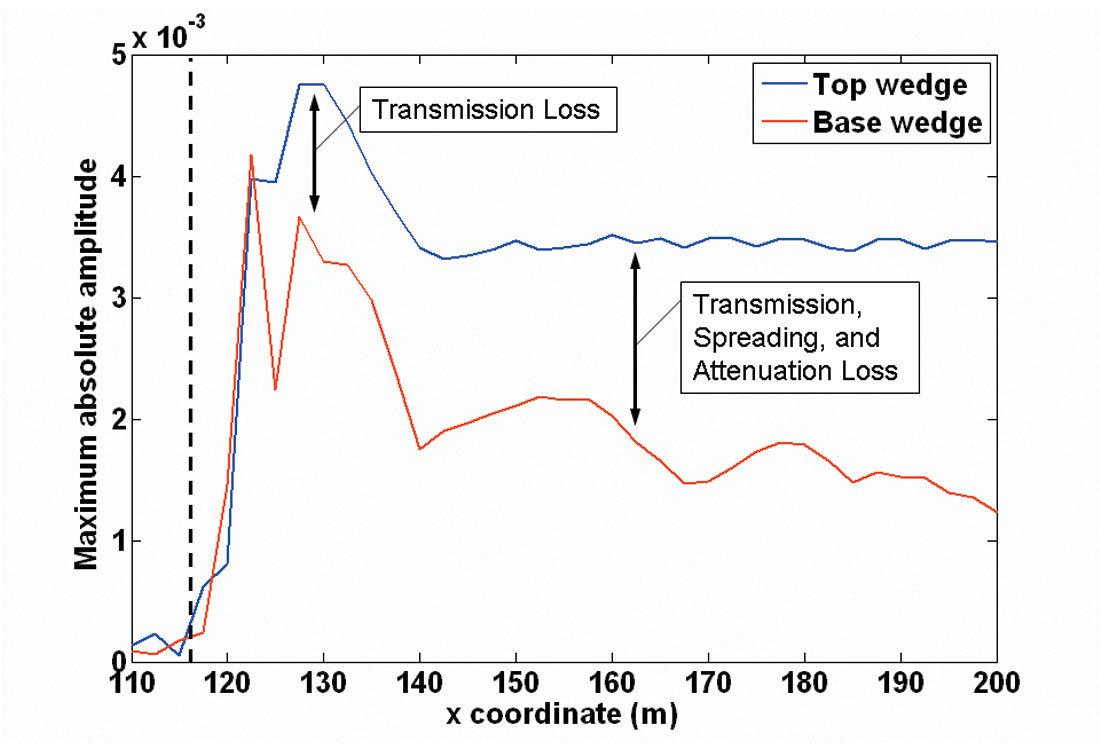
To review amplitude tuning effects, as described by Widess (1973, 1982), the maximum absolute amplitudes of the peak and trough corresponding to the top and base of the wedge were extracted from the physical model data. First, poststack Kirchhoff time migration was applied to the data in order to collapse the diffraction from the wedge tip, thus producing better definition of the thinnest part of the wedge and allowing for more accurate amplitude extraction. Deconvolution was also applied to the data before migration; the character of the reflection events in the deconvolved data closely matches a zero-phase 120 Hz Ricker wavelet. Figure 7 shows the tip of the 20 degree wedge after migration, as well as the amplitude picks for the topwedge and base-wedge reflections. The extracted amplitudes are plotted as a function of horizontal distance in Figure 8. The graph is similar to the expected amplitude variation (Figure 1b), but also includes differences from the classic model. Transmission loss through the interface at the top of the wedge makes the maximum amplitude of the trough from the base of the wedge less than that of the peak from the top of the wedge. Also, as the wedge thickens and the length of the path within the wedge increases, the amplitude of the reflection from the base of the wedge weakens due to attenuation and spherical spreading. Furthermore, some of the variations in the amplitude of the basewedge reflection are due to interference with multiples and mode-converted events.
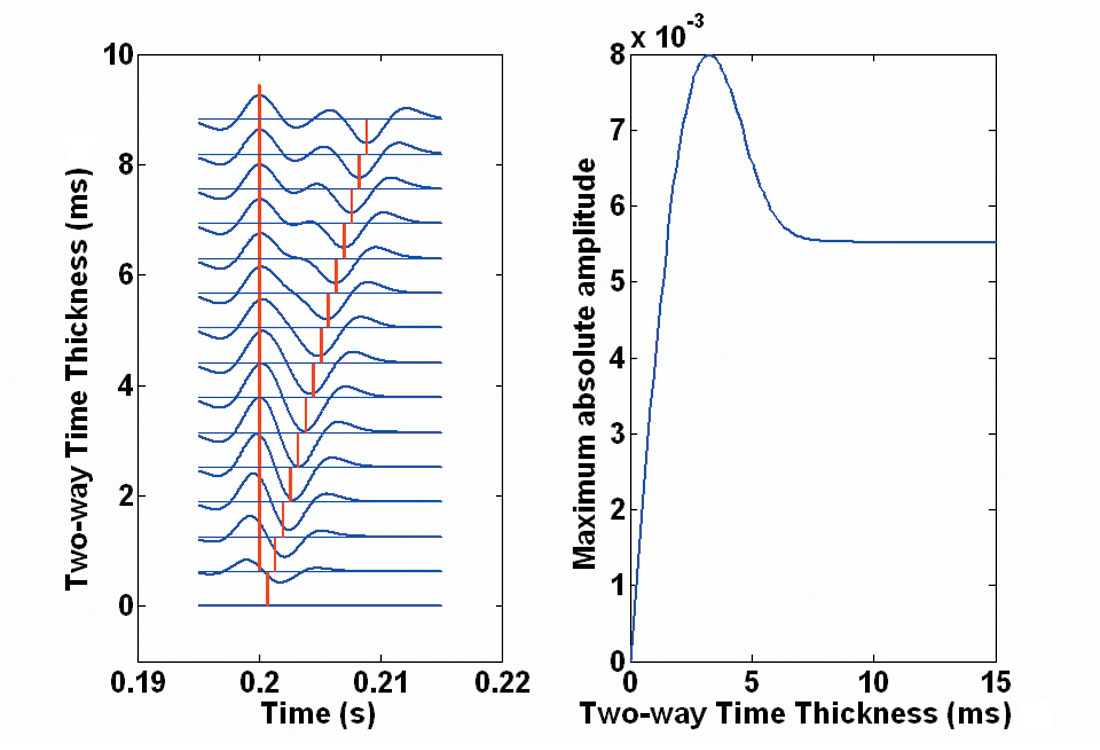
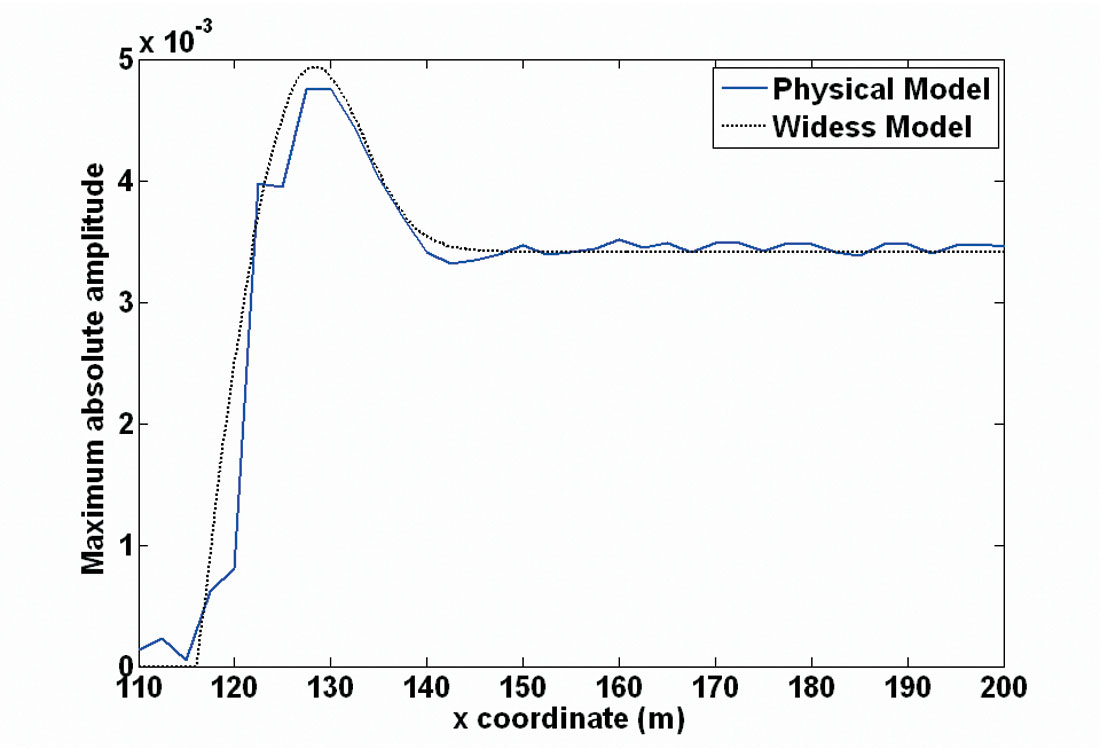
To more thoroughly compare the physical model amplitudes to the expected results, the model from Widess (1973) was recreated in MATLAB. Spikes corresponding to the reflection coefficients for the top and base of the wedge were positioned in time to form the 20 degree wedge geometry of the physical model; then a specified wavelet, in this case a 120 Hz Ricker wavelet, was convolved with the spikes to form the wedge model traces (Figure 9a). The maximum absolute amplitude of the resulting composite reflection event was extracted (Figure 9b). The less oscillatory amplitude curve for large thicknesses in Figure 9b) compared to Figure 1b) is due to a lesser amount of sidelobe energy in the Ricker wavelet compared to the box-spectrum wavelet used by Widess. Figure 10 shows the direct comparison between the physical model data and the Widess model simulation, normalised to a common value for the amplitude far from the wedge tip. The physical model data curve, containing the extracted top-wedge amplitudes, closely matches the shape of the Widess model curve; the physical model amplitudes deviate from the Widess model due to slight differences in the wavelet and interference with other multiples and mode-converted events, as mentioned previously.
Discussion
In this study two different modelling techniques, physical modelling and finite-difference exploding reflector modelling, were used to simulate a zero-offset seismic survey conducted over an identical set of wedge models. The importance of converted waves was initially underestimated and, accordingly, the physical model data showed unexpected events. The acoustic finite- difference numerical model dataset was computed to compare with the physical model data, enabling pure-mode events to be identified and separated from mode-converted and multi-mode events observed in the physical model data. Raytracing was vital for determining the exact raypaths for the different events, including several with non-normal incidence (i.e. non-reciprocal raypaths).
The significance of the many pure- and mixed-mode multiples observed in the physical model data is especially apparent from the complications they induce during migration. Figure 11 shows the results of poststack Kirchhoff depth migration of the data using P-wave velocities. While the migration was successful in correctly positioning the events corresponding to the top and base of the Plexiglas wedge and the PVC layer, as well as in collapsing the diffraction and removing the pull-up under the wedge, the many dipping multiples and multi-mode events remain after migration, contributing to the degradation of the image quality beneath the wedge tip. In an analogous field setting this could result in poor imaging of the flank of the high-velocity wedge and of the reflectors beneath or terminating against the wedge. The importance of the multiples and multimode events would be maximised when the impedance contrast between the wedge and surrounding rocks is high and when the P-S conversion is very efficient, although in a multi-offset field survey, multiples would likely be reduced through stacking.
Conclusion
Data from 2D zero-offset surveys over physical wedge models produced significant additional complexity compared to the classic Widess wedge. Thin bed amplitude tuning was observed in the physical model data, complicated slightly by transmission and attenuation losses. Unexpected high-amplitude events in the data were identified to be from multiple reflections within the wedge, including both pure- and mixed-mode events. These events were observed to present complications during migration. Similar effects may be responsible for imaging difficulties in field data involving high-velocity wedges, including features such as carbonate thrusts, permafrost, basalt, and salt.

Acknowledgements
The authors would like to thank the sponsors of CREWES, Malcolm Bertram from the Department of Geology and Geophysics at the University of Calgary, as well as CREWES staff members, including Dr. John Bancroft and Eric Gallant. In addition, the Natural Sciences and Engineering Research Council of Canada (NSERC) provided financial support for this project.


Join the Conversation
Interested in starting, or contributing to a conversation about an article or issue of the RECORDER? Join our CSEG LinkedIn Group.
Share This Article