Unless someone like you cares a whole awful lot, nothing is going to get better. It's not.
Dr. Seuss, “The Lorax”To waste, to destroy our natural resources, to skin and exhaust the land instead of using it so as to increase its usefulness, will result in undermining in the days of our children the very prosperity which we ought by right to hand down to them amplified and developed.
Theodore Roosevelt
Our world has changed, and with it, there will be changes on what we publish. There will be tough topics you may not agree with, but others may. There are certain things about climate change that are now becoming accepted scientific theories, as with evolution or plate tectonics in the past. We need to come to terms with the fact that most of our investors and oil and gas operators want to lower emissions.
In a recent study, climate change and ESG risks and opportunities played an increasingly key role in investment decisions and the evaluation of portfolio companies during the past 12 months. To attract investors, we should advertise what is being done in the energy industries to lower emissions, and part of this process involves recognizing climate change.
Geoscientists study the present to understand the past (uniformitarianism); it is what our science is built on. Discussion on climate change will be about what we are seeing now and correlating it to what we have seen in the geological past. Geoscientists study climate change in the geological record; for example, we regularly assess sea level rise (transgression) and fall (regression) in our work. We have hundreds of millions of years of climate to draw on, much longer than the 150 years most climate science is based upon.
To have a balanced perspective on climate change, we invite a series of articles that either support the theory of anthropogenic climate change or which do not support it, as we have done in the past regarding plate tectonics. Through conflicting perspectives, we learn. We saw this with plate tectonics.
Global warming and the scientific community
There is a strong consensus in the scientific community that global surface temperatures have increased in recent years, caused by massive and continuous emission of greenhouse gases induced by humans, which in turn has accelerated climate change.
If we look at it, most leading science organizations around the world have issued public statements supporting this view, including international and U.S. science academies, the United Nations Intergovernmental Panel on Climate Change, and a whole host of other reputable scientific bodies.
Scientific consensus about the environmental risks of global warming has been massively criticized by the scientists who oppose this consensus view, and there are still some people who do not think global warming is happening at all. Our purpose is not to change anyone’s point of view, but to offer a balanced perspective that supports the majority point of view on this subject.
Not everyone will be happy with this perspective, and we appreciate constructive feedback.
Arguments against climate change
The arguments against climate change are:
- Global warming is not actually happening.
- Global warming is happening, but human activity has little to do with it.
- Human activity contributes significantly to global warming, but we in the West shouldn’t have to pay, since other nations continue to emit.
- Global warming is beneficial to man.
- The science is poor, and we cannot prove a thing yet.
Some reading this will agree with some of these points, and that is why they don’t support climate change initiatives.
Outline
We will look at global warming from both a scientific perspective and from an oil and gas investor’s perspective.
Part 1
The first part of this paper will review what many are classifying as climate change events to understand what is really being affected by climate change. Some of what I found out surprised myself since there are elements of exaggeration, and we are also still learning how all this works.
We need to differentiate between global warming and climate change and then look at those events we read in the media that are being intensified by climate change. It seems like every weather event is claimed to be due to climate change these days.
Climate change is part of nature, it’s been happening throughout geological time, as we see with the regressions and transgressions we study, and because of it we have source rocks.
Part 2
The second part is about renewables (wind turbines and solar). It will look at price and EROI to compare sources of energy. It will look at OPEC and a lack of investment in oil, gas, and coal, which is causing the supply of energy to decrease. It will also look at what is happening in oil and gas, inflation and the possibility of a super cycle due to the lack of investment.
With renewables there is a need to develop long-term storage using innovative ideas to reduce the seasonal variability. Long-term storage also, like with natural gas, moderates the price swings in these commodities.
In this section, we will also show how underinvestment has affected oil and gas and a possible solution. The solution being recommended is moving towards a one-third mixture of renewables, fossil fuels and nuclear.
Part 3
The third part will look at Carbon Capture Utilization and Storage (CCUS), which needs to be part of this solution if we plan to continue to use fossil fuels for this transition, and it will look at using pipelines and designated hubs for the supercritical CO2, which reduce costs of CCUS through economy of scales. The captured CO2 can be used for EOR, or in products such as concrete or for geothermal.
Both geothermal and EOR require reservoir characterization, which can be used in geomodels, which are used to create a reservoir simulation to understand fluid flow in these reservoirs.
The third part will also include the conclusion for all three parts.
Moving away from the term global warming
Global warming is the long-term heating of Earth’s climate system due to GHG (greenhouse gas) emissions, which increase heat-trapping greenhouse gas levels in Earth’s atmosphere. It is about the average increase in Earth’s global surface temperature, and it is a factor in causing climate change.
Climate change refers to the broader range of changes that are happening to our planet. It is about how the different elements, such as oceanic oscillations (e.g., El Nino-La Nina Oscillations), interact with thermohaline currents as well as the polar jet stream. It helps to explain why we have cooler temperatures in one area and warmer ones in another.
The terms global warming and climate change seem to be interchangeable, with many emphasizing global warming and cherry-picking data, and others focusing on cooling spells and using them to argue that there is no global warming. Yet, these cooling spells can be attributed to natural climate variability.
Just as cooling spells do not disprove global warming, we cannot attribute sudden weather changes to climate change. There is a tendency in the media to blame every shift in weather on climate change, but we need to realize that climate happens over time, and its proof requires observation of atmospheric conditions over lengthy periods. Atmospheric variation over a brief period is weather, not climate.
As earth scientists, we need to study the natural processes of the earth to understand what is happening now; then we take that information to understand what has happened in the geological past. We can also take what has happened in the geological past to understand what is happening now or what may happen the future, which is why some are even looking at the Cretaceous to understand what will happen if the polar icecaps disappear.
Part of what we study needs to be climate change, and as with plate tectonics 50 years ago, there will be those who do not accept this theory. That is fine, but hopefully after reading this column, and by using your geoscience acumen, you will ask pertinent questions and a dialogue about these issues can happen.
Climate change
Climate change has been happening throughout geological time, and it also has been happening in recent time. Through the increase of GHG emissions, we have been accelerating this change, which has affected things like the jet stream, making it more turbulent creating an increase of “blocking” weather that causes heatwaves in the summer and an increase in number of polar vortex events during the winter creating extreme heat and cold.
By reducing emissions, we will slow this process down.
If for nothing else, we need to reduce emissions for our industries to have a license to operate and to attract investors.
As to what will happen after we lower the GHG emissions, no one is sure. Looking at the Cretaceous, which is the youngest prolonged greenhouse interval in Earth’s history, we can predict what will happen if we do not change; this is where geoscience and climate change intersect, especially in the modelling.
Geoscience must be a part of the study of climate change and also be part of the solution.
What we can do is reduce our impact. We can also build buildings with climate change in mind and look at how to mitigate the increasing intensity of storms through flood controls, higher sea walls, dams, dikes, and other measures. Geoscience will be a part of this process in suggesting some of these alterations. Just as we try to reduce our emissions, we need to alter how we live to adjust to climate change.
This perspective on climate change unfortunately will not satisfy either side; it will be unacceptable to those who passionately believe in it, and it will be “radical” for those who do not.
I do not claim to know all the answers; this is just a thumbnail sketch of the theories, and I have deliberately chosen a middle of the road perspective on this topic, trying to honour both sides of the argument to formulate an even perspective based on what we do know.
Are all flooding events caused by climate change?
Not all flooding events are caused by climate change, for instance the Abbotsford, BC flood, which many are saying was caused by global warning. The valley that Abbotsford sits in is the Fraser River Valley and the town sits on a flat area surrounded by steep mountain ranges.
There was a major flood in the Fraser Valley in 1894, which was historically the largest flood in the area, and which was caused by rapid snow melt raising river levels dramatically.
Where Abbotsford is today, there used to be a lake called Sumas Lake. It is a natural depression of about 80 sq. km. After the 1894 Fraser Valley flood, the lake was drained (Chan, 2021) to create more farmland, to avoid flooding, to prevent seasonal changes in lake size, and to reduce the mosquito population in summer.
The Chilliwack River was then diverted west into the newly formed Vedder Canal. The lake was then drained through the Sumas Drainage Canal into the Fraser River, creating the Sumas Prairie (Wikipedia, 2021a).
There is another issue: when the Nooksack river floods in Washington State, the waters head to where Sumas Lake was.
Therefore, the likely cause of the flooding in Abbotsford is due to where the town was placed, and not all flooding events in Abbotsford can be attributed solely to climate change.
Pineapple Express and Chinooks
Floods in B.C. are caused by an atmospheric river, which is a narrow, elongated flow of moist air in the lower atmosphere. It is sometimes referred to as a “Pineapple Express.” They form along the front edge of a slow-moving, low-pressure weather system related to the polar jet stream. The cyclonic nature of these weather systems in the northern hemisphere causes winds to flow from southwest to northeast, allowing warm moist air from the tropics to reach North America’s west coast (Wikipedia, 2021b; House, 2021).
The Pineapple Express is driven by a strong southern branch of the polar jet stream. In the winter, Pineapple Expresses create large snowfalls in the mountains and the interior plateau as the storm rises above the mountains and release its moisture. The tropical air masses, when they reach the inland prairies, no longer have any moisture and become Chinook winds (Wikipedia, 2021c).
Research indicates an increase in atmospheric river frequency, with more precipitation extremes across North America. Yet, there remains a lot to be understood about atmospheric river dynamics and how a warming planet will alter circulation changes and the precipitation efficiency of these rivers (Hamilton, 2021).
Since 1960, Alberta has seen a significant and steady increase in the number of Chinook days, rising from an average of 10 up to almost 15 days per year. This loosely corresponds to an increase in Pineapple Expresses (Chernos, 2015).
The increase in Chinooks cause premature melting of snow in the winter, which could lead to droughts later in the year. Chinooks and Pineapple Expresses occur generally during El Niño cycles.
Calgary flood
Many were saying the Calgary flood in 2013 was a harbinger of climate change. Calgary is a place where two rivers come together (Elbow and Bow). There have been several floods in Calgary over the years (in 1897, 1915, and 1929) before the 2013 flood. These floods occurred before there was anthropogenic climate change, and it is partially due to Calgary being where two rivers come together. There is a saying: “live on a flood plain, expect a flood.”
There are several elements that we need to look at when we consider hurricanes, typhoons, and floods before saying they are due to climate change. I have heard many say the number of hurricanes has increased, but there has not been a change in the frequency of hurricanes; there has been a change in the intensity. Having lived on the Gulf Coast, I got used to tropical storms and hurricanes. The one thing that amazed me about Hurricane Ike was the size of it.
Climate change and hurricanes
Many argue that climate change is causing the frequency of hurricanes to increase, but that is not true. We do know that there are factors influencing hurricane formation and strength that have nothing to do with climate change, such as El Niño and La Niña.
El Niño favors stronger hurricane activity in the central and eastern Pacific basins and suppresses it in the Atlantic basin, while La Niña suppresses hurricane activity in the central and eastern Pacific basins and enhances it in the Atlantic basin.
There are concerns that with climate change we will see El Niño and La Niña events intensifying and becoming super El Niño and super La Niña events, but climate change does not seem to favor El Niño over La Niña or vice versa (Pearce, 2016).
Wind shear
Another factor with hurricanes is wind shear. Wind shear is the change in direction and speed of winds throughout the various levels of the atmosphere. There are two types of wind shear: vertical and horizontal. Vertical wind shear is the change in winds at increasing heights in the atmosphere, and strong vertical wind shear tears tropical storms and hurricanes apart, preventing them from organizing into a storm core (Sosnowski, 2021).
The jet stream can extend over tropical waters and create a zone of rapidly increasing wind speed at progressively higher levels of the atmosphere, creating strong vertical wind shear. The jet stream is very influential in tropical storm development, or the lack thereof (Sosnowski, 2021).
Horizontal wind shear is like its vertical counterpart but oriented in the opposite way. It is the change in horizontal winds over the surface of the ocean. The horizontal wind shear can often bring powerful wind gusts to carry a tropical storm away from the direction in which it is headed or to disrupt the circular flow of the tropical system (Sosnowski, 2021).
There is research that suggests that Atlantic wind shear could be increasing, causing the number of tropical cyclones to stay the same or even decrease (Voiland, 2013).
This change in shear is causing the latitude where hurricanes, typhoons, and cyclones reach their maximum intensity to change, shifting it farther north of the equator in the Northern Hemisphere and farther south in the Southern Hemisphere (Lindsey, 2021).
Effect of hurricanes on water temperatures
The warmer ocean temperatures and higher sea levels are intensifying the hurricanes (Centre for Climate and Energy Solutions, 2021). These stronger hurricanes will be more costly in terms of damage and deaths. It is also believed these powerful hurricanes take a large amount of heat from the ocean, which will cool the ocean water. With cooler water, it takes more time for the water to heat up enough to fuel other hurricanes.
The hurricane season of 2005 was one of the most active hurricane seasons in history, with Katrina, Rita, and Wilma. The record was finally beaten in 2020. The hurricane season in 2006 was the least active since 1997, as well as the first season since 2001 in which no hurricanes made landfall in the United States (National Geographic Society, 2019).
The 2020 hurricane season had a total of 31 tropical storms, with all but one of them becoming a named storm. Of the 30 named storms, 14 developed into hurricanes, and a record-tying seven further intensified into major hurricanes (Iota, Eta, Zeta, Delta, Sally, Laura, and Isaias). The 2020 hurricane season was fuelled by a La Niña that developed in the summer months.
The 2021 hurricane season was the third-most active Atlantic hurricane season on record, producing 21 named storms, but like the 2020 season, it was fuelled by the formation of La Niña near the peak of the hurricane season in August. It is not uncommon for La Niñas to come in pairs. This reflects how other factors can affect the hurricane season (Chinchar, 2021).
With climate change seeing a change of hurricane patterns, hurricanes are shifting northward in the Atlantic. Hurricane Sandy made landfall in Atlantic City, N.J. and Hurricane Larry struck Newfoundland and Labrador (Centre for Climate and Energy Solutions, 2021; Phiddian, 2021).
Climate change and tornadoes
Tornadoes form when dry, cold air moving south from Canada meets warm, moist air traveling north from the Gulf of Mexico. It usually happens in an area that has been designated as Tornado Alley. When this happens, denser, cold air pushes under the warm air, usually producing thunderstorms. The warm air rises over the colder air, causing an updraft, and the updraft will begin to rotate if there is strong vertical wind shear. It is important to note that it is the abundance of wind shear that cause tornadic storms (Hass and Ellis, 2021; LeBlanc, 2021).
We do know that La Niña seasons tend to have increased tornado activity in the US. Currently we are experiencing La Niña, and it is expected to last into spring of 2022. We don’t see tornadoes in the winter because in the winter we tend to not have the instability: the air isn’t as warm and humid. This (2021-2022) winter, the temperatures have been milder across the US, causing the price of natural gas to fall. In the Southeast US, the temperatures have been higher than normal, which could be a contributing factor (Naishadham and Borenstein 2021).
There are no direct links between climate change and tornadoes because they are hard to model, since they occur in geographically small areas and are hard to simulate. The other issue scientists have with tornadoes is that wind shear is very important, but wind shear is decreasing as the jet stream decreases with climate change (National Geographic Society, 2020).
The link between a warming world and tornadoes is complicated and inconclusive, but we are seeing an eastward shift of where the tornadoes occur (Gibbens, 2021).
Jet stream and tornadoes
Jet stream is another factor in the development of tornadoes. The jet stream speeds the updraft rates significantly, creating “divergent flow aloft,” which is a main contributor to violent storms. Through studies, we have seen jet stream meandering over tornado alley in high and relatively high frequency tornado months. To find a tornado, look for where there is warm air being pulled into a low-pressure area by the jet stream, which produces tornadoes (Zurbenko and Sun, 2016; Baker, 2018).
Movement of the jet stream north due to climate change could possibly cause more tornadoes in Canada.
Climate change and polar vortexes
The polar vortex is a large, upper-atmospheric, cyclonic circulation that forms and exists over the winter pole. Its behavior has become more extreme as a result of climate change due to the Arctic region warming disproportionately compared to the tropics. This weakens the jet stream, causing it to become kinked and wavier. These waves then lead to changes in weather depending on where you are in relation to the jet stream's position. If it is to your north, the weather will be warmer, and if it's to the south, the weather will be much colder (Climenhaga, 2022).
These events are happening more frequently, and those who are anti-climate change will argue that this is evidence that the Earth is not warming up but cooling off (Shepherd, 2021).
Climate change continuous through history
There is evidence that climate change has been continuously happening in recent history (Schulte and Lyatsky, 2019):
- The Roman Warm Period (250 BC-400 AD) is thought to have been caused by intense solar activity. It is thought that there is a link between climate and Roman expansion during this period, and later, Roman decline during the dark ages.
- The Dark Ages Cool Period (400-900 AD) is believed to have been caused by a comet hitting the earth and exploding in the upper atmosphere. The debris from this giant explosion was such that it enveloped the earth in soot and ash, blocking out the sunlight and causing the very freezing weather.
- The Medieval Warm Period (900-1300 AD) was caused by an increase in solar radiation and a decrease in volcanic eruptions, creating a La Niña-like event that changed the usual patterns. During this time, which is referred to as the High Middle Ages, there was a period of stability, peace, and prosperity.
- The Little Ice Age (1300-1860 AD) was caused by three volcanic eruptions:
- Mount Samalas on Lombok Island, Indonesia, in 1257, which formed a crater lake (Segara Anak).
- An eruption around 1465, location uncertain. On October 10, 1465, in Naples, Italy the sun turned blue at noon (this is surprising: particulates in the atmosphere usually turn the sun red (Gorvett, 2017; Krazytrs, 2017). Evidence of this extremely massive eruption can be seen in ice cores from both poles. It might have occurred somewhere in the tropics, as suggested by the distribution of the ash.
- The Mount Tambora (1815) eruption, which was the most devastating in recorded history.
The Little Ice Age also saw four episodes when sunspots became exceedingly rare and the solar output correspondingly decreased, which contributed to cooling the climate (Schulte and Lyatsky, 2019):
- Wolf Minimum (1280-1350)
- Spörer Minimum (1450-1540)
- Maunder Minimum (1645-1715)
- Dalton Minimum (1790-1820)
These minimums might have changed the Arctic Oscillation/North Atlantic Oscillation (Shindell et al., 2001).
During this time, there were rampant plagues and high infant mortality rates as well as famines and wars over agriculture. This period also saw colonialism and expansionism, where European countries explored the world and claimed foreign lands for their natural resources.
Geological past – source rocks and greenhouse environment
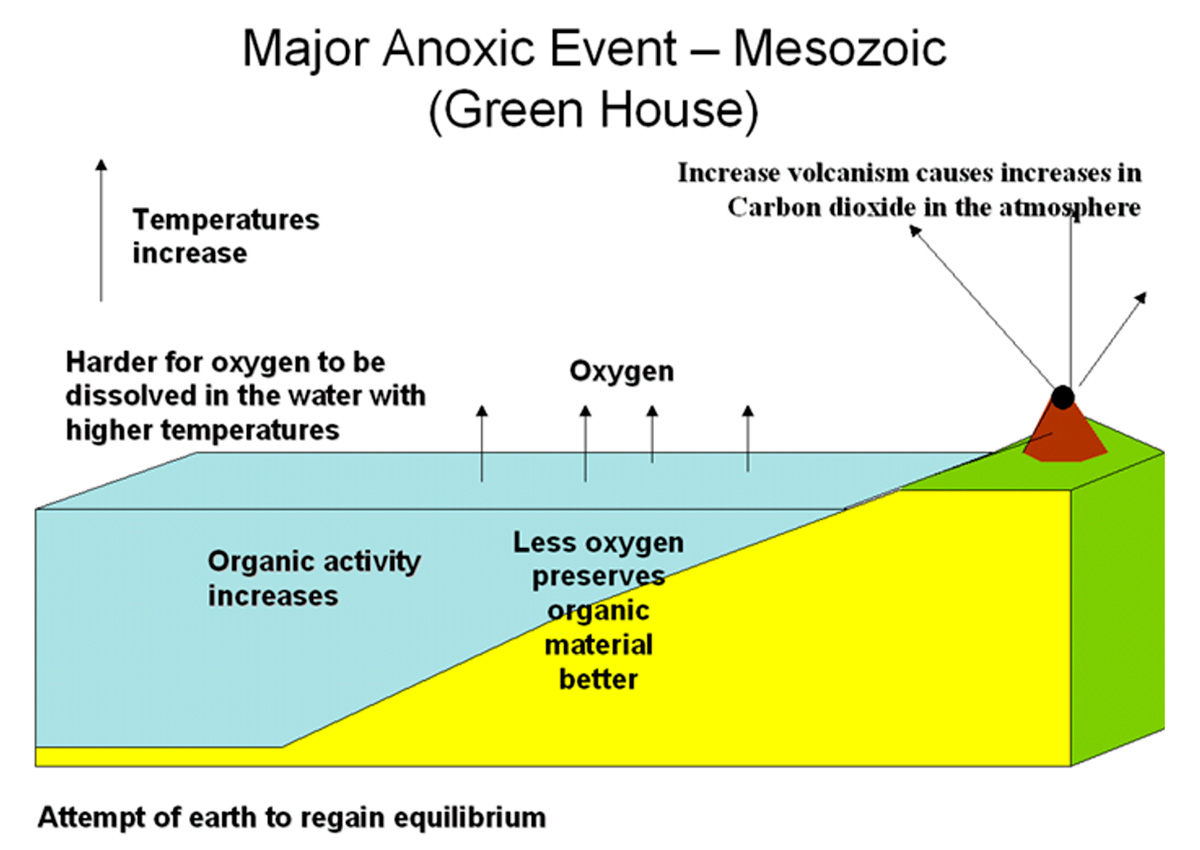
In the geological record, there is also evidence of global warming through the preservation of source rocks.
Source rocks are limited and are the controlling factor in whether there are hydrocarbons in a basin. Most source rocks were deposited during major anoxic events in the Earth’s history, which preserved the organic material (Figure 1).
What causes the anoxic events is not understood. Some of the causes suggested are:
- Global cooling, oceanic volcanism, or possibly the impact of a comet (Devonian);
- Intense mid-ocean ridge hydrothermal and volcanic activity producing large emissions of CO2 gas, leading to global warming and a stratified ocean with anoxic deep seas (Jurassic);
- A super plume, which is a mantle plume large enough that the plume head spreads across the lithosphere, which causes an increased production of oceanic crust, increased seafloor spreading, increased global temperatures, and increased deposition of black organic shales that can become source rocks (Cretaceous).
The causes of anoxic conditions in the geological record are not fully understood. The following is a list of the age of the major source rocks in order of percentage petroleum produced from source rocks:
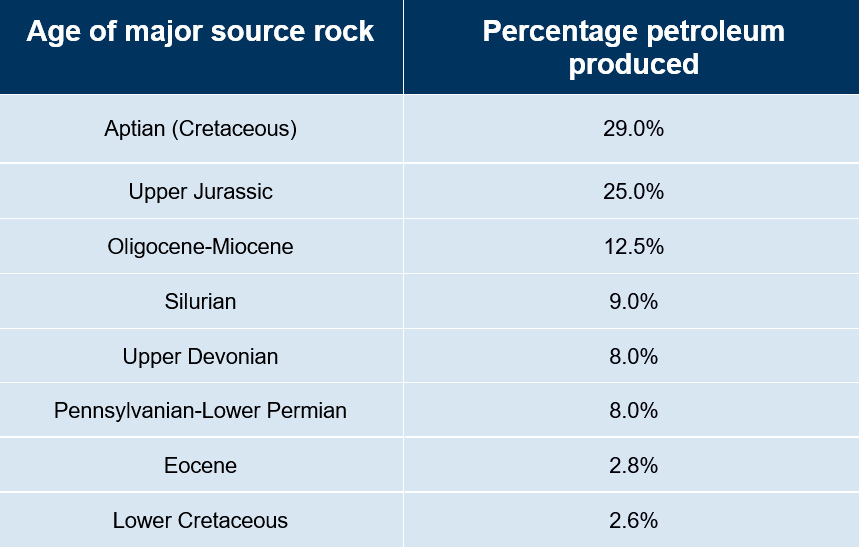
Source rocks from 6 periods of geologic time produced 91.5% of the hydrocarbons on Earth. So, greenhouse conditions existed in the geological past.
Jurassic to Cretaceous source rocks
During the Jurassic to the Cretaceous, there were warm climates and high sea levels. There was a proliferation of calcium carbonate-secreting plankton in the Jurassic, which stabilised the chemical composition of the ocean, providing the conditions for the most prolific diversification of marine life. Marine transgressions increased the world’s sediment budget, and anoxic events and upwelling currents enriched the organic content of marine sediments. All these events were responsible for the rich Upper Jurassic to Middle Cretaceous source rocks.
The type of organic material that composes the source rock affects the quality of the hydrocarbon.
There are three distinct types of source rock (kerogen):
- Type 1 source rocks are formed from algae under anoxic conditions in lakes or restricted circulation marine environments: they produce mainly oil.
- Type 2 source rocks are formed from algal and zooplankton and phytoplankton: they produce both oil and gas.
- Type 3 source rocks are formed from terrestrial plant material that has been decomposed by bacteria: they tend to generate gas.
Cretaceous model for the future Earth without ice caps at the poles
The Cretaceous was a period with a relatively warm climate, resulting in high eustatic sea levels because there were no ice caps at the poles, which created numerous shallow inland seas. The one that affected Western Canada the most was the Western Interior Seaway, which stretched from the Gulf of Mexico to the Arctic Ocean in the north.
The Western Interior Seaway went through multiple periods of anoxia when the bottom water was devoid of oxygen and the water column was stratified (Lowery et al., 2018). This anoxia resulted in black shales being deposited that had an increased amount of organic preservation (source rocks). The Western Interior Seaway had an abundance of calcified plankton. Therefore, we have stacked pay in the Cretaceous in Western Canada, particularly in the Deep Basin (Pika, 2018).
There was a reduction of the temperature gradient between the equator and the poles, which disrupted the mid- and high-latitude wind systems affecting the global temperature distribution and the wind-driven ocean circulation (Pika, 2018).
There is another factor of our weather system that can be affected if the ice caps on the poles disappear, and that is the thermohaline currents which help distribute heat. Warm shallow water flows northward by way of the Gulf Stream, and when it reaches the arctic, the water gets so cold it forms ice. When this happens, the remaining water gets saltier and sinks due to density. Surface water is pulled in to replace the sinking water and it too freezes, making saltier water, which also sinks, creating a conveyor belt. This dense polar water travels deep under the ocean southward through the Atlantic and is referred to as the North Atlantic Deep-Water current.
The thermohaline current has stopped in the past when the glaciers melted and freshwater inundated the oceans; with it there was significant cooling in Greenland (Kloeppel, 2004).
There is much debate around the cause of the extinction at the end of the Cretaceous with majority seeing climate change brought upon by an asteroid striking the Earth in the Gulf of Mexico as the main cause and volcanic eruptions, climate and sea level change at the time being contributory factors (Wikipedia, 2021g).
Climate change is usually not as drastic as this event, but there will be consequences which will affect how CO2 is handled, the distribution of heat, the anoxic conditions existing within our oceans, the reduction of the jet stream and wind, and more. We need to ask ourselves: do we want to leave this to future generations to solve, or can we begin to reduce our GHG emissions and reduce the chance of these things happening?
Just like using the present to predict what happened in the past, we can utilize what has happened in the past to predict what will happen in the future, especially if we continue to increase the amount of GHG emission we produce.

Related Reading


Join the Conversation
Interested in starting, or contributing to a conversation about an article or issue of the RECORDER? Join our CSEG LinkedIn Group.
Share This Article