Abstract
Jaws dropped around the planet in April 2020 when the price of oil went below 0 into negative prices. In effect, producers of the fuel that drives the global economy had to pay others to take oil from producers’ stores. It reflected market forces that had never been seen before.
This unprecedented collapse was caused by a drop-in demand due to global COVID-19 lockdowns destroying demand combined with the Saudi Arabia – Russia price war (March 8 – April 9, 2020) and the lack of storage due to too much oil production.
The Saudi Arabia – Russia price war was brought on by Russia refusing to cut its production believing OPEC+ group had lost its significance in balancing the global oil market. In the past, countries including the United States, Brazil, Norway, and Mexico raised their production as OPEC+ dropped their production (Schulte, 2020).
The day after Russia said no to cutting its production, the Saudis announced it would ramp up production by about 20 percent, causing the biggest one-day fall in oil prices in nearly three decades (Prince, 2020) and creating the price war which ended April 8, 2020 with OPEC+ agreeing to a cut of 9.7 MMBOPD and expecting non-OPEC countries to cut their production by 5 MMBOPD (Schulte, 2020).
The U.S. companies in turn dropped their oil production from 13.1 MMBOPD to 10.5 MMBOPD over 3 months (EIA, 2020a) with 62% (1.6 MMBOPD) of the cuts in U.S. oil production coming from seven key unconventional basins. The reason unconventionals accounted for 62% of the quick cuts is because they are easy to shut-in compared to wells offshore in the Gulf of Mexico.
Canada also dropped their production by 1 MMBOPD (Alberta Government, 2020; Saskatchewan Government, 2020) by shutting in non-oil sands wells that do not have direct access to refineries because the SAGD thermal wells offer a challenge to shut-in due to turning off the steam may cause the reservoir to lock up, impairing how much oil can be recovered (Wethe, 2020).
This joint global drop in oil production led to an increase in the price of oil with WTI eventually being above $35 / bbl.
Natural gas has not been spared, with prices for gas dropping along with an increase in the amount of natural gas being stored. Reporting of U.S. natural gas production lags that for oil, but 6.3 Bcf/day of natural gas has been shut-in over these seven key unconventional basins, with most of it being associated gas from oil fields that have been shut-in (EIA, 2020b).
Unconventional wells targeted for shut-in tend to be less profitable wells such as stripper wells and those wells with the best chance of restarting regardless of what they are producing (Jacobs, 2020). More specifically, these are high-pressure or low water production wells which tend to be those most recently brought online.
The effect of the steep price drop has caused constraints on the availability of capital, forcing producers to rely more heavily on the capital coming from the cash flow from their operations. As for operations in the field, the price collapse has led to a decrease in the number of wells drilled. On July 10, there were 263 rigs operating in the U.S., down 73% from last year. Canada had 18 rigs operating, down 85% (Baker Hughes, 2020). If we look at the number of wells drilled in Canada from January 1 2020 to July 17 2020 compared to the same period 1 year ago we see that we are down 47% with the top three plays still being the: Viking (oil), Montney (oil & gas), Duvernay (oil & gas) (BOE Report, 2020).
The drop in prices for hydrocarbon resources is not the only reason for the drop in drilling. It’s also due to increased productivity from new wells, stemming, in part, from drilling longer laterals across contiguous lease blocks along with the increased experience and continual improvement in the drilling and producing of wells in unconventional plays (Rachal, 2019). The outlook for 2020-2021 is for unconventional players to have flat production or even slight declines by minimizing drilling, turning on shut-in wells or bringing on drilled but uncompleted (DUC) wells. Some think less drilling will drive a natural decline in the unconventional plays production of 30%/year with a production decline to 8 MMBOPD in the US by the end of 2020. Without major demand disruptions, oil could be bullish in 2021 (Cunningham, 2020a).
We are also seeing natural gas below $2.50 MMBTU, a figure generally cited by operators as break-even. As with oil, it is simply too much supply, poor demand, and closed markets (some countries have cancelled LNG shipments due to the COVID-19 lockdowns). Without LNG taking excess domestic production, natural gas prices on the Henry Hub have fallen.
Companies are reducing the value of gas properties and are writing down their assets in reporting their financials (Kumar and DiSavino, 2020). In addition to low Henry Hub prices, there are concerns about the price of natural gas going negative because we are seeing gas storage being 739 Bcf higher than the same time last year. Exacerbating the factors described above was a warm winter in 2019-2020.
Investors and analysts are saying we need another 2 Bcf/day of shut-in gas supply for about two months to head off a full storage scenario that could push prices below zero. Many are forecasting $1.40/MMBtu gas for October (Cunningham, 2020b). Some forecasts factoring in decreased gas production by the end of 2020 project a natural gas price of $3.25/MMBtu in 2021 (Cunningham, 2020b).
Natural gas liquids (NGLs) are, predictably, facing a similar fate. Demand for pentanes+ in Alberta, for instance, is expected to decrease by 4.8% attended by concerns that condensate storage may be required (Daily Oil Bulletin, 2020). Companies in Western Canada are already shutting in their liquid-rich plays (condensate and light oil) to focus more on dry gas. Scaled back drilling by Canadian gas producers starting in 2019 and a change in tariffs allowing natural gas producers increased access to storage during periods of maintenance have both helped the AECO price increase to the same level as the Henry Hub; Alberta natural gas has heretofore been discounted to Henry Hub (Bloomberg, 2020).
This increase in the AECO has led to a fall in Western Canadian natural gas exports, and that’s expected to continue- exports to the U.S. are expected to fall from 7.4 Bcf/day in 2019 to 7 Bcf/day in 2020 (EIA, 2020j). Despite all the discussion about demand, it is expected that demand for oil and gas will slowly return, with some predicting an over-correction that could mean under supply and a resulting price spike.
Some scenarios outlining a “return to normal,” (say, in the case of a COVID-19 vaccine), predict a decrease in staffing as companies focus on efficiencies that lead to higher margins to support debt service and stronger balance sheets. Some tactics include higher revenue per employee ratio through increased productivity from new wells because of the longer laterals combined with the increased experience and continual improvement in the drilling and producing of wells in unconventional plays (Rachal, 2019). Another tactic is the utilization of science and fairway mapping to acquire top tier acreage and to determine sweet spots in the unconventional plays. This latest crash befalling industry will likely see more financially healthy companies on the lookout for takeover targets with high quality acreage.
Introduction
Oil and gas in North America integrate geoscience, drilling and reservoir engineering, land, legal, regulatory and finance (e.g. capital expenditure, hedging strategies) to drive our companies’ success.
While it is “all about the rock” for most geoscientists, it goes far beyond that, especially in today’s low-price environment. Prudent management of your company’s assets is more important than ever. Today’s integrated teams require an understanding of the interplay and constraints of geoscience, reservoir engineering, environmental compliance, finance, and investment strategies. For example, given how capital intensive our industry is, our analysis shows increasing incorporation of terms such as net present value basis (NPV) and internal rate of return (IRR).
Decisions on drilling depend upon on many factors:
- Contractual or lease-related obligations
- Mid-stream infrastructure
- Access to oil refineries or gas-processing based upon the nature of the hydrocarbons (gas versus oil, liquids content, sweet versus sour)
- Ranking of the well from geological or geophysical criteria using the fairway concept
The strength of unconventional plays lies in operators’ ability to quickly ramp-up (or down) to respond to short-term movements in oil and gas pricing. The suddenness and severity of the COVID-19 lockdowns are a prime example- within days there were thousands of passenger jets grounded, entire cities shut down, borders and businesses closed, supply chains broken, etc., all contributing to 30% demand drop for hydrocarbon products globally. Operators shut in production literally overnight, knowing they can re-start production within a week as demand requires.
This agility makes it difficult for any country, including Saudi Arabia, to try to win on oil price because they cannot wait out the U.S. shale sector (Watkins, 2020a). One wonders why they did not learn this when trying a similar tack in 2014.
Summary of Events
In March 2020, the demand for oil fell by 30% because of COVID-19-caused closures. In response, Saudi Arabia wanted OPEC+ to cut production. Russia initially declines, citing its belief that OPEC+ production cuts of the past simply allowed the U.S. to grab more market share. Saudi Arabia retaliated to Russia’s refusal to reduce production by starting a price war.
On April 12, 2020, the price war ended with OPEC+ agreeing to cut 9.7 million barrels a day; they expected another 5 MMBOPD from the G20 countries (Smith et al., 2020). While not formally agreed to, it was expected Canada would cut its production as well. Though prices fell, the market was slow in responding to the lower demand by shutting-in production.
Storage was at a premium. The unthinkable followed. With no demand for oil nor storage space for it, traders with expiring May futures were scouring the world to offload those holdings to avoid having to take delivery of the oil and incur storage costs. This unprecedented confluence of events saw the price of oil to plummet to minus $37.00 (BBC, 2020). As prices plunged, oil production was quickly curtailed by producers across the spectrum from the super majors to the smallest players because the price of oil fell below production costs, even for existing wells, let alone for new-drills (Table 1).
| Basin | New Wells Break Even Prices | Producing Wells Break Even Prices | Price of Oil | Profit – new wells | Profit – old wells |
|---|---|---|---|---|---|
| Table 1. Break-even price based upon data collected March 11–19 from 157 oil and gas firms (Federal Reserve Bank of Dallas, 2020). | |||||
| Eagle Ford | $46.00 | $23.00 | $31.93 | -$14.07 | $8.93 |
| Permian (Delaware) | $52.00 | $26.00 | -$20.07 | $5.93 | |
| Permian (Midland) | $46.00 | $26.00 | -$14.07 | $5.93 | |
| Bakken | $51.00 | $28.00 | -$19.07 | $3.93 | |
| Other U.S. shale | $51.00 | $30.00 | -$19.07 | $1.93 | |
| Permian (other) | $50.00 | $32.00 | -$18.07 | -$0.07 | |
| Non-Shale U.S. plays | $50.00 | $36.00 | -$18.07 | -$4.07 | |
The break-even price in Table 1 represents the average break-even price from several companies; in reality, there is a range of break-even prices for each basin and each company.
The break-even price is dependent upon many costs: lease operating expenses (LOE), production tax, return on capital expenditures (CapEx), servicing bank debt, making payroll, accommodating associated administration/overhead costs, and other contractual obligations (Melton, 2020). One can often hear these factors discussed on public companies’ quarterly earnings calls.
Lowering Overhead
Producers address lower break-even costs by cutting costs and pursuing process improvements for greater efficiency. In Canada, we have seen smaller and leaner companies that maintain a high revenue per employee ratio drilling more wells than the larger Canadian companies and multi-nationals. Each company has its criteria on the size of fields they are producing depending upon the staff they are carrying, overhead expenses such as software licenses, licensing of data, etc.
In deciding which fields or assets a company will operate, they look at:
- Costs to drill, complete and to put in infrastructure to bring the hydrocarbons to market (F&D, or Finding and Developing)
- Proved reserves (3P in financial vernacular) which is (Melton, 2020):
- Proved Developed Producing (PDP), which is the current oil and gas production and reservoir analysis of ultimate recovery (type curves) from existing wells
- Proved Developed Non-Producing (PDNP), which is the oil and gas that has been verified in existing wells but is not yet producing
- Proved Undeveloped (PUD) - oil and gas that may be recovered from new development wells on undrilled acreage which are completed in the same geological formation as the existing direct offset wells yet requiring substantial Capital Expenditures to drill these new wells This information comes from the geomodel and reservoir simulation.
- Access to market(s)
Liabilities from Aging Fields
As assets age (i.e. sustained decline curves), their liabilities increase because they are approaching abandonment. With abandonment the well is permanently decommissioned, spurring reclamation obligations (i.e. costs). In some places like the North Sea companies must carry insurance or a reclamation bond to pay for these abandonment costs.
Wells in older fields eventually produce more water than oil (i.e. high water cuts), which translates to higher costs from extracting and separating the water out, from water treatment to remove metals and radioactive substances, and even more costs from disposing the water through re-injection into SWDs (salt water disposal wells). Against lowering production, wells in older fields with water issues can quickly turn sub-economic, forcing the well to be abandoned. Eventually the well’s production falls to where it is only producing 10-15 barrels of oil per day or 60-90 McF of natural gas over 12 months, a state in the life cycle of a well relegating it to “stripper well” status. Nonetheless, stripper wells account for 10 to 20% of all oil production (Lavis, 2018).
While production is low, costs to operate strippers can be very low, but when the price of oil falls below a certain point, these low producing stripper wells become the least profitable producers and are the first wells to be shut-in or even abandoned (Lavis, 2018; Jacobs, 2020).
Effects of Low Oil Prices on the Industry
According to a questionnaire by Haynes and Boone, LLP (2020), many producers were well hedged to preserve their cashflow from their operations and are now looking at this cashflow as the main source of capital during this downturn.
In the past, a prolonged stretch of low costs of capital had many companies looking at debt from banks as source for capital. Those days are gone, at least for now. Banks are cutting their lending to cash-starved energy companies by 10% to 20% because of the volatility in the oil markets where low oil prices have accelerated defaults in the energy industry (Paraskova, 2020); more than one-third of high-yield energy debt is at distressed levels (McNeely and Wethe, 2020).
Finally, stockholders have seen oil stocks pale in comparison to other asset classes since 2010. According to the Fitch Wire (2020), there is $33 billion for bonds and $10 billion for loans exposed to potential default. The risk is real - Diamond Offshore Drilling, Whiting Petroleum and Chesapeake Energy as well as 17 other companies have already filed for bankruptcy (Wethe, 2020).
In Canada, several oil and gas companies are working with creditors and making moves to avoid bankruptcy. Some companies have filed for protection under the Companies' Creditors Arrangement Act (CCAA) to produce a restructuring plan with creditors to try to avoid receivership or bankruptcy (which generally consists of converting debt to equity deeply discounted to pre-bankruptcy values). These companies are choosing CCAA because they believe the current market forces, such as the drop in fuel demand during the pandemic, are only temporary and that oil prices will eventually improve (Bakx, 2020).
It seems having good-sized positions in unconventional basins play an important role for large companies who say their internal rate of return (IRR) in such situations can be 3X over ten years. Contrast that with deep-water plays where Net Present Values (NPV) are competitive compared to shale plays, but in 10 years you may not have even recouped your costs (Ramsay, 2019).
Also, as noted earlier, another important difference between the economics affecting unconventional plays and deep-water is that shale players can ramp up production quickly to take advantage of better oil prices and nearly as quickly curtail production amid low prices (Watkins, 2020b).
Shut-In Wells
If we look at U.S. oil production values from the from the EIA (2020a) over the period January 2019 to May 2020 (Fig. 1), we see this year’s U.S. oil production has already fallen 2.6 MMBOPD in only 3 months.
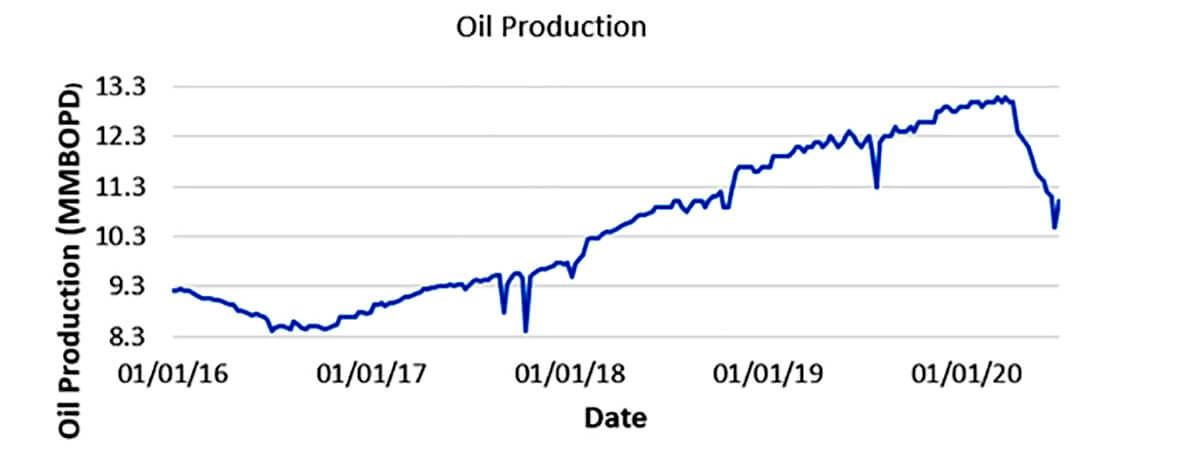
Figure 1. Production data from the EIA from January 2019 to June 2020. Production dropped from 13.1 MMBOPD (March 2020) to 11.5 MMBOPD (May 2020), a decrease of 2.6 MMBOPD. Data from EIA (2020a) and notice in the last part of June we have a slight increase as companies brought some shut-in production back online.
Alberta & Saskatchewan have also cut back their production from 4.5 MMBOPD to 3.5 MMBOPD (Alberta Government, 2020; Saskatchewan Government, 2020), a drop of 1 MMBOPD.
The joint production cuts from Alberta & Saskatchewan and the U.S. to date is 3.6 MMBOPD.
Shut-ins in 7 Key Unconventional Basins
If we look at the EIA (2020b) drilling reports from January to June 2020, the amount the oil that will has been shut-in in 7 key unconventional basins is 1.6 MMBOPD (accounting for 62% of the total oil shut-in in the U.S.). The amount of natural gas shut-in is 6.3 Bcf/day.
| OIL | ||||
|---|---|---|---|---|
| Region | Min oil (MMBOPD) | Max oil (MMBOPD) | Difference (MMBOPD) | Percentage |
| Anadarko | 0.416 | 0.551 | 0.135 | 8.36% |
| Appalachia | 0.133 | 0.166 | 0.033 | 2.04% |
| Bakken | 0.998 | 1.521 | 0.523 | 32.38% |
| Eagle Ford | 1.173 | 1.376 | 0.203 | 12.57% |
| Haynesville | 0.036 | 0.040 | 0.004 | 0.25% |
| Niobrara | 0.613 | 0.777 | 0.164 | 10.15% |
| Permian | 4.263 | 4.816 | 0.553 | 34.24% |
| Total | 7.632 | 9.247 | 1.615 | |
| GAS | ||||
|---|---|---|---|---|
| Region | Min gas (Bcf/day) | Max gas (Bcf/day) | Difference (Bcf/day) | Percentage |
| Table 2. Drop in production from the EIA drilling reports from January to June 2020 (EIA, 2020b). This shows a drop in oil production of 1.6 MMBOPD and 6.3 Bcf/day of gas in the 7 unconventional basins. | ||||
| Anadarko | 6.395 | 7.643 | 1.248 | 19.95% |
| Appalachia | 32.215 | 33.402 | 1.187 | 18.97% |
| Bakken | 2.261 | 3.174 | 0.913 | 14.59% |
| Eagle Ford | 6.333 | 6.954 | 0.621 | 9.92% |
| Haynesville | 11.761 | 12.586 | 0.825 | 13.19% |
| Niobrara | 5.314 | 5.725 | 0.411 | 6.57% |
| Permian | 16.029 | 17.081 | 1.052 | 16.81% |
| Total | 80.308 | 86.565 | 6.257 | |
The basin that shut-in the most oil production was the Permian followed by the Bakken and the Eagle Ford. The basin that shut-in the most natural gas was Anadarko, followed by Appalachia and Permian. The natural gas from the Anadarko, Bakken, Eagle Ford and Permian tend to be associated gas and accounts for 61% of the natural gas shut-in.
Downturn in Drilling
Lower prices have driven down rigs counts significantly, just as it did during the Saudi Arabia price war of 2014 (what some have termed the Thanksgiving Massacre). After the Saudi’s 2014 move, the number of rigs operating in Canada never did return to pre-2014 levels. In fact, the rig count has been decreasing each year (Fig. 2).
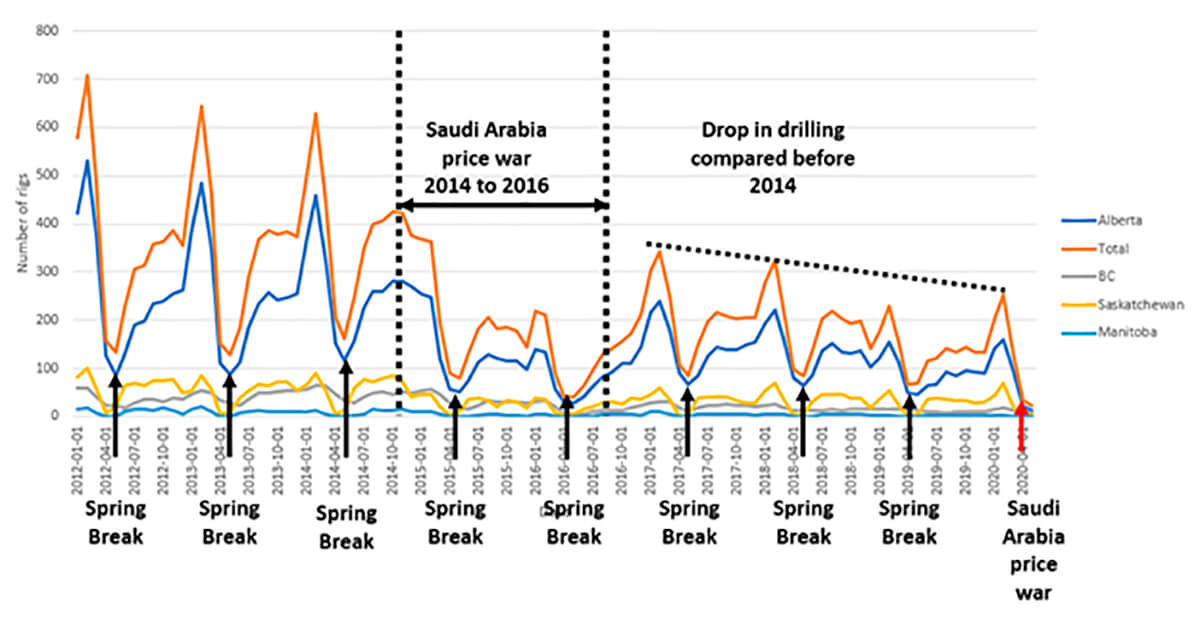
Figure 2. Rig counts for Canada (notice the wells are drilled in BC, Alberta, Saskatchewan, and Manitoba-data is from the BOE Report (2020)). It shows the number of rigs operating have been decreasing each year after the Saudi price war of 2014. This could be because of technological changes developed after 2014 to bring down the break-even price.
There has also been lower investment into the Western Canadian oil and gas industry due to various reasons:
- Increase in rig productivity due to changes in drilling and completions (D&C)
- In Canada, a decrease in investing creating less capital spending
- Investors wanting unconventional operators to balance their CapEx with operational cashflow
- Consolidation of acreage
The Saudis spurred development of technologies that lowered the break-even price. D&C innovations include:
- Development of “Ball Drop” completions versus “Plug and Perf”
- Longer horizontals
- Shorter distance between frac stages
- Re-design of drilling bit
- Change in frac fluid to slick water
Lower Investment in Canada Drives Lower CapEx
Comparing the number of rigs operating in the U.S. and Canada (Fig. 3) reveals a big discrepancy.
This is because capital spending decreased in Canada due to lack of foreign investment while capital spending in the U.S. increased by about 38% to $120 billion driven by the increase in the price of WTI (Green, 2019).
Decreased investment in Canada is due to:
- Lack of pipeline access to other markets
- In-fighting between provinces and getting consensus with indigenous groups on pipelines
- Lengthy reviews of major projects
- Large institutional investors want to invest in companies that have environmental-social- governance (ESG) metrics (Tertzakian, 2019)
- Concern that peak supply of oil has been reached due to new advancements like electric cars creating less demand for refined products (Tertzakian, 2019)
- Many American investors invested into American companies and projects (Tertzakian, 2019)
- Investors have shifted their expectations from growth in price and production volumes to growth in profitability and dividends (Tertzakian, 2019)

U.S. Capital Expenditures Increase
Higher investment in U.S. oil and gas drove higher capital spending, which in turn drove the number of U.S.-operated rigs higher. The unconventional operators also began to acquire debt through reserve-based loans or the issuance of high yield bonds to:
- Buy leases
- Buy companies to strengthen their land position and have contiguous leaseholds
- Merge with companies
- To drill wells to keep up their reserves since unconventional plays have such high decline rates
During this time there was less effort to be cashflow positive (profitability) and more emphasis on growth in production volumes with hopes the price of oil would reach $100 per barrel, thus increasing values to shareholders.
Investors’ Mood Changes
Unprofitability from quarter to quarter, and in some cases year over year (e.g. negative cash flows) were changing investor expectations. Investors burned by the “growth at all costs” strategy of many companies started to demand companies to fund operations (i.e. their CapEx) with the cash generated by those operations, a demand that took on added importance in 2019. It is a tall order given lower prices, rig counts and steep decline curves. On top of that, investors are clamoring for robust production growth and generation of extra cash for stock repurchase and dividend programs.
Unconventional operators started to become cashflow positive because of the restraints put on by investors, which partly explains falling rigs counts, especially in 2019. Further driving declining rig counts at the end of 2019 may be ascribed to higher well productivity per rig (e.g. longer laterals) due to consolidation of acreage.
Table 3 shows the Appalachian (Utica and Marcellus) and the Permian had a huge change in the new well productivity per rig compared to the Bakken and Eagle Ford. Because this change in productivity is not uniform between the basins, it is not due to technological advancements such as completion strategies (Ban, 2020).
| Basin | New Well productivity per rig (2019 to 2020) |
|---|---|
| Table 3. Basin versus new well productivity per rig. Note the Appalachian and Permian both had large increases in productivity per rig while the Bakken and Eagle Ford did not. This shows the changes in new well productivity is not due to technology changes as was the case in 2016 but due to continued consolidation of drilling in prime acreage. Data taken from Ban (2020). | |
| Appalachian shale | 25% |
| Bakken | 5% |
| Eagle Ford | 6% |
| Permian | 45% |
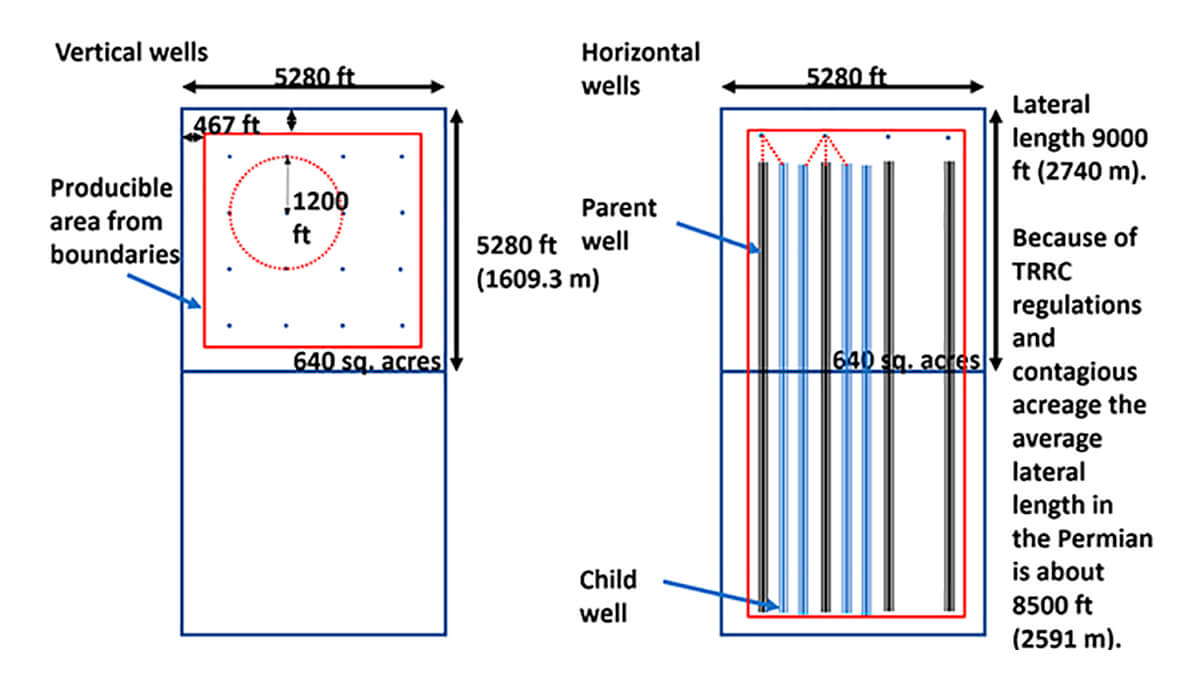
This change in the new well productivity per rig is due to continued consolidation of acreage to make sure that they have units that can support 10,000-foot (3050 m) laterals. This was the one of the big drivers behind the battle between Oxy and Chevron to buy Anadarko (Blackmon, 2019). To be able to achieve 3050 m laterals, operators need to produce sizeable contiguous acreage positions (Fig. 4) but, in the Permian, there can be checkerboard acreage with one company’s leasehold next to another’s. To achieve a 3050 m lateral, an operator needs a minimum of two contiguous leaseholds.
In addition, longer laterals also show lower D&C costs per foot, making long laterals more economical (see Table 4). Such “bolt on” acquisitions also extend a company’s drilling inventory in a play. Increasing productivity from new wells also affects the number of wells having to be drilled and thus the overall rig count. What caused these improvements is not just the drilling of longer laterals but the increased experience and continual improvement in drilling and producing wells in unconventional plays that have resulted in better processes (Rachal, 2019).
| Company | Formation / basin | Length (m) | Length (ft) |
|---|---|---|---|
| Table 4. The longest horizontal laterals in the particular plays with the average being 5829 m or 19,119 ft. | |||
| Nuvista | Montney | 5000 | 16405 |
| Eclipse Resources Corp. | Appalachian | 6341 | 20805 |
| Shell | Duvernay | 6510 | 21325 |
| Moss Creek Resources Holdings | Permian Wolfcamp A | 5467 | 17940 |
Geology of Sweet Spots
As geoscientists working unconventional plays, our job is to find preferred locations in the subsurface that will improve our production (sweet spots). Sweet spots are defined by areas where:
- There’s high TOC (total organic carbon)
- The rock is more brittle than ductile (takes fracs better)
- Geomechanical characteristics favoring better fracs
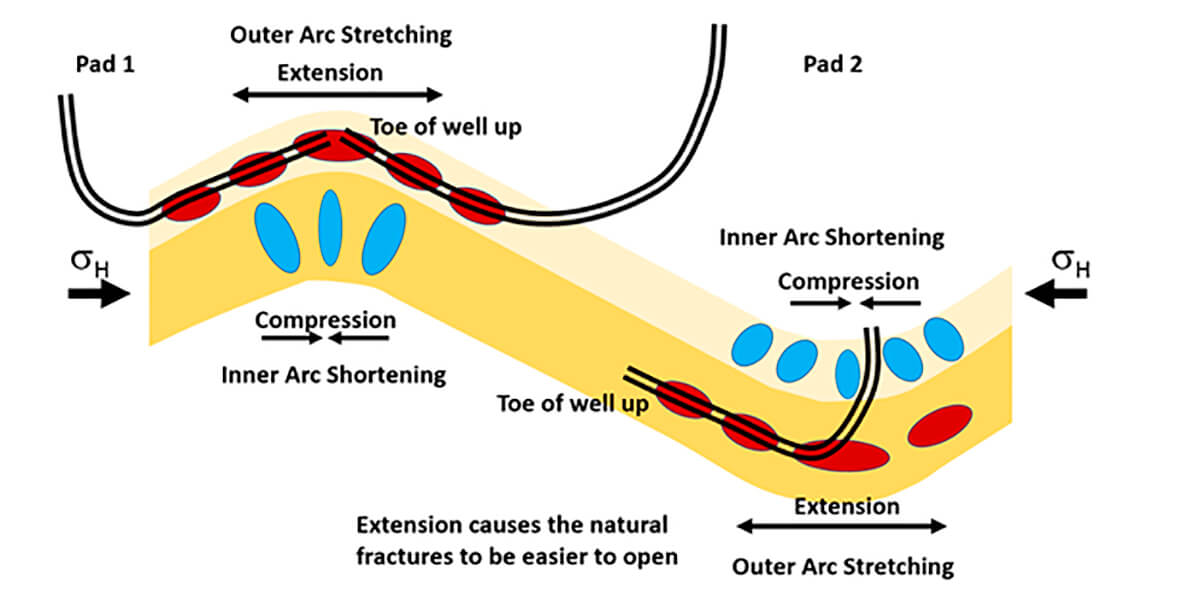
- Geological structure helps generate extension fractures (Fig. 5)
- Increase in porosity from sand or carbonate stringers or intra-kerogen porosity
Most of our sweet spots have a combination of these features that cause the unconventional to frac better to produce higher returns on our horizontal wells compared to our competitors.
The sweet spots tend to be thin stringers that are below the resolution of conventional seismic resolution. Geomodels are built using well logs and constrained by conventional seismic or stochastic inversion (well data for the low frequencies, seismic for the mid-frequencies and variograms for the high frequencies) and are used to help illuminate these sweet spots and develop fairway mapping.
Fairway mapping uses a traffic light to distinguish what is a sweet spot or not. Mapping also aids understanding of the distribution of acreage for making decisions on which leaseholds to chase after. This is where companies can distinguish themselves by being able to chase the best leaseholds and make the best land deals.
This is going to become more important as small to mid-size companies that used reserve-based lending may face a significant revision in the terms they negotiate for taking on debt. This will constrain access to capital in the future, causing some companies to earn just enough money to continue operating and to merely service their debt without ever being able to pay it off. This may force a consolidation in the industry of small to mid-size companies being acquired by larger players with deep pockets who are interested in creating contiguous acreage to better develop these unconventional plays (Cunningham, 2020a). The production of the horizontal wells is also dependent upon the completion strategies used to improve the performance of wells.
Completion strategies depend upon the type of completion (plug and perf, ball drop or zipper); fluid used (slick water, liner gel, & cross-linked gel) and size of proppant, which is dependent on the fluid used.
Engineers use Spotfire or frac databases to mine data from competitors in an area about their completion strategies and overall production results. There are now other ways to understand the effect of our completion strategies on the horizontal well such as directly measuring the effect of our completion strategies using Distributed Fiber Optics Sensing (DFOS). This is leading to unconventional plays becoming more science-based to minimize their costs and maximize their returns.
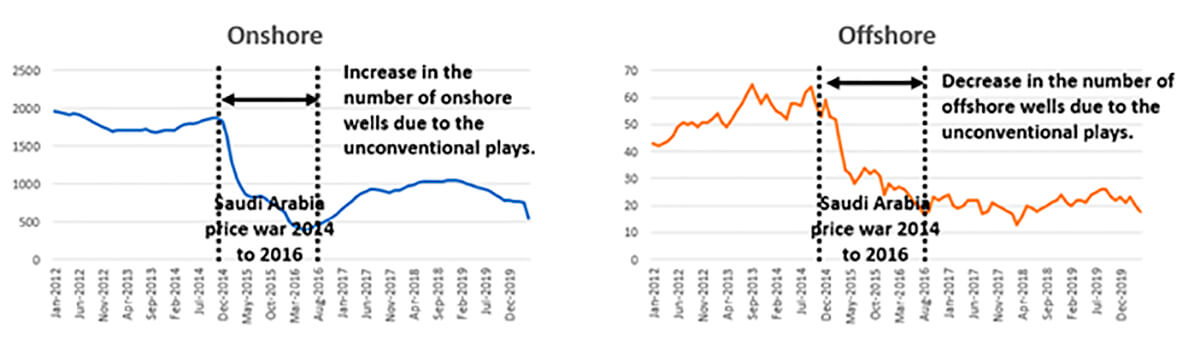
Offshore U.S. versus onshore
In the U.S., the major division between wells is between onshore and offshore wells (Fig. 6). Onshore unconventional plays became attractive because of their ability to bring the unconventional wells online and to market quicker because of in-place infrastructure such as pipelines; they also produce a large portion of the reserves (i.e. generate the bulk of their cash) in 18-24 months.
The point where 50% of the well’s estimated ultimate recovery (EUR) is produced (its half-life) is only at 20% of the well’s life; the half-life of a well correlates strongly with the point where 80% of a well’s value has been achieved (Verdazo, 2016; Schulte, 2020).
What makes the unconventional horizontal wells attractive is its weakness as well. With high break-even prices and steep declines (causing the well to rapidly deplete 70% - 75% of their reserves in the first year) forces unconventional companies to continue drilling new wells to replace lost supply (Domm, 2019; Schulte, 2020). This is especially true if they gained their capital through Reserve Base Loans where the loan is secured by the proved reserves of oil and gas of a borrower.
Drilled but Uncompleted (DUC) Wells
Though the price of oil fell on March 8, 2020, rig counts remained steady for a while because of contracts and commitments, this despite the break-even price being much higher than the price of oil. This development meant companies would not spend extra revenue to complete these wells, i.e. they would be DUCs (drilled, uncompleted).
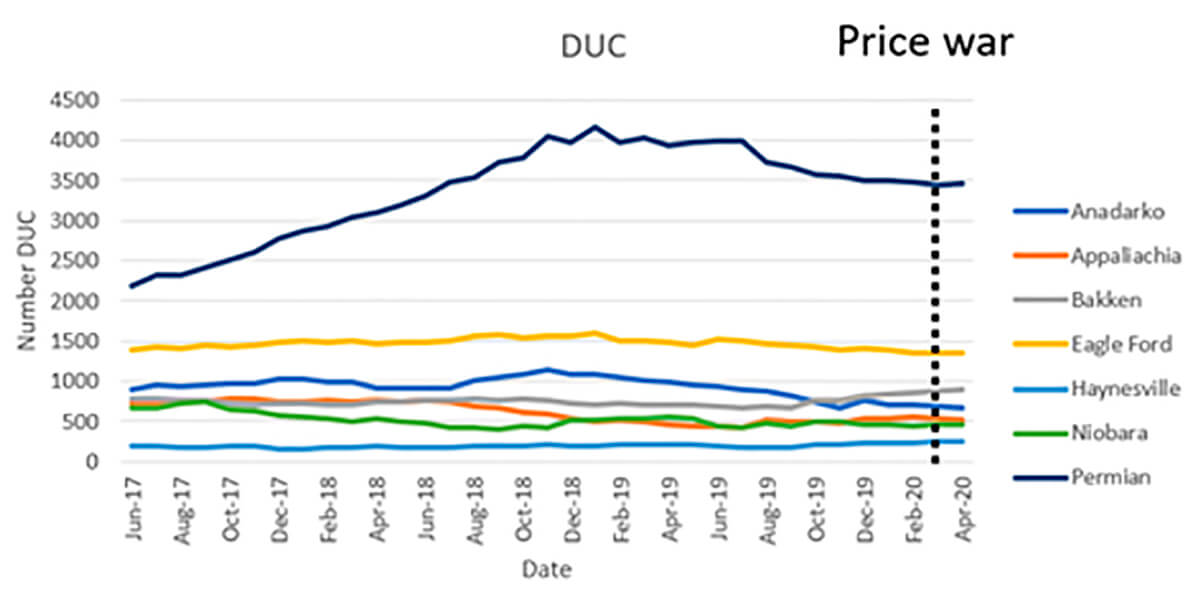
Yet if we look at Figure 7, this is really not the case. We also see issues with DUCs being reported by the EIA. Because DUCs are long-term (i.e. suspended) and partially funded (needing completing) they are in effect a storage of supply in the ground and they imply more production capacity than exists. This leads to downward revisions of supply estimates (Scheid et al., 2020).
The reasons why we have DUC wells are (EIA, 2020g):
- Low oil and natural gas price environment may postpone well completion activities in areas where the wellhead break-even price is too high compared to the current market price
- Lack of available well completion crews to perform hydraulic fracture activities in areas of high demand
- Ability to transport hydrocarbons through pipelines away from the resource (i.e. insufficient pipeline capacity, or “takeaway”)
- The wells were drilled for contractual or lease-related obligations in lower tier acreage which may be put on hold for completions in favor of higher tier, more productive acreage (Mayer, 2020)
- Aggressive drilling programs and slower rate of completions (Rachal, 2019)
In Figure 7 there is overall a reduction in DUCs since July 2019, except for the Bakken. This occurred simultaneously when there was a reduction in the number of wells being drilled (Fig. 3).
The drive to reduce the number of DUCs may well have been because individual companies were trying to reduce costs to improve their profitability, perhaps anticipating low prices in 2020 as early as 2019. There was also pressure from investors for the shale industry to be cashflow positive and to stop accumulating financial losses and more debt (Ban, 2020).
The amount of time wells stay uncompleted has a negative impact on their overall performance, both in terms of IP90 as well as ultimate recovery. This should be a consideration when a company buys leases with a high number of DUCs (Mayer, 2020).
As prices increase, producers will maintain their current capital spending levels, not drill, and pay down their debt (Ban, 2020). They will first focus on bringing shut-in production back online. In terms of drilled uncompleted wells (DUCs) they may increase as it is uneconomical to complete some of the wells during this downturn. When the price of natural gas or oil stabilize, they will begin to reduce the number of DUCs increasing their production. This is driven by capital providers making Balance Sheet health essential to their investing in oil and gas thesis (Ban, 2020).
Frac Crew Counts as an Activity Metric
Fracking performed by a frac crew is referred to as a “frac spread” or “frac fleet.” Counting frac spreads is a better indicator of how much oil will come online than counting active rigs since wells drilled may not come on-line for various reasons and may become dead DUCs.
Which Wells to Shut In? Criteria
In most shale wells these days, electric submersible pumps, or ESPs, are used for artificial lift. ESPs can also act as surveillance systems to organize and store data in a centralized location for monitoring and control. ESPs send data from deep within the well to a remote telemetry unit on the surface that transmits it online to production managers (Wethe, 2020).
By using ESPs we are trying to prevent operating problems from afar before they lead to costly failures and at the same time, these systems allow managers to easily shut down a well as needed (Wethe, 2020).
Unconventional wells can be shut-in for a month or so while fracking is going on in another nearby well to avoid frac hits (Wethe, 2020).
Unconventional wells are easy to shut-in compared to wells offshore in the Gulf of Mexico where the challenge is the miles of flow lines that carry the oil along the seabed to processing facilities on shore. At such depths, the liquids in the lines could clog if shut off for too long (Wethe, 2020).
In Canada, the SAGD thermal wells offer a challenge to shut-in because turning off the steam may cause the reservoir to lock up, impairing how much oil can be recovered. The first Canadian wells to be shut-in are by non-oil sands producers who do not have direct access to refineries (Wethe, 2020).
Best Shut-in Candidates
After choosing the least profitable wells to shut-in, the other consideration is shutting in wells with the best chance of restarting after a strong price signal, regardless of what they are producing (Jacobs, 2020).
Some prefer to shut in the high-pressure or low water production wells because low pressure wells tend to be more prone to relative permeability-blocking effects and water-loaded wells can have water collect in the low spots of the horizontal and this can be exacerbated if the horizontal is undulating (Jacobs, 2020) creating problems when the well comes back online and could cause the well to be re-worked.
The risk of shutting in the newest wells in over-pressured formations is if they are brought on too quickly, the fractures may compress too much, and the proppant is put under stress or may become embedded. To prevent this from happening, a choke should be used to “slow back” the high-pressure wells as production starts up (King and Garduno, 2020).
The reservoir fluid type can also be a consideration; gas being easier to flow and oil is hard to start flowing with viscous or heavy oil being even harder to flow. The gas displacement of liquids is only limited to fingering as gas slips past oil (King and Garduno, 2020).
The single most predictive factor for maximizing resource recovery (and thus cash generated) is the ability to expose the borehole to the most reservoir rock possible. It also increases the effects of reservoir inconsistency and fluids; we see higher pressure frac stages will migrate into a wellbore’s lower pressure stages until a state of equilibrium is achieved. This is known as the 3rd law of thermodynamics, aka the crossflow effect. This means a depleted fracture may be re-charged, i.e. as the pressure builds up, the depleted proppant pack can be placed under more stress (Jacobs, 2020).
Oil’s Up!!!
The price of oil is increasing because (Rapier, 2020):
- Less Drilling- the U.S. as seen a 73% drop in the number of oil and gas rigs operating compared to last year; Canada’s rig count is down 85% in the same period (Baker Hughes, 2020). The number of wells actually drilled in Canada from January 1, 2020 to July 17, 2020 is also down 47% compared to the same period last year with the top three plays being the: Viking (oil), Montney (oil & gas), Duvernay (oil & gas) (BOE Report, 2020).
- OPEC+ has cut production by 9.7 million BOPD, the U.S. cut its production by 2.6 MMBOPD, Canada by 1 MMBOPD, jointly it is 3.6 MMBOPD. Saudi Arabia and other major producers have shown a willingness to extend the record high production cuts until the end of 2020. Expected drawdowns from demand exceeding production is expected to free up storage.
- Demand growth from the return to some semblance of normalcy is playing a bigger role as tactics for managing COVID-19 are freeing up economic activity, increasing demand for refined products such as gasoline.
With the price of oil increasing, U.S. operators are bringing back shut-in production and Canadian operators plan to increase their production by 200000 BOPD or 20% of what they shut-in (Tuttle and Orland, 2020). Most companies shut-in their newer wells (generally high geopressured) so there would be less damage and they can easily be brought back online.
However, structural issues persist. Most companies have too much leverage and with the extra cash from the increase in the price of oil, they will use that cashflow to repair their balance sheets- the equity markets are essentially closed to the unconventional players and will likely continue to be so until actual balance is restored to their balance sheets. Unconventional players will be looking less at drilling new wells than at paying down debt with hopes that it generates some premium for shareholders (Cunningham, 2020a).
The outlook for 2020-2021 is for unconventional players to have flat production or even slight declines. Further, the natural decline in the unconventional plays production could drive production below 11 MMBOPD by the end of 2021, causing oil to be bullish in 2021 (Cunningham, 2020a). Economic growth and actions by OPEC+ are huge variables in this equation.
On July 10, there were 263 rigs operating in the U.S., down 73% from last year. Canada had 18 rigs operating, down 85% (Baker Hughes, 2020). The number of wells actually drilled in Canada from January 1, 2020 to July 17, 2020 is also down 47% compared to the same period last year (BOE Report, 2020).
In May 2020, 70 out of the 450 frac fleets (15%) were operating in the U.S. and Canada (San Antonio Express News, 2020) and now at the end of June there are 83 out of the 450 frac fleets (21%) operating with these additional frac crews going to the Permian (Chapa, 2020).
| MAY 2020 | JUNE 2020 | ||||
|---|---|---|---|---|---|
| Table 5. Distribution of the frac fleets across the U.S. basin- May 2020 (Source: San Antonio Express News and Houston Chronicle). | |||||
| Basin | Number of frac crews | Percentage | Number of frac crews | Percentage | Change |
| Marcellus | 22 | 31% | 22 | 27% | 0 |
| Permian | 21 | 30% | 30 | 36% | 9 |
| Eagle Ford | 10 | 14% | 10 | 12% | 0 |
Variables affecting oil prices going up include:
- Continued U.S. production curtailment amid the rising prices.
- Demand for oil as the countries come out of lockdown.
- Geopolitical tensions: U.S., Russia, China, Iran, Venezuela, Nigeria, and others
- Social/environmental activism disruptions
- Hurricane season- Gulf Coast activity is forecast to be above normal this year with a prediction of 13 to 19 named tropical storms, potentially generating 6 to 10 hurricanes, some 3 to 6 possibly developing into major hurricanes (Fedschun, 2020)
- COVID-19 outbreaks and/or a vaccination.
- 2020 is an election year in the U.S.- Presidential, House of Representatives and 35 Senate seats in play in November. Democratic Presidential candidate Joe Biden has vowed to stop all oil and gas drilling on federal land (Hedden, 2020). He opposes fracking as well. This “public policy” risk is another headwind facing industry.
Future of Hedges
The issue: after oil’s unprecedented, and in many circles, inconceivable price plummet below zero, producers are now faced with hefty premiums for the financial instruments they rely upon to hedge their production taken to insure against these volatile price swings (Ngai, et al., 2020).
The companies that have managed to hedge for 2021 at the $30 range did so because they are tight on cash flow or have heavy debt (Ngai, et al., 2020). If they hedge at this level and the price of WTI continues to increase, these companies will lose out on that upside, but if they are exposed to another steep drop, their very existence would be threatened.
Despite the uptick in the price of oil (a case for bullishness), hedge funds and other money managers have nonetheless been slowing down the purchase of petroleum futures and options, a disappointing signal that much of the market may be bearish on the price of oil (Kemp, 2020).
There are concerns with limits on hedges, and many unconventional producers could feel a liquidity squeeze in the coming year should their high yield bonds or loans be maturing (Kimani, 2020).
Natural gas
U.S. natural gas not only comes from gas plays like the Utica, Marcellus, Haynesville and Anadarko but roughly half of the growth in U.S. gas output comes from gas associated with oil plays like the Permian, Eagle Ford, Bakken, and Niobrara (Kumar and DiSavino, 2020).
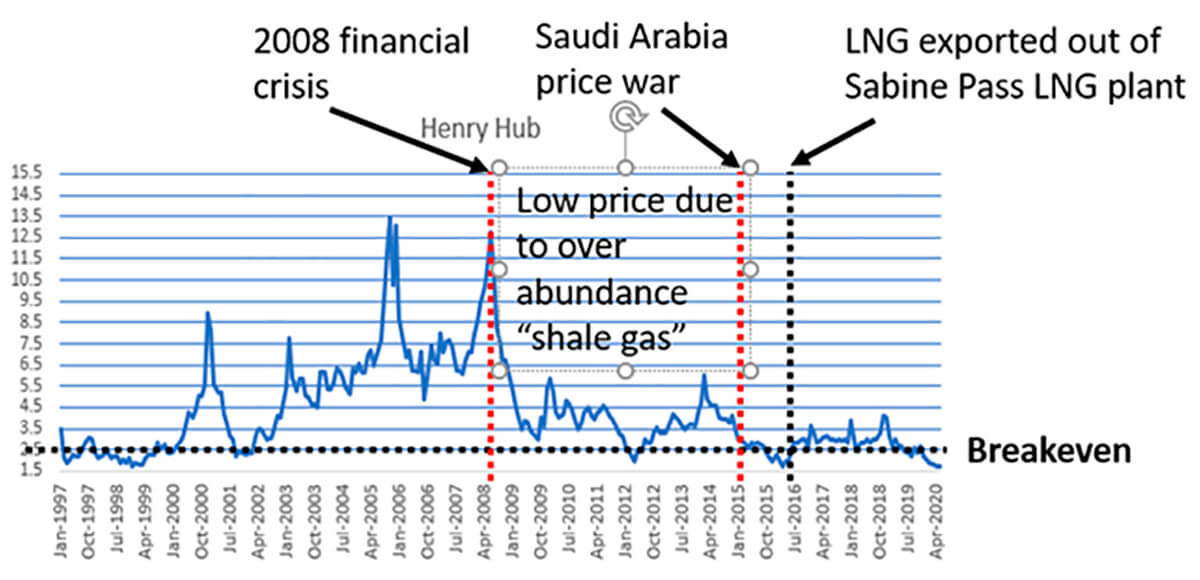
Since unconventional plays have increased natural gas supplies, it has been difficult to get that gas to markets outside of North America. This poor access to international markets has been a drag on natural gas prices, with Henry Hub prices from 2009 to 2020 averaging around $3.31 per MMBTU. Prices have ranged from a high around $6/MMBTU to as low as $1.73 per MMBTU amid the COVID-19 price collapse. For some context, it was not unusual to see natural gas prices of $10 and higher during tight markets in the 2004-2008 period (basically pre-Marcellus). Spot prices could spike to over $20 during periods of severe cold or sustained heat waves back then.
Most large operators such as Chevron, Royal Dutch Shell today say “natty’s” price needs to be around $2.50/MMBTU to merely break-even. Continued poor demand due to the economic impacts of COVID-19, combined with plentiful supplies, are keeping prices below that $2.50 threshold. As a result, EQT Corp, CNX Resources Corp, Royal Dutch Shell Plc and Chevron Corp are among those companies reducing the value of gas properties, causing them to have to write down their assets (Kumar and DiSavino, 2020).
On May 16, 2020 EQT Corp., the largest producer of natural gas in the U.S. announced it was curtailing its production by 1.4 Bcf/day due to COVID-19-19 (Kumar and DiSavino, 2020).
International Energy Agency (IEA) expects the demand for natural gas to fall by 4% this year due to the lower activity caused by the lockdowns (Cunningham, 2020b; Jaganathan, 2020). As for the national energy mix, low natural gas prices allow gas to continue to erode the share coal has in power generation, which delivers a double benefit in lower prices for electricity and lower GHG emissions (natural gas emits half the GHG as coal). Further, despite efficiencies in wind and solar, low natural gas prices are pressuring their share of power generation as well (Sertin, 2020).
LNG
The first American LNG export was to Brazil from the Sabine Pass LNG plant in Louisiana February 2016. The trend accelerated with LNG seeing investment into processing and exporting of $50 billion in 2019.
American LNG was exported to Asia to power its industrial sector, with China expected to overtake Japan as the world’s top importer of the fuel by 2025. Besides Japan and South Korea, other Asian countries like Bangladesh, India, Pakistan, Thailand also import LNG. It was also expected that European LNG imports would increase as their domestic gas production declines, domestic anti-fracking sentiment and policies driving diversifying of energy supplies (e.g. wind and solar) (Jaganathan, 2019).
Asian demand for LNG has been the main driver for LNG trains to be built in Kitimat, B.C. Canadian gas producers see LNG as lifting domestic gas prices in Alberta and B.C., as some of the natural gas is diverted to the more lucrative Asian markets. Currently the majority of Canada’s natural gas is exported to the U.S. where this is more pressure on prices from various sources. Access to more markets provides producers more pricing power.
West Coast LNG has a considerable logistics and efficiency advantage over Gulf Coast producers who have to navigate the time and costs disadvantages stemming from having to use the Panama Canal for Asian LNG delivery to reach the Pacific Ocean. Asian governments and LNG purchasers consider the Panama Canal a potential logistical chokepoint and a political risk (Western States and Tribal Nations, 2020).
During the lockdowns LNG shipments to China were suspended because of a plunge in heating demand during the initial COVID-19 lockdowns. To the east, LNG faced similar demand weakness due to two factors: reduced switching of coal-to-gas for power generation (Jaganathan, 2020) and a mild winter. The resulting LNG cargo cancellations prompted producers to cut production.
All that said, top producers still have not reduced production as storage nears capacity. It is expected that Europe will be the first market to hit the crisis point of lack of storage capacity. Unlike oil, the gas market lacks a coordinated approach (i.e. there IS no “OPEC for gas”), allowing the current oversupply to drift unchecked (Stapczynski et al., 2020). Given the once unthinkable negative price for oil in late April, the prospect of a similar utter collapse in gas prices suddenly doesn’t seem so impossible.
Because of LNG, has, like oil, become a global commodity, so even though LNG contracts from the U.S., Malaysia, Brunei, and Norway have been cancelled, gas from Russia (via the Yamal-Europe pipeline) increased this month. Another gas giant, Qatar, was redirecting LNG cargoes away from Asia in February and sending them to northwestern Europe.
COVID-19 disruptions and the demand destruction earlier this year meant Qatar had nowhere to send its LNG to. Qatar is the number one supplier of LNG; concerns there are that cutting its exports could open the door to competition. Australia is just one country that could steal their market share and become the number one exporter of LNG (Ratcliffe and Shiraevskaya, 2020).
So, Qatar’s decision is this: cut production or face Europe turning its LNG tankers away. If Qatar forces the shipments on Europe, we could see a potentially negative price for LNG in Europe. However, Qatar may do this just to hurt Australia’s LNG in a bid to protect market share (Ratcliffe and Shiraevskaya, 2020; Slav, 2020).
Despite the unprecedented warping of global markets in 2020, long term demand for LNG is expected to grow, especially in Asia as other countries such as the Philippines and Vietnam are expected to build facilities for it. This could cause prices to increase as the demand for it increases yet concerns that LNG may have too many producers fighting for market share creating a persistent low-price environment (Slav, 2020).
Alberta Natural Gas
Geography is as important to Albertan gas prices as geology is to its production. While we look at the Henry Hub price as a good indicator of what is happening with natural gas, Canada’s natural gas, like our oil, is heavily discounted since mid-2017 because of how far Alberta is from major natural gas markets (Fig. 9) (Alberta Energy, 2020; EIA, 2020i).

The increase in the AECO price of natural gas is due to two things (Bloomberg, 2020):
- Natural gas producers have cut back on drilling
- A rule change on a key Alberta pipeline system last year. TC Energy Corp. temporarily changed the tariffs on its NOVA Gas Transmission Ltd. pipeline network, or NGTL. The modification gives natural gas producers increased access to storage during periods of maintenance on the system, which dampens the pricing volatility during the often-turbulent summer and fall seasons.
Unlike oil, the issue is not pipelines (there is an extensive network of natural gas pipelines in Canada and the U.S.). The issue is regulatory boards like the Alberta Energy Regulator that regulate the tolls paid by producers to use the pipelines [AER] (Alberta Energy, 2020).
Given what appears to be decades of supply of natural gas from North American oil and gas basins, the continued acceleration of export capabilities from North America is emerging as the primary, if not sole, component of price support in the foreseeable future.
Some Final Thoughts
Oil and gas are notorious for its volatility, and 2020 may be the most volatile year ever seen. As such, resiliency and resourcefulness will determine who comes out in better shape in 2021.
A theme of this paper is that unconventionals plays are more resilient than offshore or SAGD because of the ability to shut in preferably newly drilled wells that are high geopressured (thus minimizing damage from changes in the reservoir). Some of the resiliency and resourcefulness required today is reflected in the industry’s response to the 2014 Saudi efforts to flood the market to weed out North American producers. Industry cut costs and innovated to drive down break-even prices, with examples like longer laterals, better frac designs, and consolidations, acquisitions and mergers referenced in this paper.
Is the unconventional play dead? Not really- evolving is more like it. We are seeing events we have never seen before such as the lockdowns due to COVID-19, and this has caused volatility as countries try to hold onto their market or increase it in oil and in natural gas or LNG.
We will see larger companies with deep pockets purchasing smaller distressed companies to create the contiguous acreage to drill ever-longer laterals. The longest lateral to date was drilled in the Utica shale with a lateral length of over 18,500 ft (3.5 miles) and was completed with 124 frac stages in 24 days (World Oil, 2016). Currently in the Permian the lateral lengths are about 16,191 ft or 3 miles (Chapa, 2019) and we are seeing similar lengths in the Montney and the Duvernay in Canada. Part of these purchases depends upon the geoscience and understanding the sweet spots in these unconventional plays.
Our industry is changing, we are becoming more integrated with the use of geomodels and reservoir simulations. We need to utilize more science in our plays and focus on returning profit to our shareholders rather increasing debt and trying to increase our reserves. This is a different mindset for the unconventional plays. We need to strive to be cash flow positive.
In 2014 when the first Saudi Arabia price war occurred, we changed our D&C strategies to lower our break-even prices and now with this second price war in 2020 we have learnt how to manage our production better.
We need to do better, we need to push ourselves harder, and we need to think about how we can bring value to our teams. The speed of drilling and the complexity of unconventionals make collaboration more important than ever in an industry not known for its members playing well together. No one is smarter than everyone, as the saying goes. That takes understanding what we are doing and what our goals are.
What the future hold depends upon many things, but right now we need to reduce our GHGs emissions, have better environmental, social and governance (ESG) metrics which inform our investors about our estimation of our CO2 footprint, health and safety events, environmental policy, people diversity, etc. Overall, these efforts require more capital in one of the most highly CapEx-driven industries in the world. After a decade of virtually zero return on investment for stockholders (especially when factoring in inflation), everything management teams are doing these days should contribute to a single goal- making oil and gas investment-grade again.


Join the Conversation
Interested in starting, or contributing to a conversation about an article or issue of the RECORDER? Join our CSEG LinkedIn Group.
Share This Article