Summary
The Upper Morrow sandstones in the western Anadarko Basin have been prolific oil producers for more than five decades. Detection of Morrow sandstones is a major problem in the exploration of new fields and the characterization of existing fields because: (1) they are often very thin, (2) they are laterally discontinuous and (3) the acoustic-impedance contrast between the sandstone and the surrounding shale is low (Singh et al, 2011). In Postle Field, the Morrow A sandstone has a low acoustic impedance contrast with surrounding lithologies. By using seismic inversion to transform the data into acoustic and shear impedance volumes, resolution can be enhanced allowing the imaging of the reservoir and providing a better understanding of the changes within the Morrow A interval due to injection and/or production. The objective at Postle Field is to determine if time-lapse multicomponent seismic technology is applicable for monitoring a thin sandstone reservoir of Pennsylvanian age undergoing miscible CO2 water-alternating-gas (WAG) flooding for enhanced oil recovery (EOR). A detailed description of the flow simulation workflow can be found in Heris, 2011.
Introduction
Time-lapse compressional, or P- wave, seismic data are a proven tool for monitoring production and injection changes in young, thick, high porosity, clastic reservoirs. The difficulty in Postle is mainly caused by the thickness of the reservoir. It is below tuning thickness throughout the area. In addition, the low impedance contrast between the reservoir and surrounding lithologies make the interpretation even more challenging as explained by Singh (2008), Wiley (2009), Robinson (2010) and Mohammad (2010). Also, CO2 injection in the form of WAG reduces the effect of time-lapse changes that can be detected by seismic imaging due to water injection. Multicomponent seismic monitoring is necessary to the process of dynamically characterizing flow units in the complex valley fill system involving the Morrow Formation within Postle.
Time-lapse (4-D), multicomponent (9-C) seismic data were acquired to monitor an area of 6.25 square miles during carbon dioxide injection in the Morrow A sandstone reservoir. By using model-based seismic inversion to transform the data into acoustic and shear impedance volumes, resolution was enhanced allowing the imaging of the reservoir and providing a better understanding of the changes within the Morrow A interval due to injection and/or production. Acoustic and shear impedances were compared with the results obtained from the reservoir simulation model performed by Heris, 2011.
This study shows the value of S-wave data in Postle Field for the interpretation of the very thin Morrow A reservoir. The integration of simulation and 4-D seismic interpretation is necessary to achieve a credible dynamic reservoir characterization. By integrating P-wave and S wave time-lapse data with reservoir simulation and production data it is possible to enhance the understanding of the reservoir and the changes associated with the WAG process. Many papers and publications in the literature discuss attempts to integrate flow simulation and time-lapse seismic. However, none have dealt with thin reservoirs undergoing CO2 WAG EOR process (Heris, 2011). In fact, Postle Field is the first time-lapse seismic study that involves CO2 injection in the form WAG.
Postle Field
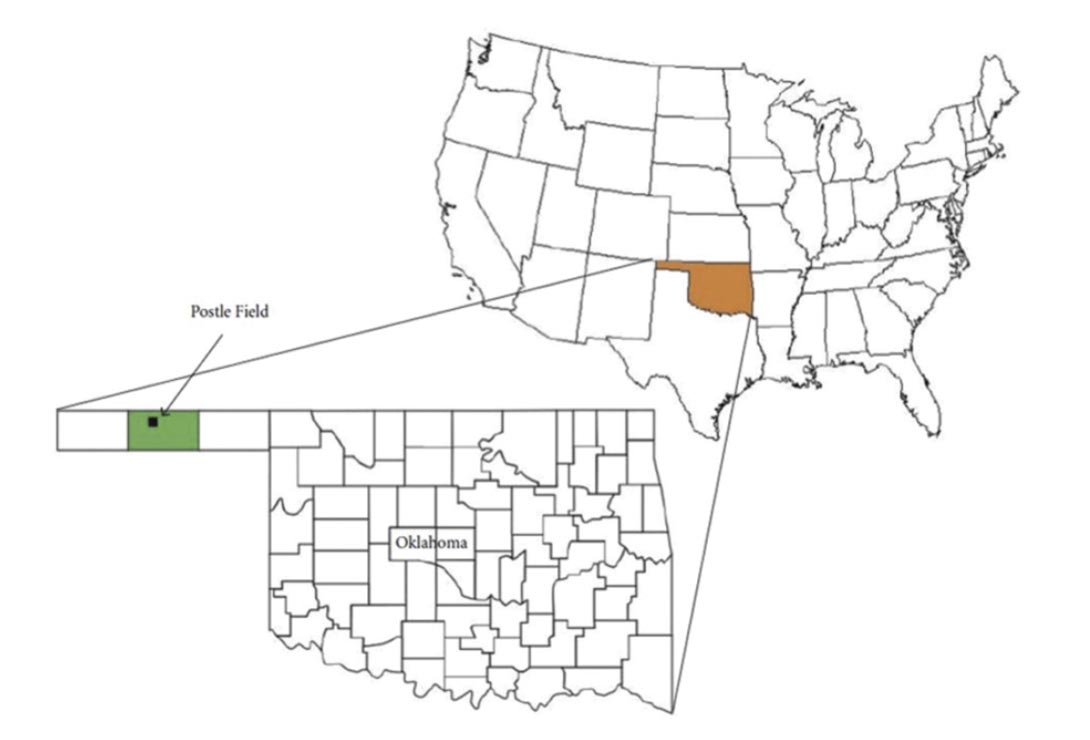
The study area is located in Postle Field, Anadarko Basin, Oklahoma (Figure 1). The Anadarko Basin is one of the major hydrocarbon producing provinces in the USA. According to Sorenson (2005), Panhandle-Hugoton Field in the Western Anadarko Basin is a giant oil field (estimated ultimate recovery (EUR) 1400 million bbl of oil) and the largest conventional gas field in North America (EUR > 75 tcf) (Singh et al, 2011).
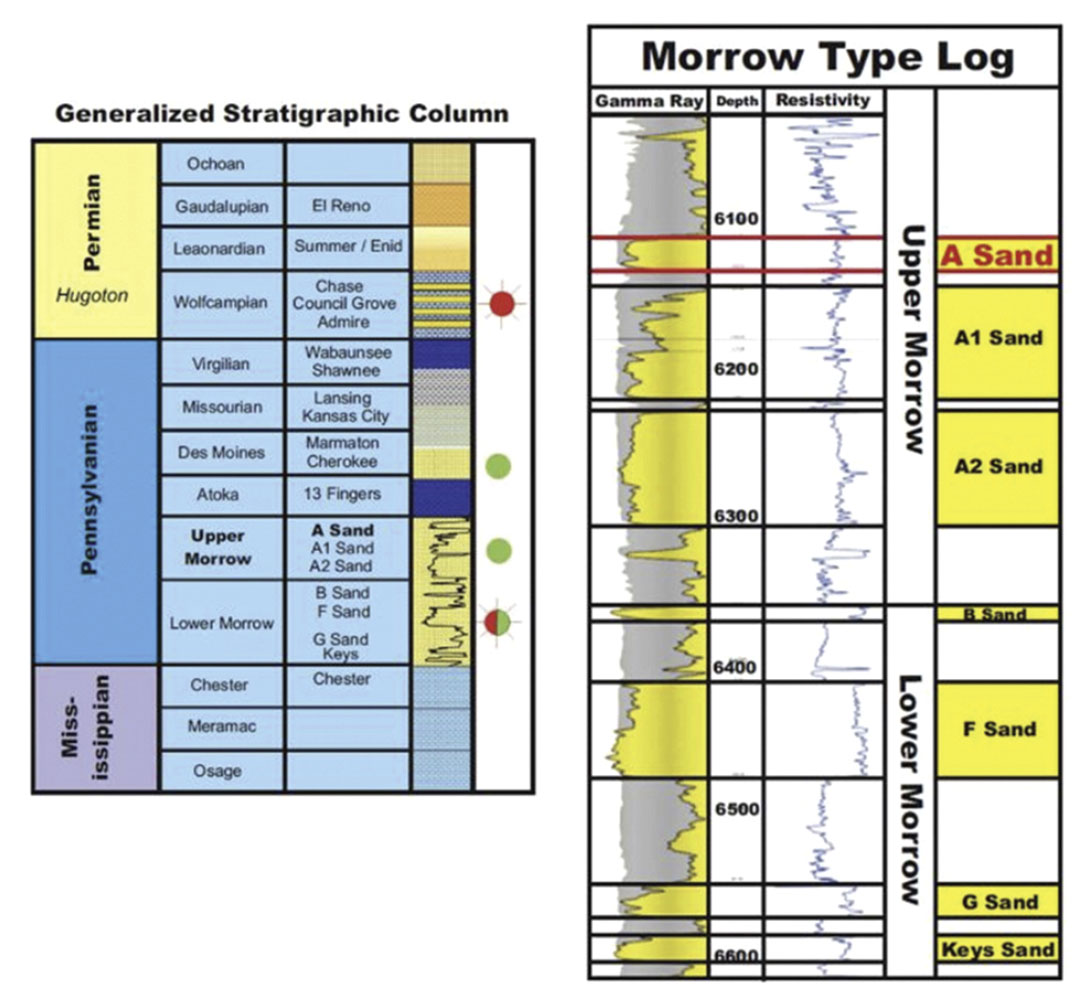
In the Western Anadarko Basin, the Morrow Formation is an important oil producing reservoir. The Upper Morrow consists of multiple stacked lenticular sandstone bodies formed within valley fill complexes. In Postle Field, the Morrow Formation lies unconformably on top of Mississippian strata and conformably below the Thirteen Fingers Limestone of the Atoka Formation (Rascoe and Adler, 1983). Figure 2 shows a generalized stratigraphic column and a type log for the Morrow sandstones in Postle Field. The Morrow A sandstone is approximately 6000 ft deep, and its thickness varies from 0 ft to 70 ft, with a mean of 35ft. The average porosity of this sandstone is 17%, the permeability is around 50 md and the oil gravity is 39 API.
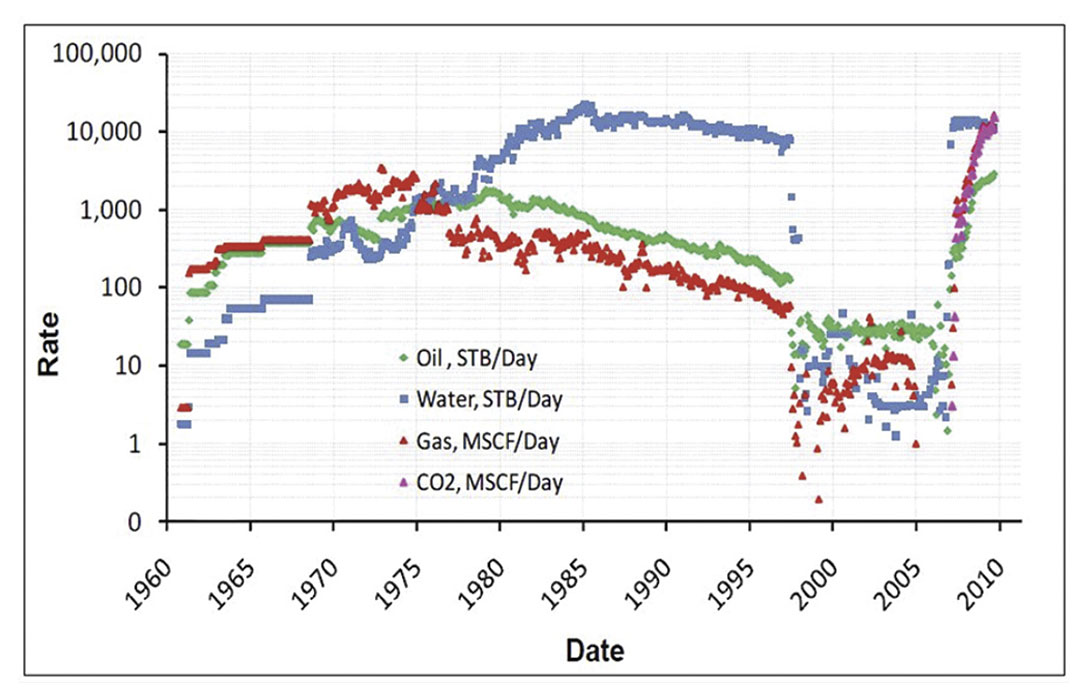
As seen in Figure 3, primary production of the Hovey Morrow Unit (HMU) started in 1961, with a subsequent water flood in 1974. By 1998, the production dropped to a little over 100 barrels of oil per day from only the 15-1 well (Heris, 2011) and the field was nearly shut-in. In 2004, Whiting Petroleum purchased rights to the Hovey Morrow Unit and began a CO2 flood in late 2007 using an inverted 5- spot injection pattern to boost production and to target the remaining oil saturation and potential unswept sands. Currently, the injector wells are on a water-alternating-gas (WAG) injection process. The actual time periods vary from well to well depending on injection rates (Heris personal communication, 2011). Water is injected in addition to CO2 to prevent localized fingering by slowing the rapid movement of the more mobile CO2. The CO2 flood performance and oil recovery have been excellent in this area, and oil production has exceeded the previous peak production for the unit.
Previous Work
As described by Heris (2011), the integration of 4-D seismic and flow simulation interpretation is necessary to achieve a credible dynamic reservoir characterization. 4-D seismic has the potential to provide valuable inter-well information that can assist the history matching process and vice versa. Incorporating the information derived from 4-D seismic interpretation further constrains the reservoir model and reduces the uncertainty associated with the simulation results. Qualitative and quantitative integration of flow simulation and 4-D seismic are necessary to validate the results of 4-D seismic anomalies and the flow simulation model. Permeability and relative permeability are the main reservoir parameters that can be modified to improve history match results (Heris, 2011). In areas where the time-lapse seismic anomalies are believed to be real and the information reliable, 4-D seismic interpretation can help to modify permeability and introduce permeability barriers or baffles spatially in the model. The works of Robinson (2010) and Mohammad (2010) were used to generate a first group of modifications to the flow model resulting in an improvement in the history match results calculated by Heris (2011). Figure 4 shows the location of changes in permeability within the reservoir model. This was done to model high permeability zones in the reservoir. Some of the permeability modifications are constrained with 4-D seismic interpretation.
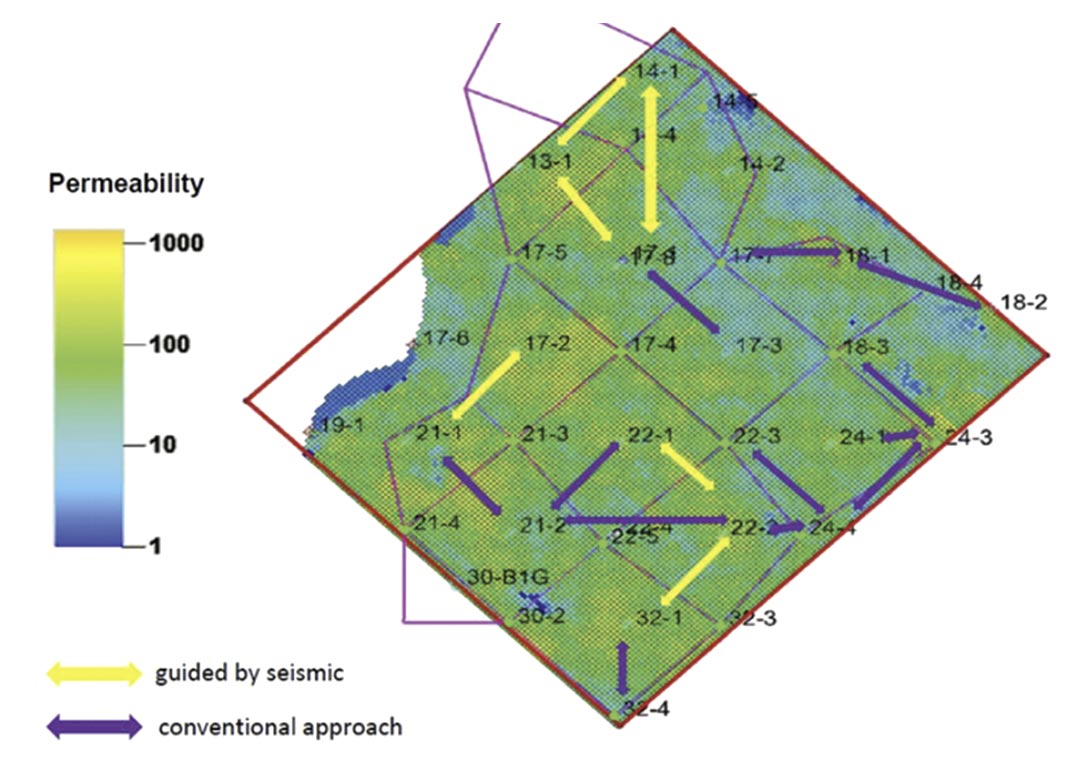
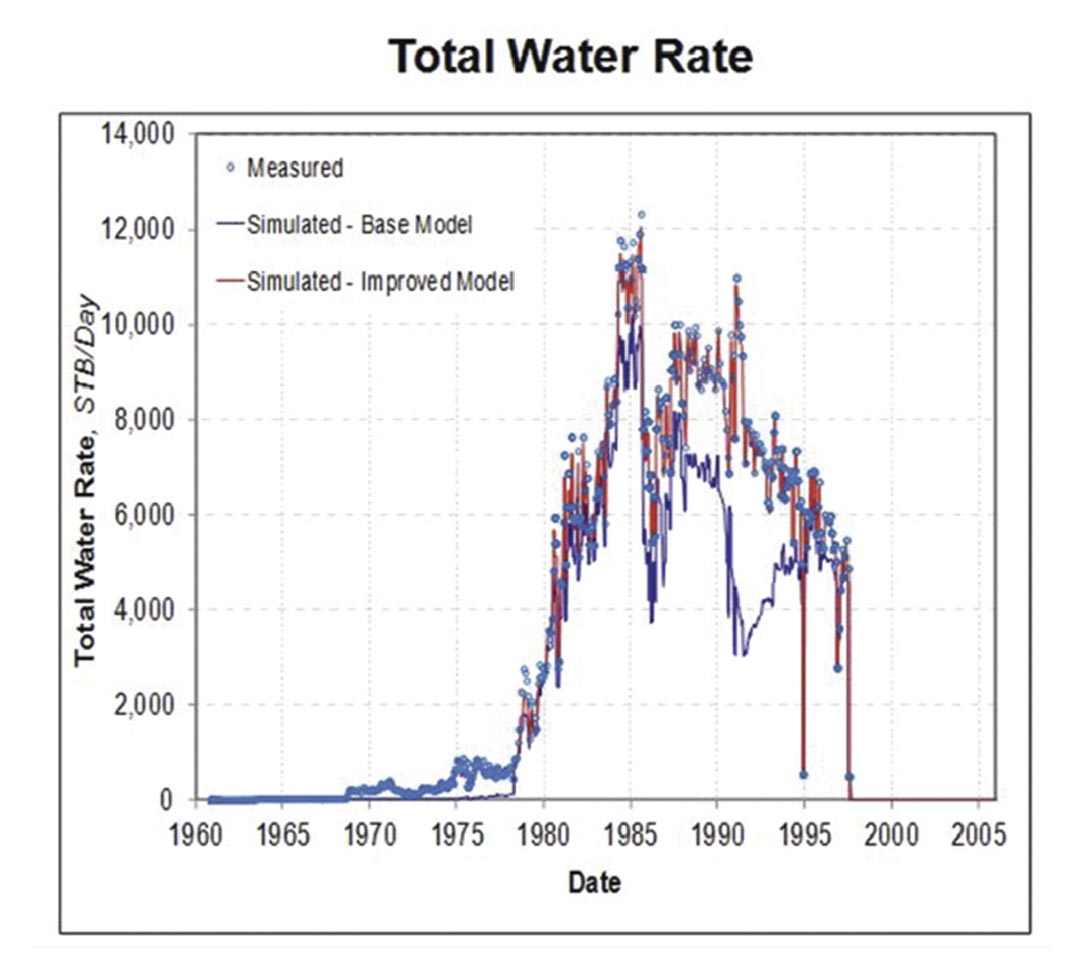
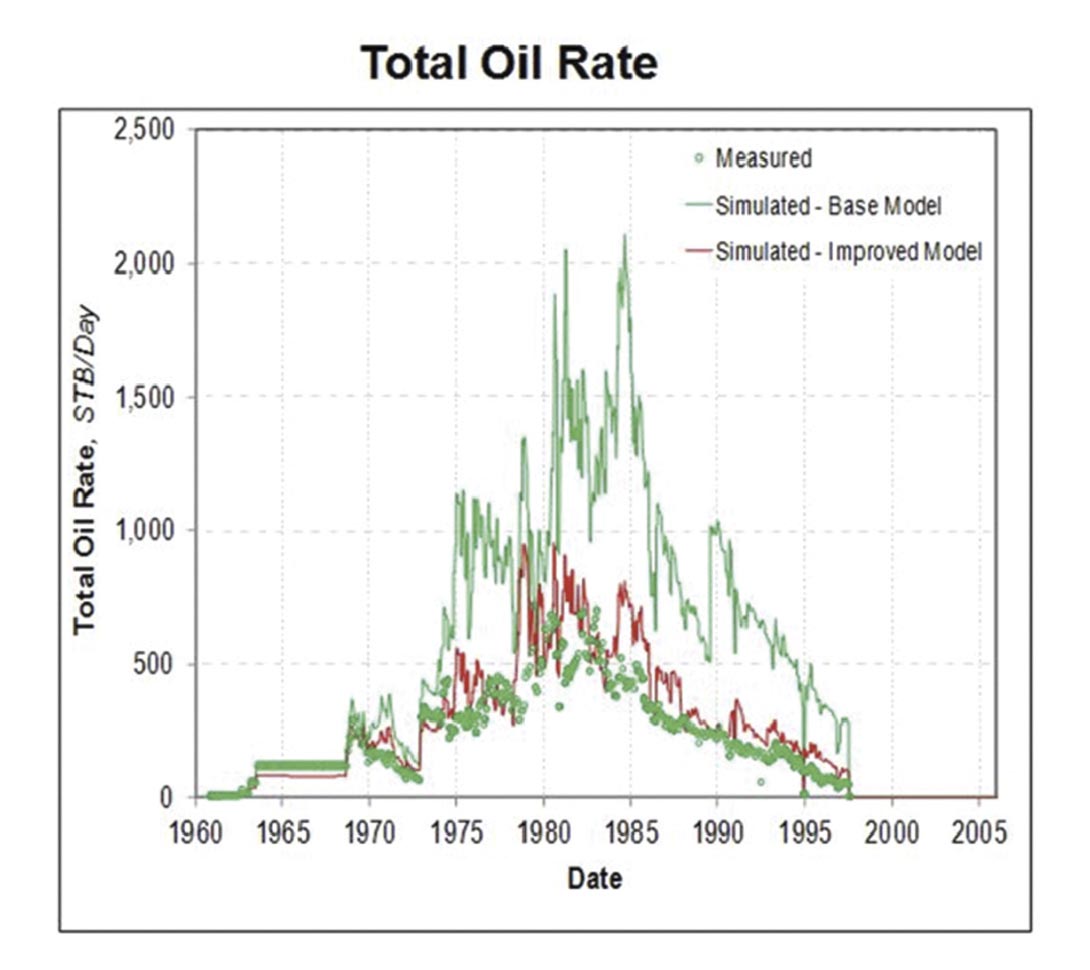
Figure 5 show the history match results for total water rate and total oil rate. The dots represent actual data and solid curves are simulated results from the base simulation and the improved model including the modifications of the permeability model. As seen in figure 5, the wells in the study area had very high water cuts. Simulating this behavior in the model is challenging. The reason for the high water cut and mismatch between the base model and the actual data is mainly the heterogeneous nature of the reservoir. To improve the history-match, the permeability between producers and injectors at some specific simulation layers were increased up to 5 times. Improvements in the reservoir model were obtained by means of an iterative process of history-matching and permeability modifications.
Methodology
The main objective in this study is to dynamically characterize the Morrow A sandstone, by using P- and S-wave time. To fulfill this goal we:
- Cross-equalized the data to minimize the changes in the surveys to the acquisition processes.
- Inverted the P and S11 baseline and 1st monitor volumes to create Zp and ZS11 maps associated with the reservoir
- Compared the seismic time-lapse changes with the calculated flow simulation results.
Cross-Equalization
One of the challenges at Postle Field is to overcome the narrow bandwidth of the seismic data and the low impedance contrast between the reservoir and the surrounding lithologies. Mohammad (2010) and Robinson (2010) demonstrated the potential of P-wave time-lapse to dynamically characterize the Morrow A reservoir at Postle Field. The success of the 4-D seismic monitoring depends on the ability to monitor small changes of the seismic traces due to changes in reservoir conditions. In order to enhance the detection of reservoir changes, the repeatability of the surveys must be optimized. Cross-equalization can be defined as a series of processes applied to time-lapse seismic in an effort to match the involved datasets (base and monitor survey(s)) in terms of their frequency spectrum, arrival times and amplitudes in those zones that have not been changed (Sheriff, 2002, and Atkinson, 2010).
The goals of the cross-equalization process is (1) to reduce the changes in reflection signal caused by changes in acquisition and processing; and (2) to increase the repeatability of the surveys while enhancing and preserving the changes caused by production and injection. The cross-equalization scheme is performed by matching a static window above the reservoir to account for changes in amplitude, phase, frequency and time. The assumption is that this static window lies above the productive zone, and is assumed to have not experienced any production related alteration (Rumon, 2006). In an ideal case, an equalized static window will produce a difference volume equal to zero, except within the reservoir where there are changes due to production and/or injection (Ross et al., 1996 and Mohammad, 2010). By performing cross-equalization the goal is to minimize the difference between the surveys.
To quantify the success of the cross-equalization process for every wave mode, two quality controls were used to monitor the effectiveness of every operator applied to the data: (1) Quantitative measurements of the normalized Root Mean Square (NRMS) taken after every step, and (2) A visual comparison after every step of the difference between the baseline volume and the cross-equalized volume. The cross-equalized volumes were used to perform model based seismic inversion to obtain Zp and ZS11 volumes.
Model- Based Inversion
The difficulty detecting Morrow Sandstone due to its low impedance contrast has caused several companies to investigate the use of multicomponent data over Morrow reservoirs (Robinson, 2010). The hypothesis at Postle Field is that fluid changes in the reservoir affect the P-wave and S-wave velocities, the density and bulk modulus of the rocks. Inversion is necessary to improve Figure 5. Left: History match of total water production rate in the black oil model for the base and improved simulation models. Right: History match of total oil production rate in the black oil model for the base and improved simulation models. (Modified from Heris, 2011) 38 CSEG RECORDER May 2012 the detectability of the reservoir in the study area, where the Morrow A sandstone is under seismic tuning thickness. In this study, acoustic impedance and shear impedance inversion are used to monitor pressure and saturation changes associated with the fluid injection and production in the reservoir. The algorithm used to invert the data was model-based and Hampson-Russell’s STRATA application was used to run the inversion algorithm.
As mentioned in Herawati (2002) and Robinson (2010), the inversion method has advantages in effectively reducing tuning in the data and increasing the bandwidth. Tuning is reduced by removing the wavelet, and the bandwidth is increased by including low frequency information. The theory behind the algorithm is described in detail in Russell (1988).Model-based inversion was chosen because the range of impedance changes, especially for S-wave is expected to be small in magnitude. Using the same initial model and wavelet to begin the inversion of the volumes provides consistency on the process and helps to avoid the introduction of artifacts not related to production/injection. Seismic inversion for acoustic and shear impedance were performed over the previously cross-equalized volumes.
Time-lapse and integrated interpretation
The objective of this study is to find if there are measurable timelapse changes associated with the CO2 WAG EOR project at Postle Field and compare them with the time lapse changes calculated with the simulation work performed by Heris (2011). The goal is the quantitative integration of time-lapse seismic data interpretation and reservoir simulation to verify and interpret the seismic anomalies
Integration of time-lapse seismic data and flow simulation is very important in a dynamic reservoir characterization process. It is an iterative process in which the seismic data helps to improve the quality of the reservoir model, and flow simulation results provide for a better interpretation of time-lapse seismic anomalies. Both, acoustic and shear impedance changes were compared with the corresponding results from the simulation. In general, the results obtained with both methods are similar in magnitude but the position and areal extent of anomalies are not completely juxtaposed. This difference, in areal extent, is to be expected as both technologies can benefit from an integrated effort to reconcile the data and to reduce uncertainty
A sensitivity analysis was performed by Heris, 2011. His work is relevant to the interpretation of the seismic time-lapse and it is summarized here:
- Acoustic Impedance is affected by pressure and fluid saturation changes: (1) Regardless of pressure, a maximum decrease of 2% in acoustic impedance for an increase in CO2 mole fraction from 0 to 1. (2)A change of 4500 PSI in pressure with respect to the initial reservoir pressure will cause a change of approximately 10% in acoustic impedance. However, in Postle Field the changes between the surveys are approximately 1000 PSIA, which means a maximum change of 1.5%. (3) An increase in water saturation from 0.3 to 0.85 will cause an increase of 2% in acoustic impedance.
- Shear-Impedance is mainly affected by pressure changes. The changes in fluid saturation have a very small effect. It wasfound that: (1) An increase in CO2 mole fraction from 0 to 1 will cause a maximum decrease of S-Impedance of 1%, regardless of pressure. (2) A change of 4500 PSIA, in pressure with respect to the initial reservoir pressure, will cause a chance of approximately 14% in shear impedance. However, in Postle Field, the pressure changes between the surveys are approximately 1000 PSIA, which means a maximum change in shear impedance of 2%. (3) An increase in water saturation tends to decrease the shear impedance, but the magnitude is less than 1%.
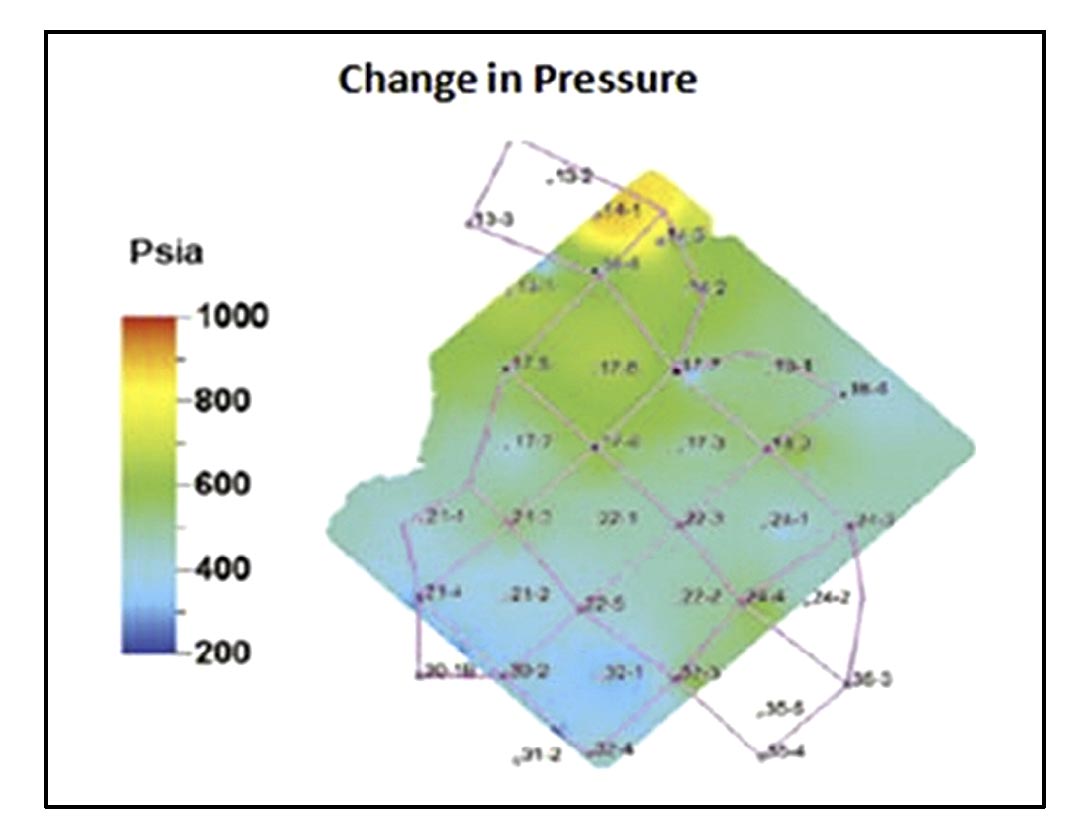
The simulation results of the changes between baseline and 1st monitor surveys for CO2 mole fraction, pressure, water saturation and gas saturation are shown in Figure 6. The changes in CO2 mole concentration mainly occur around the injectors with some preferential flow in some patterns (Figure 6(a)). Pressure has increased between these surveys with a maximum change of +800 psia occurring in the part of the study area (Figure 6 (b)). The increase in water saturation, observed around some injector wells in the southern area, is due to water injection in the WAG process (Figure 6.5(c)). The secondary liquid phase is observed in the form of gas saturation increase in the reservoir around the injector wells, which corresponds to the lighter components of the fluid composition rich in CO2 (Figure 6.5(d)). These parameters are the dynamic fluid flow properties of the reservoir which affect the seismic response (Heris, 2011).
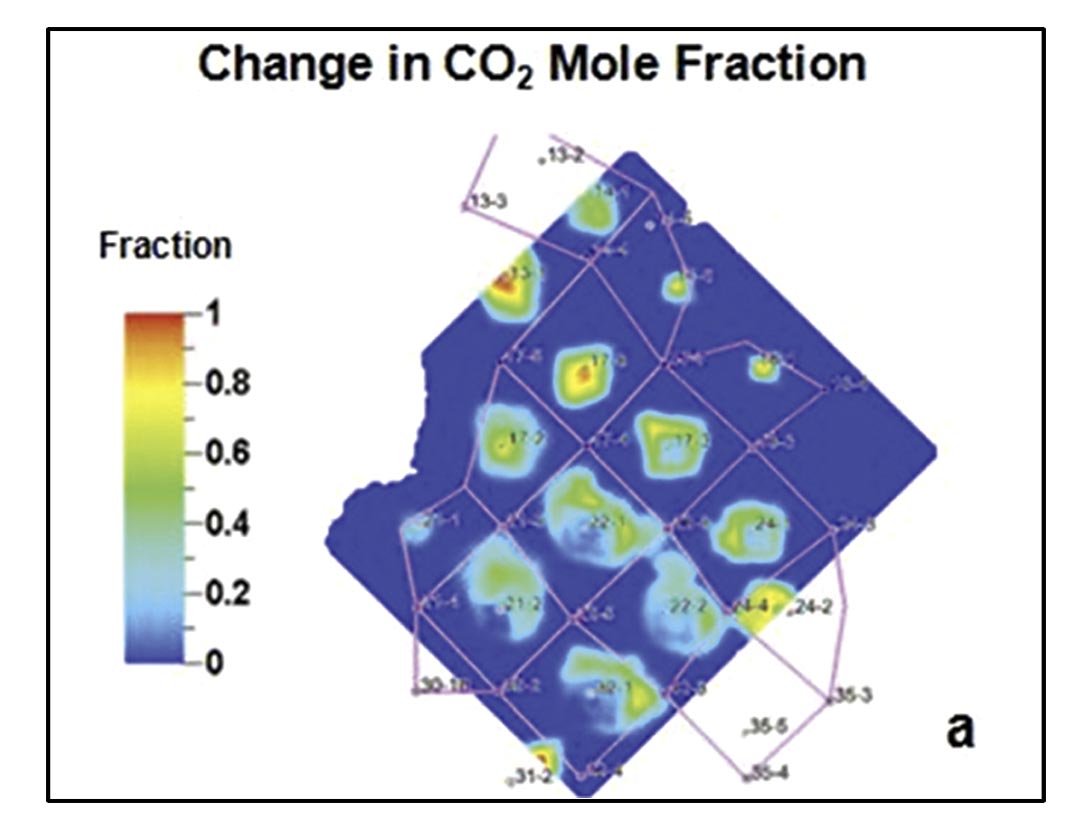
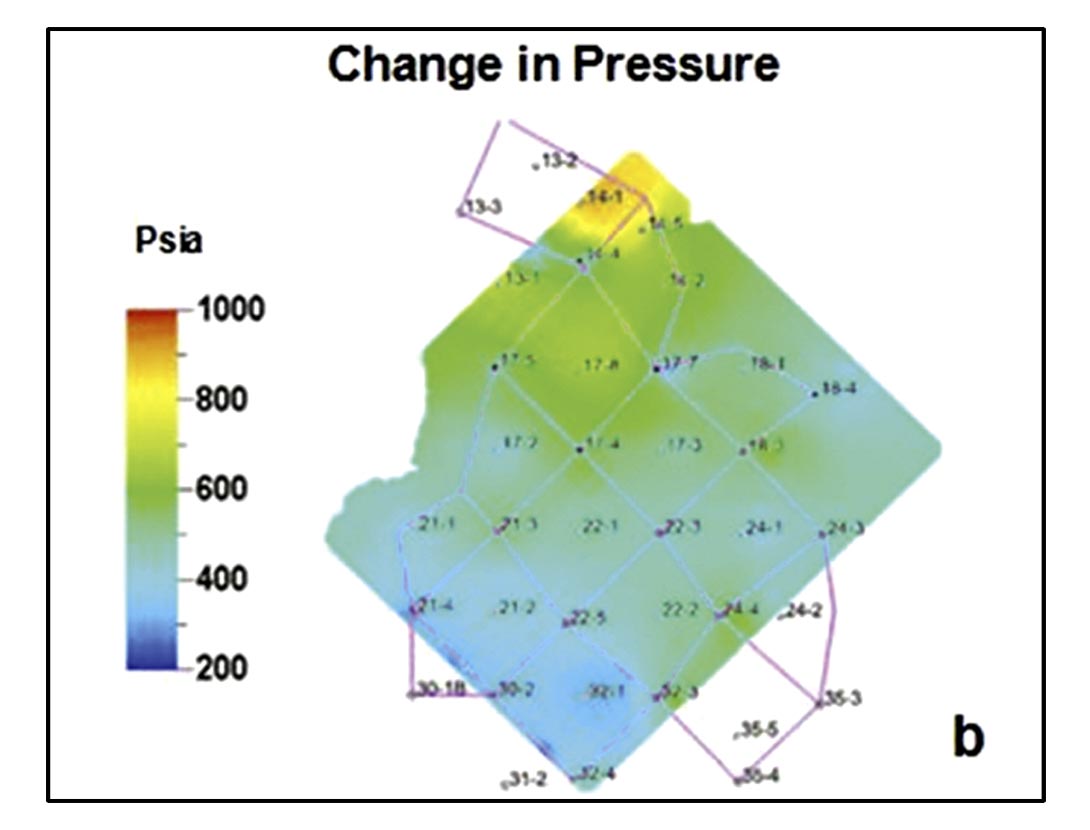
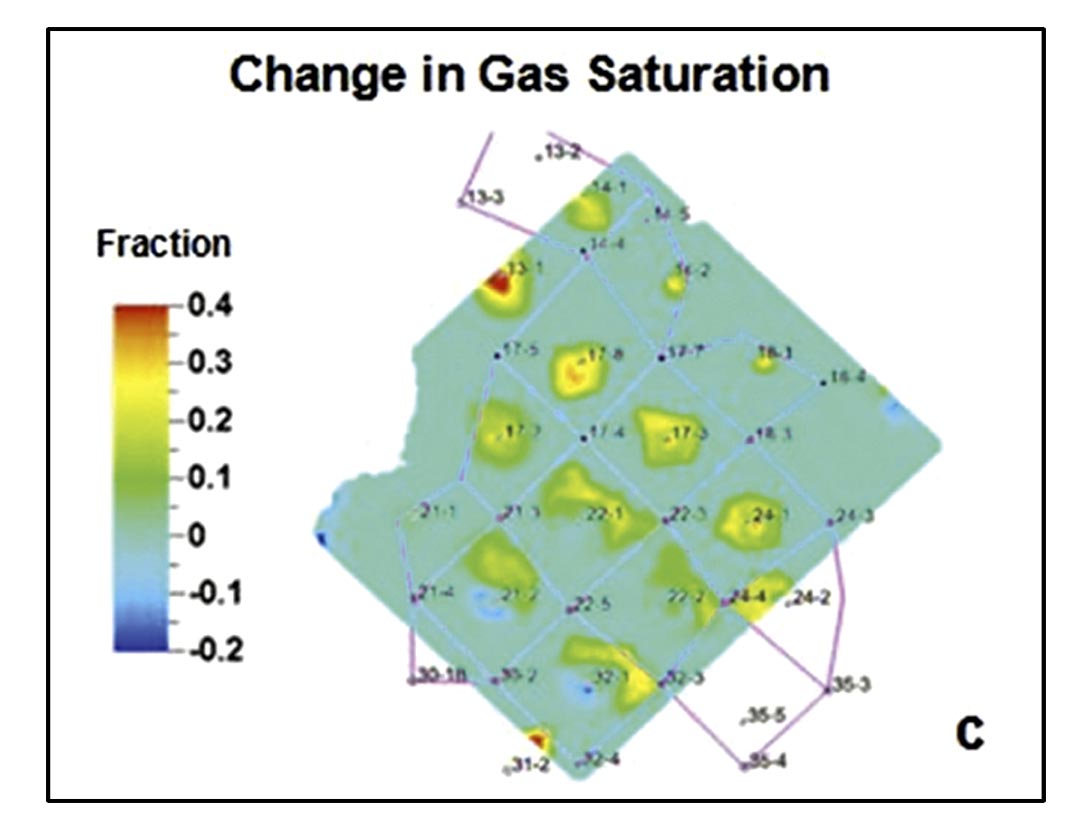
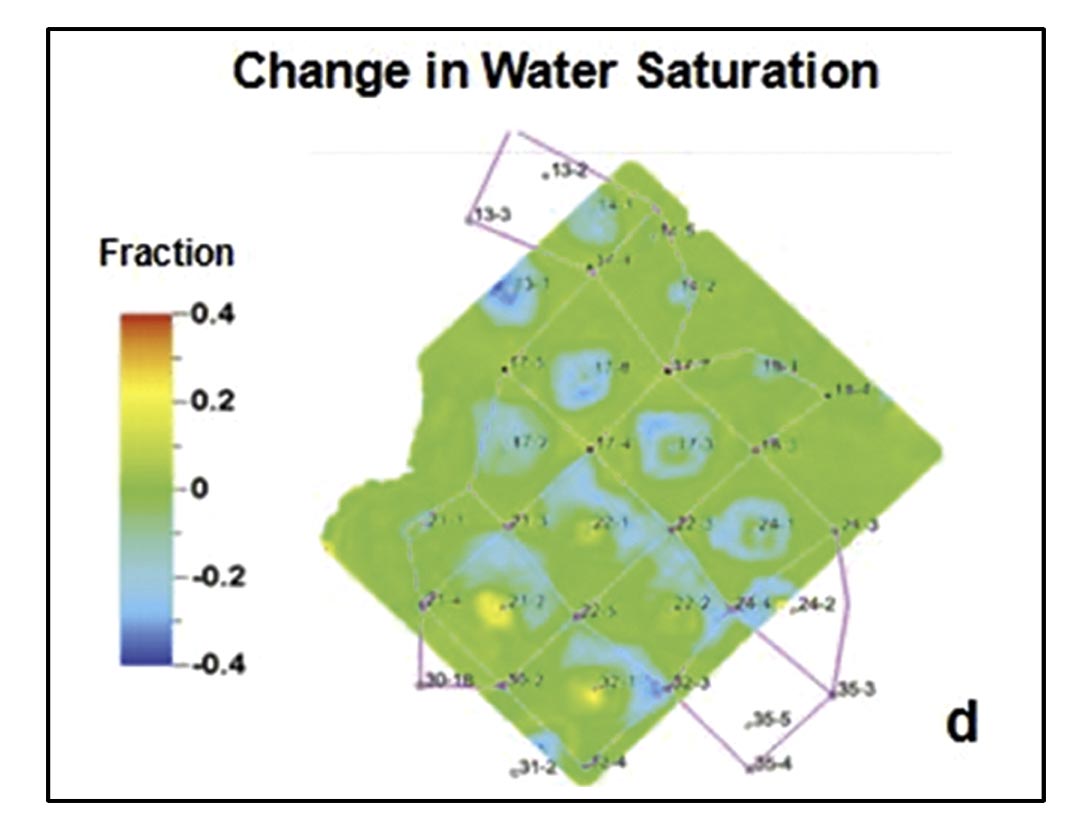
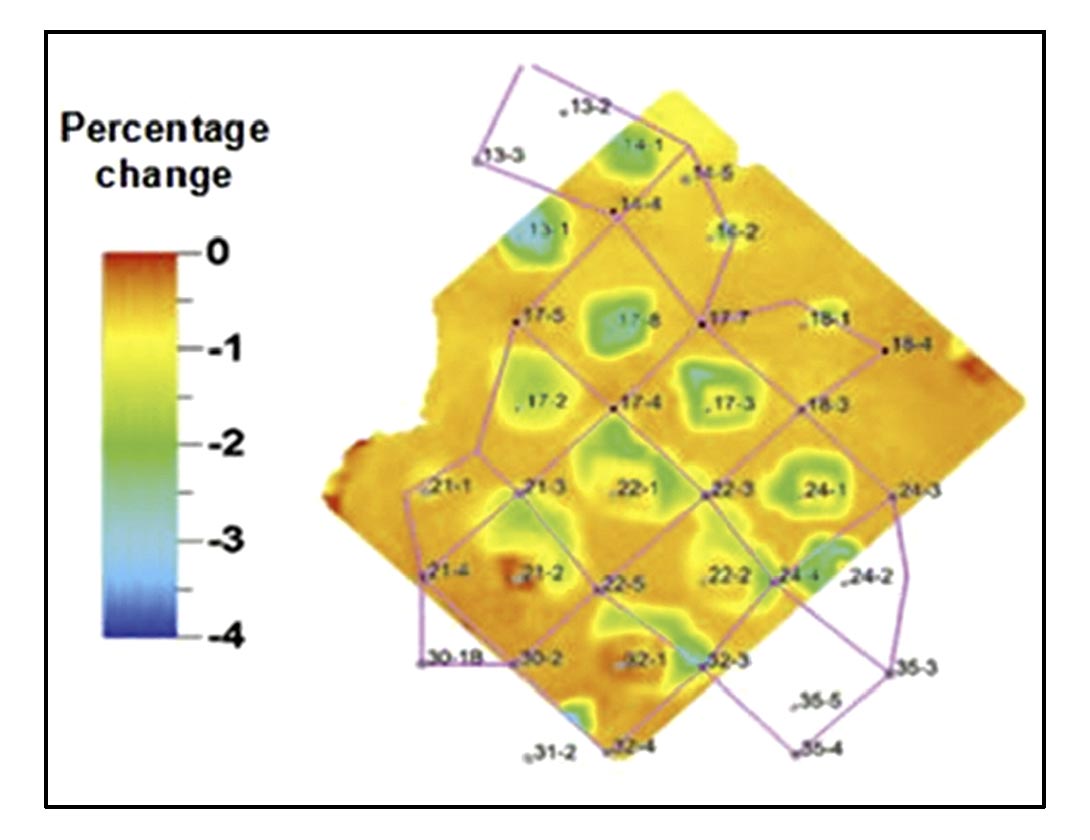
Figure 7 shows a comparison of the acoustic impedance difference calculated with simulation and seismic between 1st monitor and baseline. The magnitudes of the difference from the seismic are comparable to the simulation. P-wave changes are caused for both fluid substitution and pressure changes. It is difficult to discriminate the areas or patterns where one effect is greater than the other. Seismic inversion shows a connection between the wells 17-6 and 17-2 while simulation shows two separate anomalies around the wells. Also, for the wells 24-1 and 17-3 there is a connection shown in the seismic, while the simulation shows different anomalies. The results suggest that the changes in the reservoir are caused by changes in the reservoir conditions. Injection of CO2 will cause a decrease in acoustic impedance due to both the presence of a highly compressible fluid replacing existing fluids (water and/or oil) and an increase in pressure. A small magnitude decrease in acoustic impedance is detected at the Morrow A sandstone interval as expected.
The effect of fluid saturation on shear impedance is not as significant as its effect in acoustic impedance, but pressure changes have greater impact on shear impedance by affecting the shear modulus of the rock. An increase in pressure will cause a decrease in shear impedance and a decrease in pressure will cause an increase in shear impedance. Figure 8 shows a comparison between pressure changes and negative shear impedance difference between the 1st monitor and baseline surveys. There is correlation between both maps. When pressure increases, shear impedance tends to decrease. Sensitivity analysis calculated a maximum of 2% decrease in shear impedance due to the increase in pressure. The changes are small, but we were able to monitor these small pressure changes by using multicomponent seismic data, especially pure shear wave data. However, the shear wave are sensitive to the fold of the seismic. Some considerations need to be taken into account when interpreting areas close to the edges.
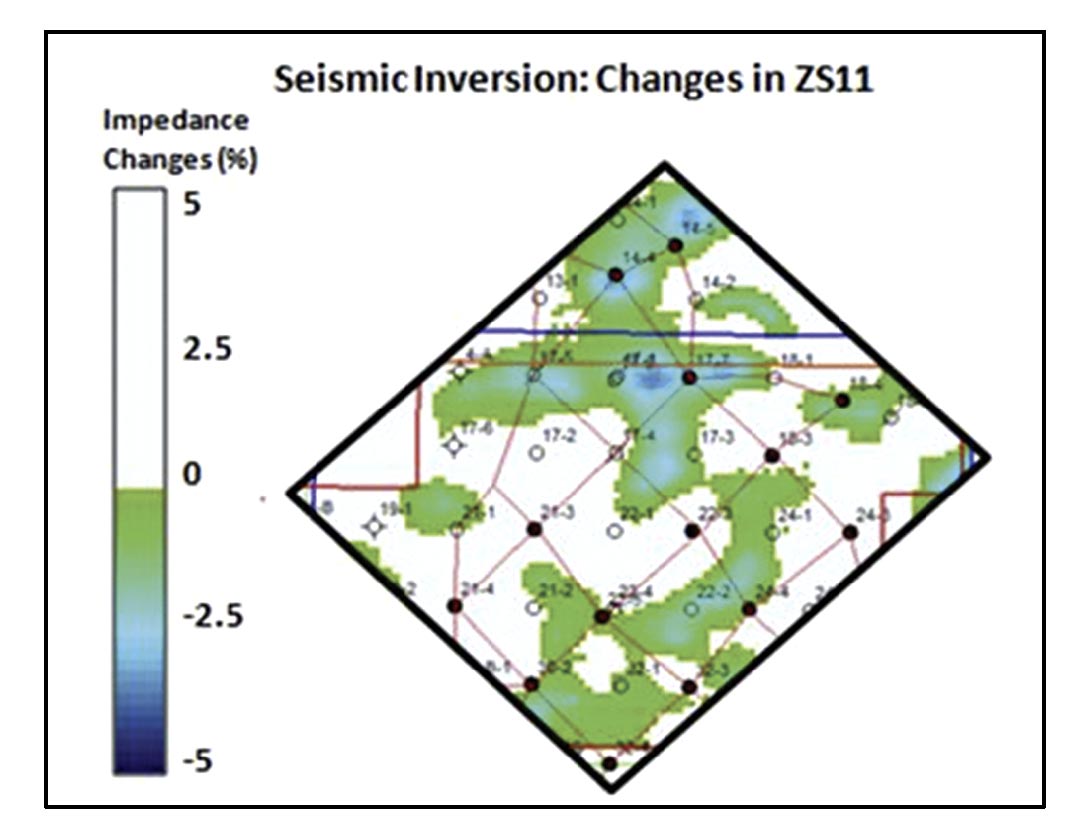
By comparing the seismic inversion maps for both P-wave and Swave 1st monitor to baseline (Figure 1-b and Figure 2-b), a northsouth trend can be identify between the wells 14-1, 14-4 and 17-4. The direction of this trend matches the current depositional model of the region area with north-south oriented channels. As seen in Figure 6(a), the changes in CO2 mole fraction between the surveys are very small, meaning that this anomaly is caused mainly by changes in pressure rather than changes in fluid substitution. Pwave is affected by both pressure and fluid substitution changes while S-wave is only affected by pressure changes. The anomaly is smaller in the P-wave than in the S-wave indicating the viability of S-wave data to monitor the small pressure changes in the field.
As seen in Figure 7(b) (acoustic impedance changes), there is an anomaly that connects wells 17-3, 18-3 and 24-1. That anomaly does not exist in the shear impedance changes (Figure 8(b)). Also, the pressure changes map shows that there was not a big change in pressure between the surveys. This means that the anomaly in the P-wave is caused mainly by changes in fluid substitution. Figure 6(a) shows that there was a change in the mole fraction from simulation between the surveys.
Conclusions
Acquisition of 4-D, 9-C data at Postle Field illustrated for the first time the use of multicomponent seismic data to monitor production related changes in the Morrow A sandstone reservoir under WAG injection for tertiary recovery. This project demonstrates the benefits of time-lapse acoustic and shear impedance inversion for Morrow sandstone enhanced oil recovery monitoring. Despite the difficulties and challenges in Postle, this study shows the value of multicomponent seismic data for dynamic characterization. It is possible to establish a meaningful correlation between the seismic (P and S-wave) and the simulation model. The results of this study show that observed P-wave seismic inversion changes are caused by a combined effect of fluid saturation and pressure changes, while S-wave impedance changes are caused mainly by pressure changes. The S-wave data are a valuable component for seismic monitoring especially of carbon dioxide WAG injection schemes.
Recommendations
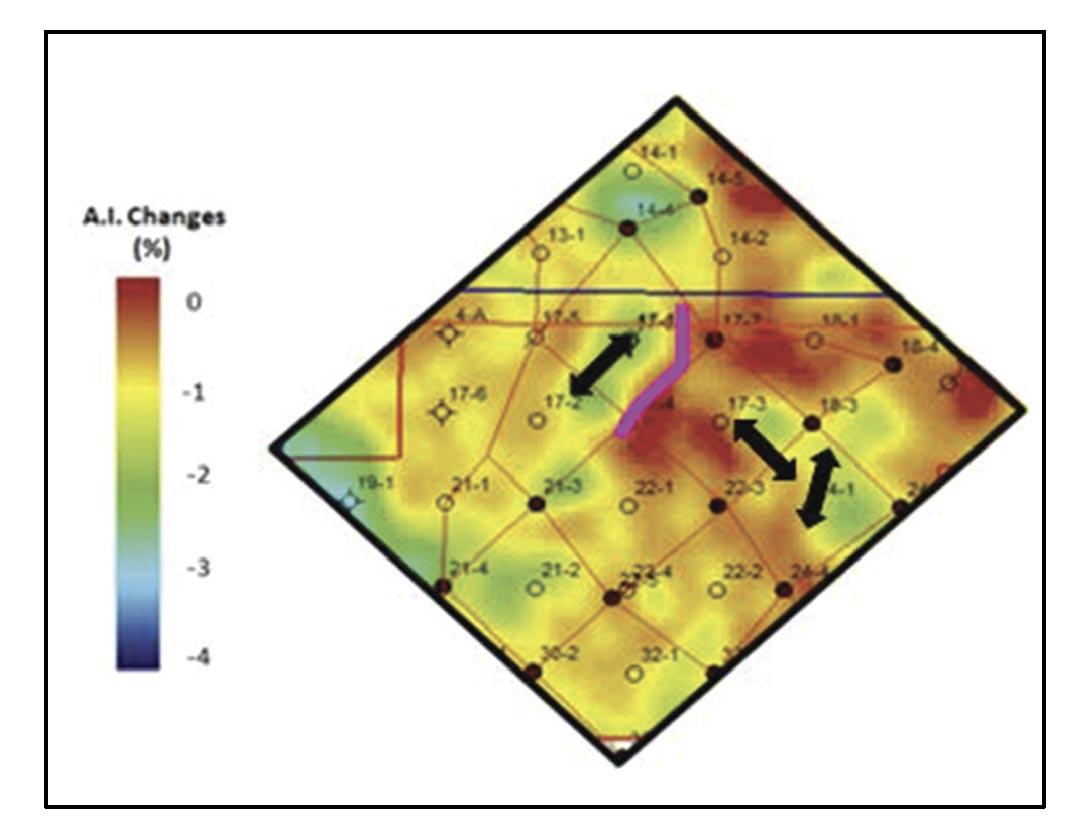
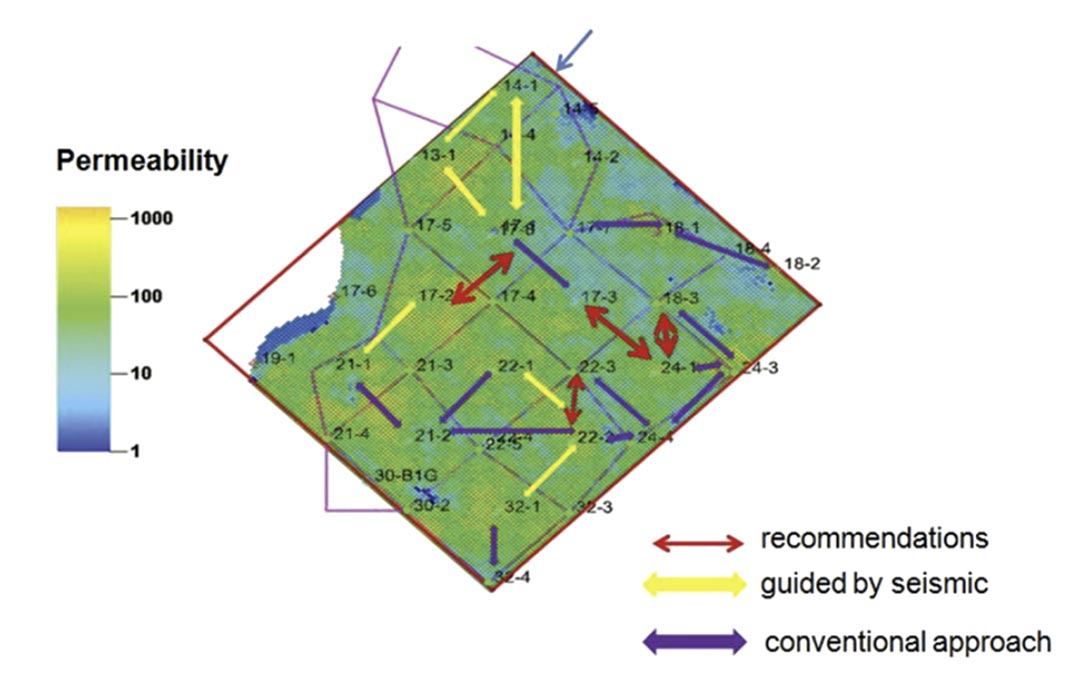
Changes in the permeability model derived by Heris (2011) can be made with the help of the seismic data. By using the seismic impedance change maps, connectivity between some patterns can be established resulting in an improvement in the history matching. In Figure 9, the red arrows show the recommended changes to the permeability model from seismic interpretation to improve the history matching.

Acknowledgements
The authors would like to thank the Reservoir Characterization Project Sponsors and students for their support. Special thanks to Rafael Pinto for providing the pseudo-logs used to perform the inversion and to Ayyoub Heris for sharing his modeling results. Thanks to Whiting Petroleum for enabling us to conduct this work in their field and for financial assistance in the multicomponent data acquisition. We are grateful to Fairfield Industries for processing the data.
Related Reading


Join the Conversation
Interested in starting, or contributing to a conversation about an article or issue of the RECORDER? Join our CSEG LinkedIn Group.
Share This Article