Abstract
A 3D seismic data set was acquired near Alder Flats, Alberta, to image several coal zones of the Ardley Coals. Deterministic inversion of the data shows a band-limited acoustic impedance result that over estimates the very low impedance of the coals as well as overestimating the thickness of the coal zones. Additionally, the thin sub-zones of the Ardley Coals are not differentiated in the inversion. A geostatistical inversion is conducted in an attempt to improve the inversion resolution and assess model uncertainty. The inversion provides multiple model realizations each of which honors the seismic data, the well data and the geostatistics. The mean of the realizations gives a highly resolved estimate of the acoustic impedance. As well, the multiple model realizations provide a range of acoustic impedance and net coal-thickness estimates that can be used to quantify uncertainty in the results. However, while the inversion appears to be accurate at the level of the shallow-most coals, at the deeper coal subzones a thin but significant sub-zone is not detected in the inversion, even when the inversion is constrained by the well data. This phenomena is possibly explained by the results of synthetic modelling that investigates the effects of short-path multiple reflections. The modelling shows that the effect of short-path multiple reflections, built up in the seismic pulse from the stacked coal sub-zones, could cause a phase delay in the reflected energy of the deepest coals and which would explain the results of the inversion.
Introduction
A 3D vertical component seismic survey was conducted at the Alder Flats location in June 2007. Details of the acquisition design, processing, deterministic inversion via several methods and final interpretation are discussed in McCrank and Lawton (2009) and McCrank (2008). This paper investigates a geostatistical inversion of the data using the Fugro Jason – Jason Geoscience Workbench (JGW) StatMod algorithm. Discussion of the method can be found in Torres-Verdin et al. (1999) and van der Laan and Pendrel (2001).
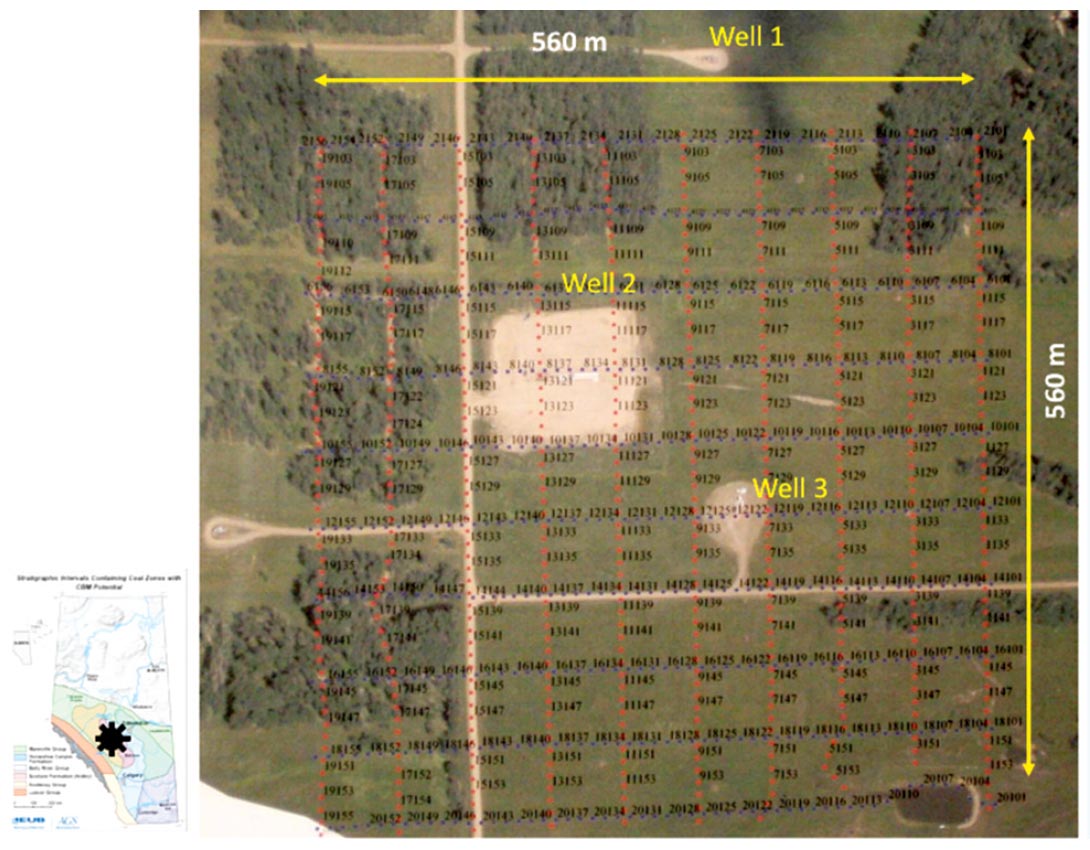
The 3D field layout (Figure 1) was a square of approximately 560 x 560 m. The survey was intended to image the stratigraphy of the Ardley Coal Zone which is illustrated in the well correlation cross-section shown in Figure 2. The Ardley Coal Zone is informally broken into the Upper and Lower Ardley coal zones. The Upper Ardley is an approximately 10 m gross thickness coal zone and the Lower Ardley coal zone is represented by two thinner zones, the Silkstone coals and the deeper Mynheer coals that have gross coal thicknesses of approximately 4 m and 8 m, respectively.
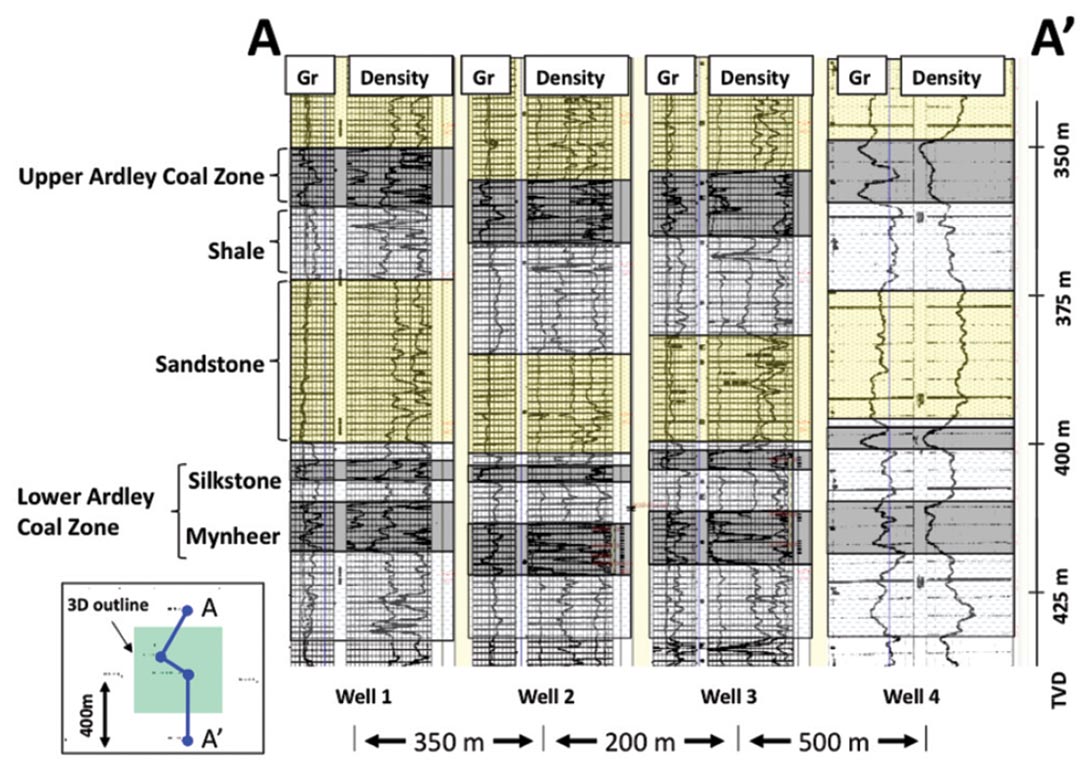
Well #2 (Figure 1 and Figure 2) is inside the survey bounds and has high quality sonic and density logs that were used for wavelet extraction and petrophysical analysis (discussed below). Well #3, although within the survey bounds, had a poor quality density log and no sonic log that was not used in the analysis.
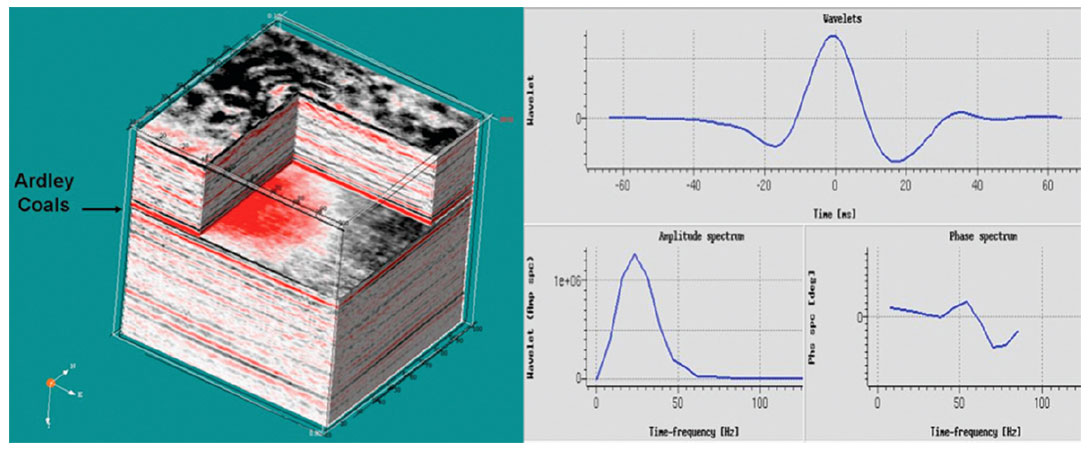
The 3D volume of seismic data (Figure 3a) contained a wavelet (Figure 3b) that was significantly tuned in the thin but highly reflective beds of the various coal zones.
The results from deterministic Zp inversion
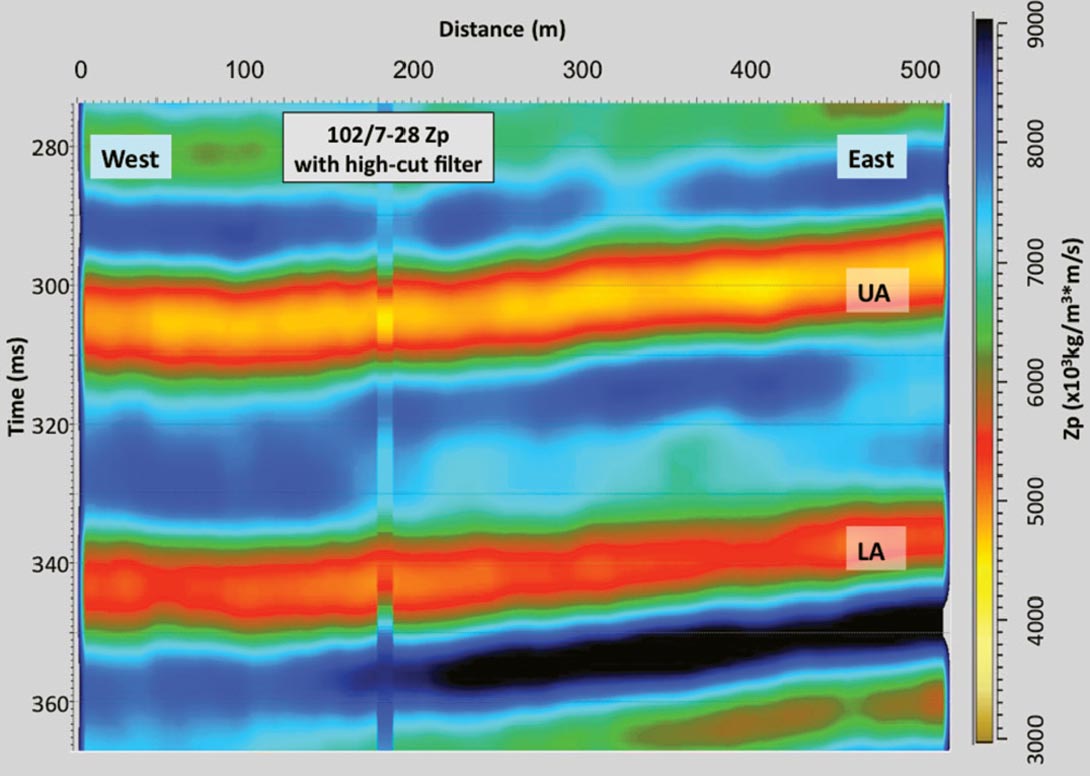
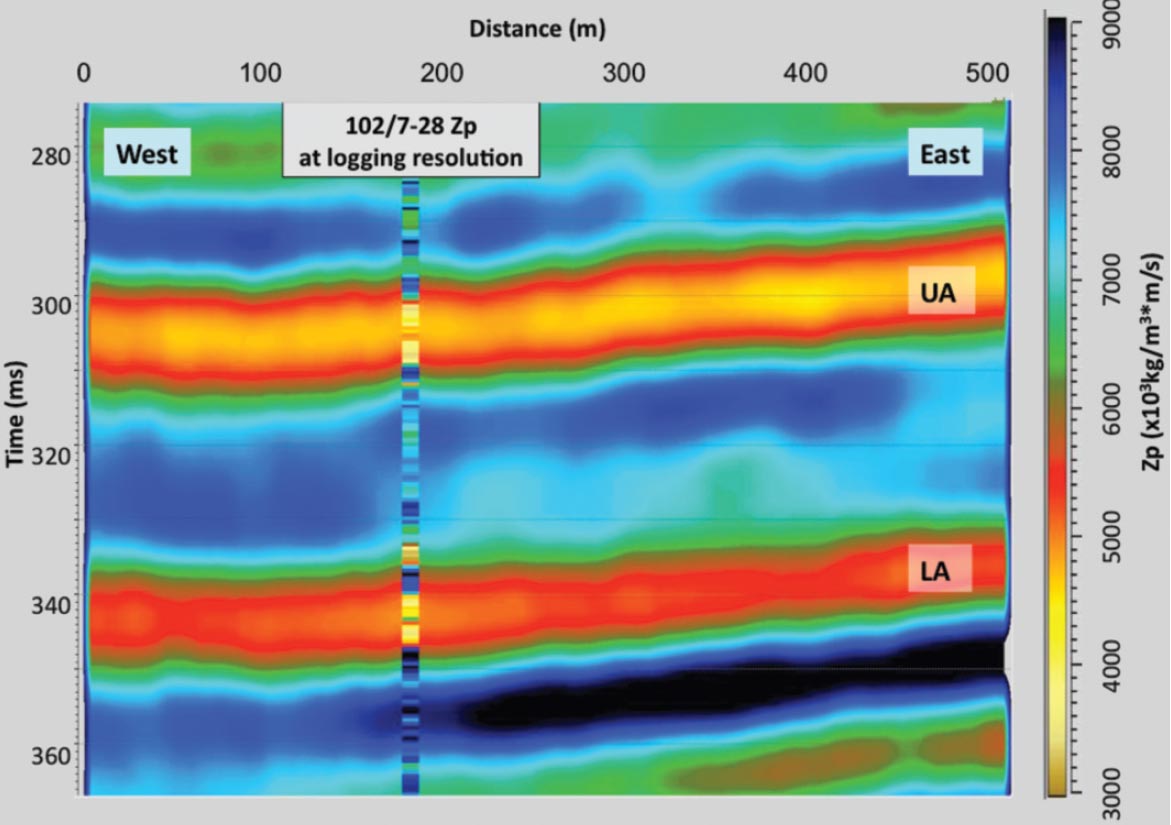
After carefully extracting a wavelet, the post-stack seismic data were deterministically inverted to estimate acoustic impedance. Figure 4 shows a cross-section of the inverted Zp volume. This west-east section that intersects the Well #2 shown in Figure 4 will be the section shown in all subsequent cross-section figures in this paper.
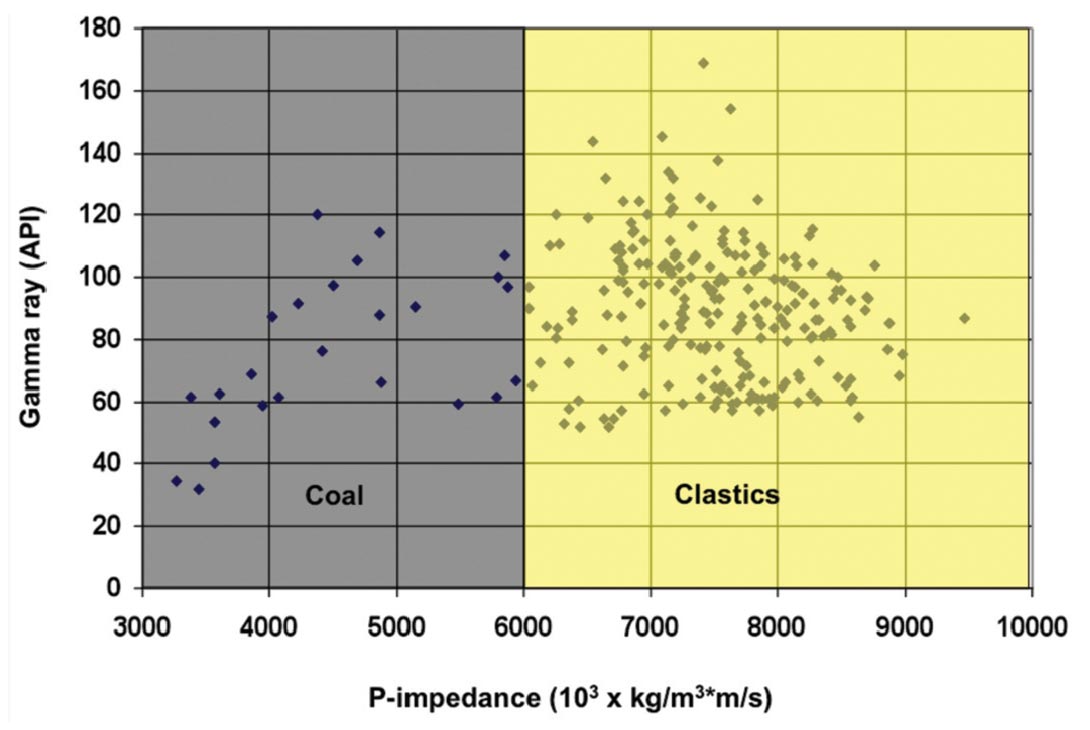
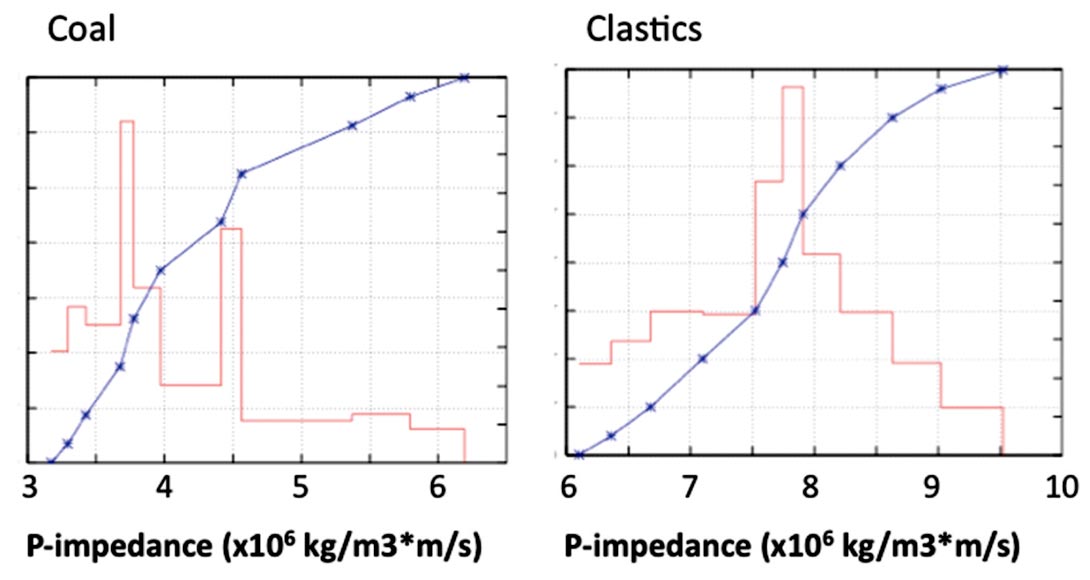
Figure 5 shows a cross-plot of Zp versus gamma ray response in the well logs from Well #2. Coals can be identified with an upper limit Zp of 6x10⁶ kg/m3*m/s and the lithologies with higher Zp are defined as "clastics" (representing shales, siltstones and sandstones). The data for the cross-plot are generated at "logging" resolution as recorded in the field (resolution of approximately 15 cm to 1 m).
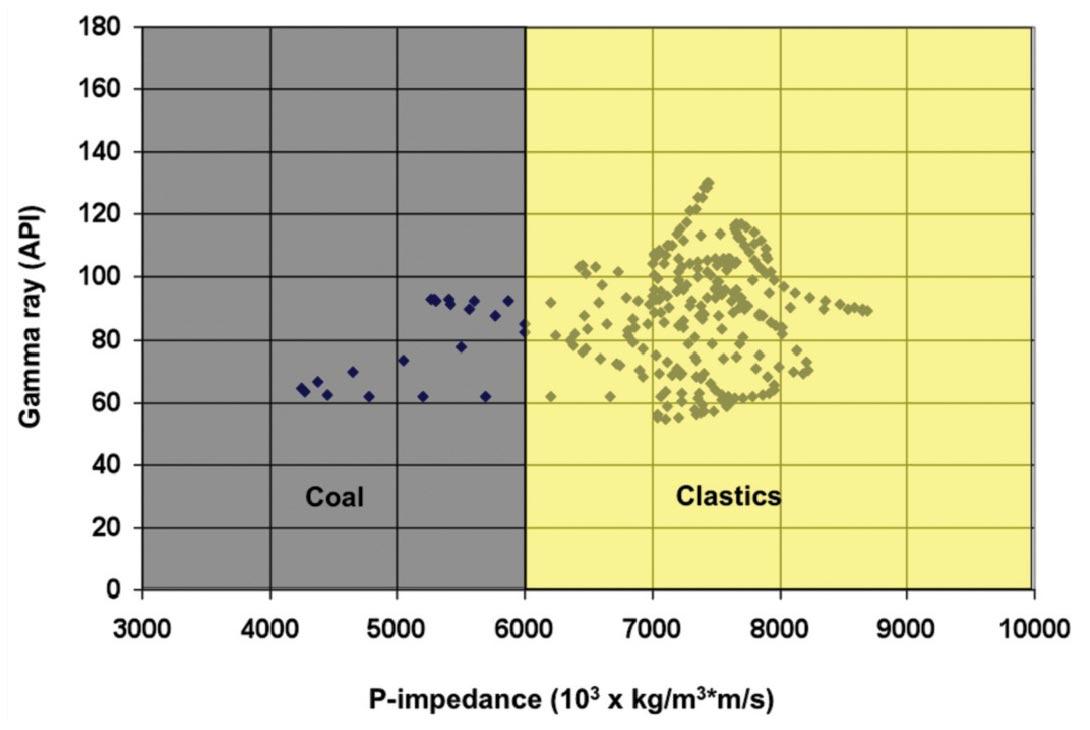
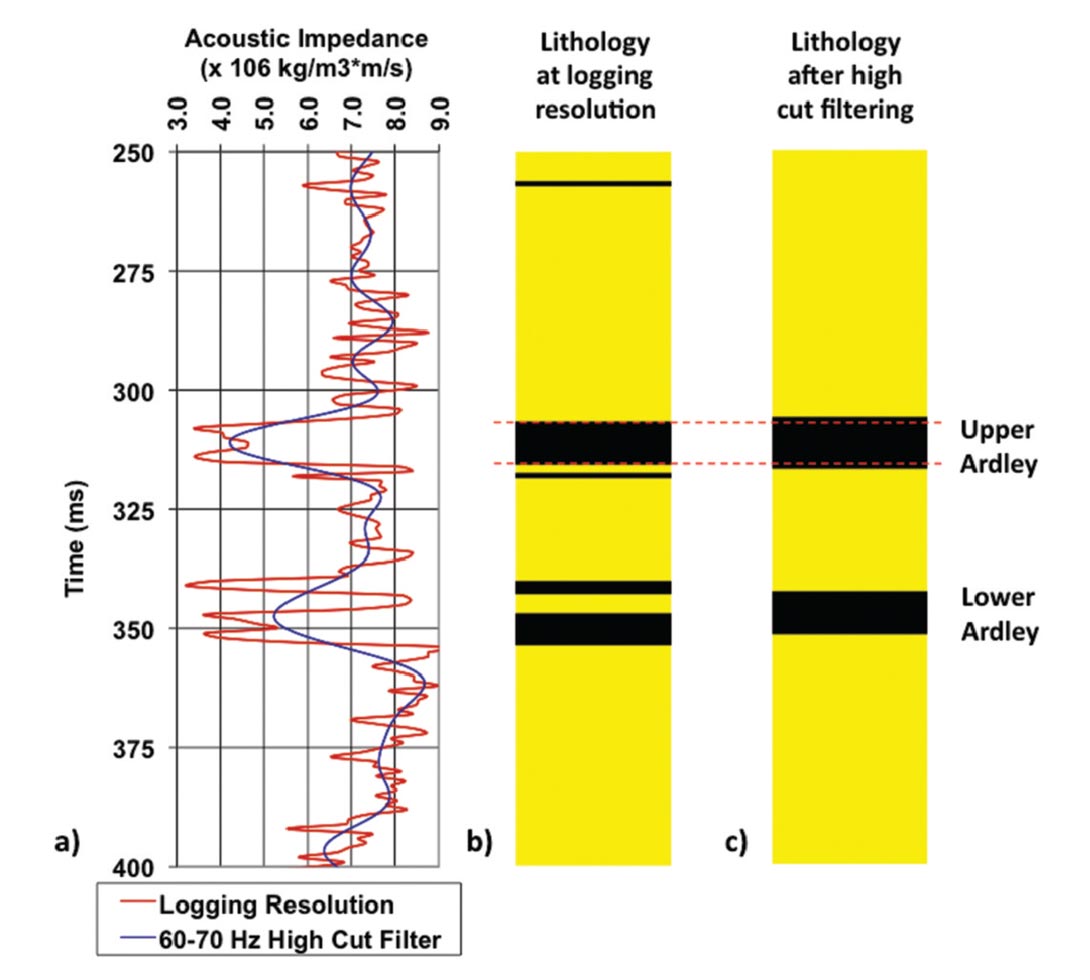
It is known that the Zp estimate from seismic inversion will have lower band-width and less resolution than the well logs, so the cross-plot is revisited in Figure 6 where the well log data have been logged in time (1 ms sampling) and high-cut filtered at 60- 70 Hz. The lithology cut-offs are unchanged, but the resolution is diminished. The net effect can be seen in the Zp logs and the lithology logs of Figure 7. The Zp log shows that the vertical detail is reduced after high-cut filtering and that the extreme amplitudes of the low Zp coals are smoothed and increased when high cut filtered. The lithology logs resulting from these two Zp curves are also shown in Figure 7. It can be seen that the thin coal sub-zones in each of the Lower Ardley coal zones are "smeared" into one coal zone when the lithology is established based on the high-cut filtered Zp log. Also, the net thicknesses of the zones in the high-cut filtered lithology log are incorrect.
The need for geostatistcal inversion
Deterministic seismic inversions yield a result that has the maximum likelihood of being correct given the seismic data alone. However, because the Zp estimate inverted from the seismic data is band-limited in approximately the same way that the well log data just discussed, the results will suffer from the same shortcomings. Specifically:
1. The absolute values of the Zp estimate will be higher than the actual very low Zp values of coal facies.
2. The thickness of the coal zones will not be accurate because at the frequency resolution of the seismic data, the low impedance of several coal zones will be smeared together and result in an "average" low Zp inversion zone with an overestimated thickness.
These limitations are illustrated in Figure 8 that shows the Zp log of Well #2 at "logging" resolution superimposed on the deterministic Zp inversion result. It is obvious that the inversion result is not capturing the detail available in the well log.
3. Interpretation becomes difficult because there are multiple models that could result in the same seismic response. Therefore, interpretations are not unique and the uncertainty of any interpretation can not be gauged.
While none of these issues can be solved using deterministic means as there are an infinite number of models that could produce the measured data, it can not be said that each of the infinite possibilities is equally probable. The well data at high resolution can also constrain the inversion.
While the log data is known to be accurate at the well location, it provides no accuracy away from the well. However, geostatistics can provide probabilistic constraints away from the well. Geostatistical methods can not provide a unique model of the subsurface away from hard data points, but can provide probabilistic models or multiple possible realizations (i.e. from methods such as sequential Gaussian simulation). Thus geostatistical inversion proposes to solve for a set of models each of which are constrained by the available seismic data, the well data and the known geostatistics of the study area. Non-uniqueness is not eliminated but the range of possibilities and their probabilities can be estimated.
Geostatistical inversion
The JGW StatMod MCTM algorithm uses the wavelet that was used in the deterministic inversion. The algorithm uses a Markov Chain Monte Carlo method to sample from the complex probabilistic density function that results from the product of the probabilities generated from the given seismic data, the well data and the geostatistical probabilities. The result of the inversion is a set of high resolution model realizations each of which match the seismic and the geostatistical constraints that are input to the inversion. The results are a representative sampling of the Bayesian posteriori probabilistic density function.
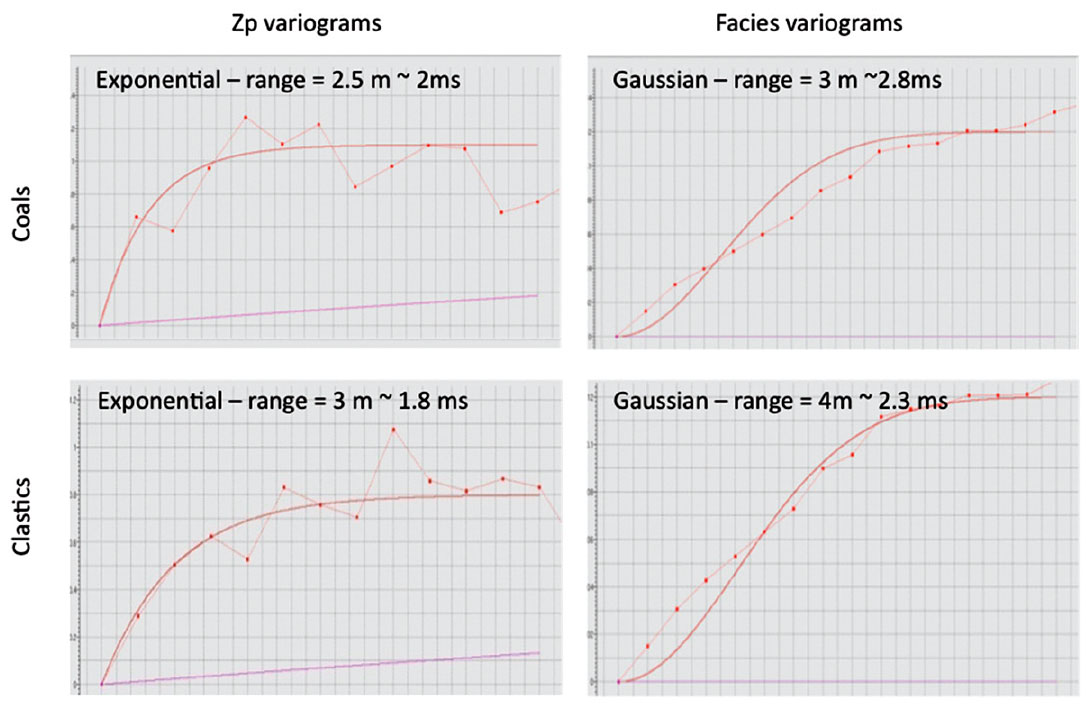
Histograms of the Zp values for each of the two facies (coal and clastics) were generated from the well logs (Figure 9). Also, the vertical variograms for the facies and Zp values were modeled using the well data (Figure 10). The Zp variance was modelled by an exponential variogram and the facies variance was modelled as a Gaussian variogram. The range of all vertical variograms was approximately 2 ms.
A lack of lateral data made it impossible to empirically model the lateral variograms, so the range and model were estimated by running the inversion repeatedly until the results matched an intuitive belief about the variation of the facies and the Zp values given the regional geology and demonstration cross-sections such as that shown in Figure 2. It was found that when the lateral facies variance was again modelled with a Gaussian variogram and the Zp variance modelled with an exponential variogram, the results were robust as long as the range was set between 200 – 800 m. For the final inversion the range was set to 400 m.
Inversion unconstrainted by the well
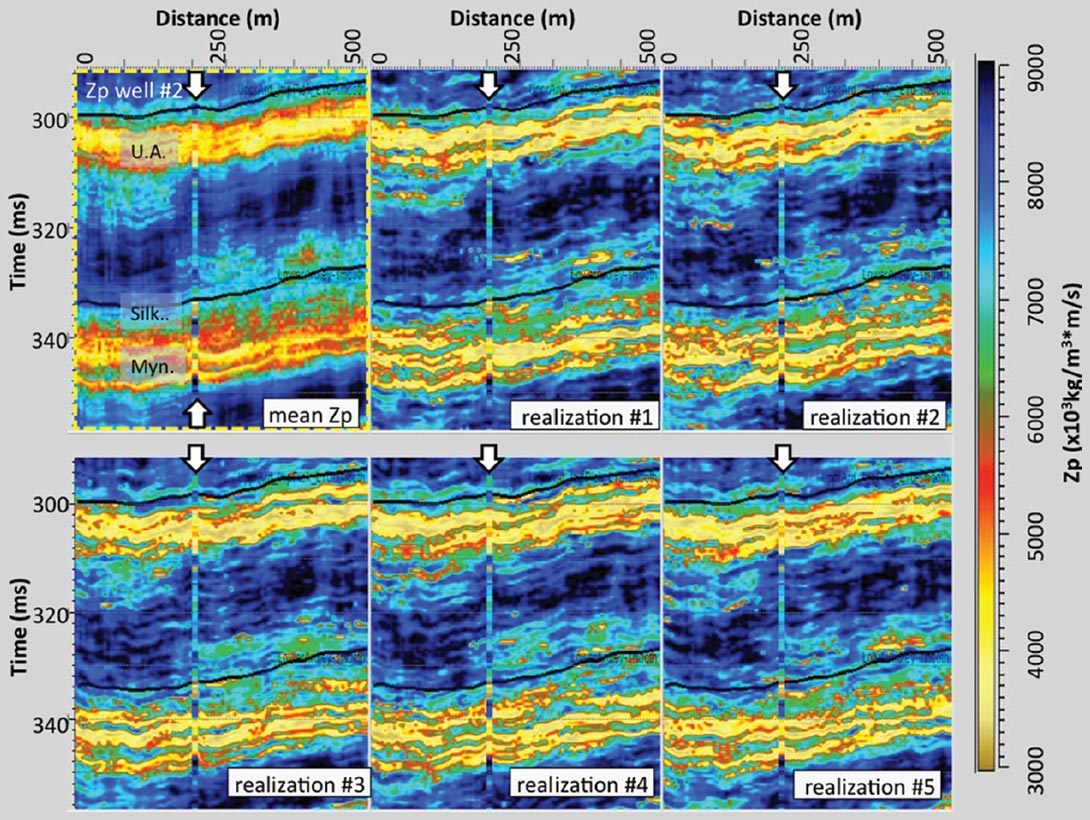
The inversion can be run with or without the Zp well log used as a constraint. Initially, the inversion was conducted without well constraint in order to understand how much detail was being provided by the seismic data and the geostatistics alone. The inversion was run to find 10 model realizations. Figure 11 shows cross-sections of the resulting Zp estimates. The panel on the upper left is the average Zp estimate after generating 10 model realizations from the Markov Chain Monte Carlo algorithm. Five of these ten realizations (selected arbitrarily) are illustrated in the other five panels of Figure 11. Superimposed on each of the panels is the Zp well log from Well #2 that has not been filtered and is displayed at "logging" resolution. The inversion results show that the level of detail in the Zp estimates is comparable to the well log resolutions. Also, the absolute Zp values of the inversion are comparable to the absolute Zp values of the unfiltered well log.
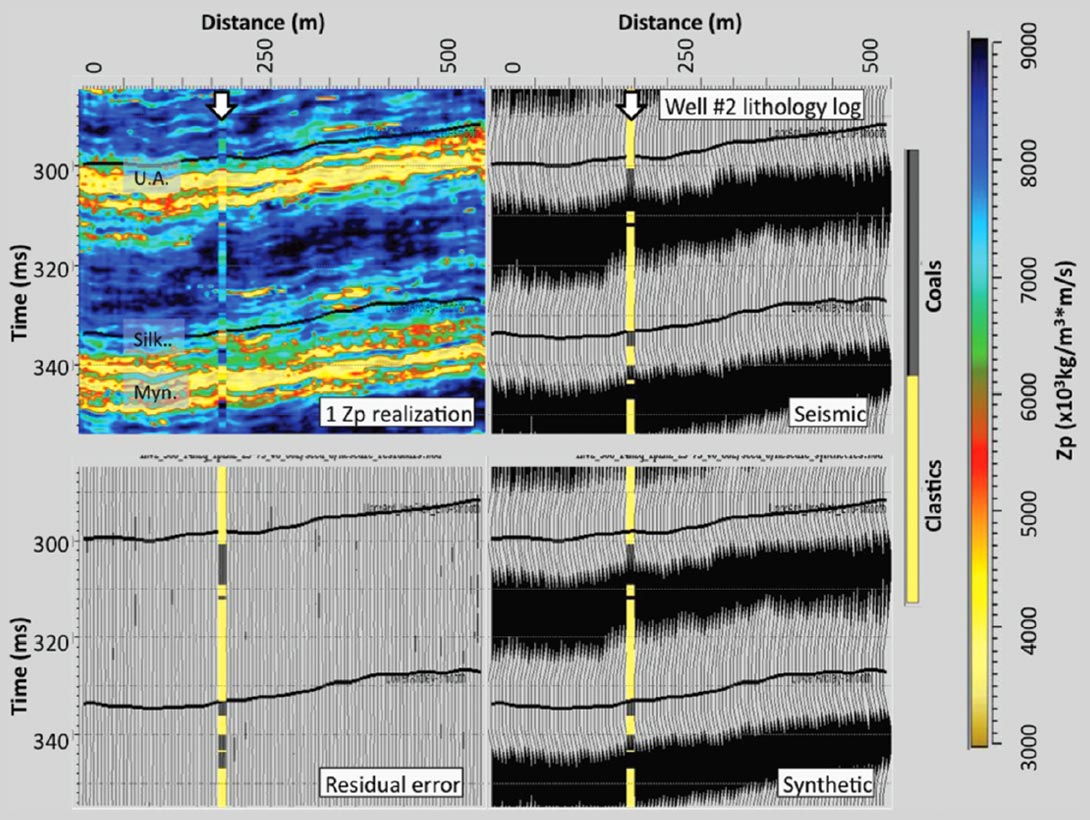
Each of the 10 realizations should be viewed as possible model solution to the inversion. Figure 12 illustrates the residual difference between the seismic data and the synthetic seismogram generated from one of the 10 model realizations. The figure shows that the residual difference is very small. Each of the 10 realizations shows an equally minimal residual meaning that each is an inversion that is compatible with the seismic data.
The most likely facies estimate is shown in the panel on the upper left of Figure 13, and the other five panels show the facies associated with the five realizations from Figure 11. The figure shows that the statistical form of the coal zones appears to be modelled in each realization. Each of the individual realizations shows very small coal occurrences in locations that are outside of the expected coal zones, however, when these realizations are averaged to produce the most probable facies, coals are predicted in the known zones only. In the most probable facies panel, continuous but distinct thin coal zones are resolved. However, while the Upper Ardley coal zone appears to be accurately resolved, the Lower Ardley coal zone is not. In the Lower Ardley coal zone, the most probable facies results appear to show two sub-zones but these are together delayed in time and the Silkstone coal zone is not resolved at all.
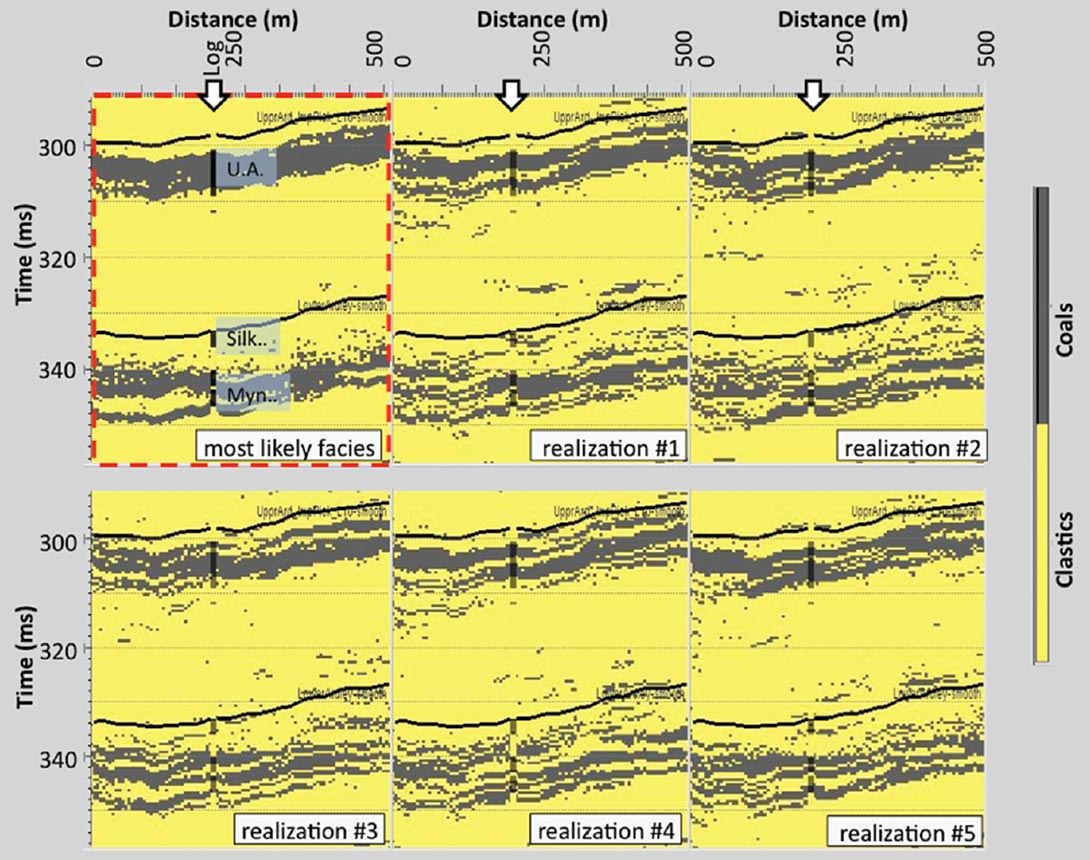
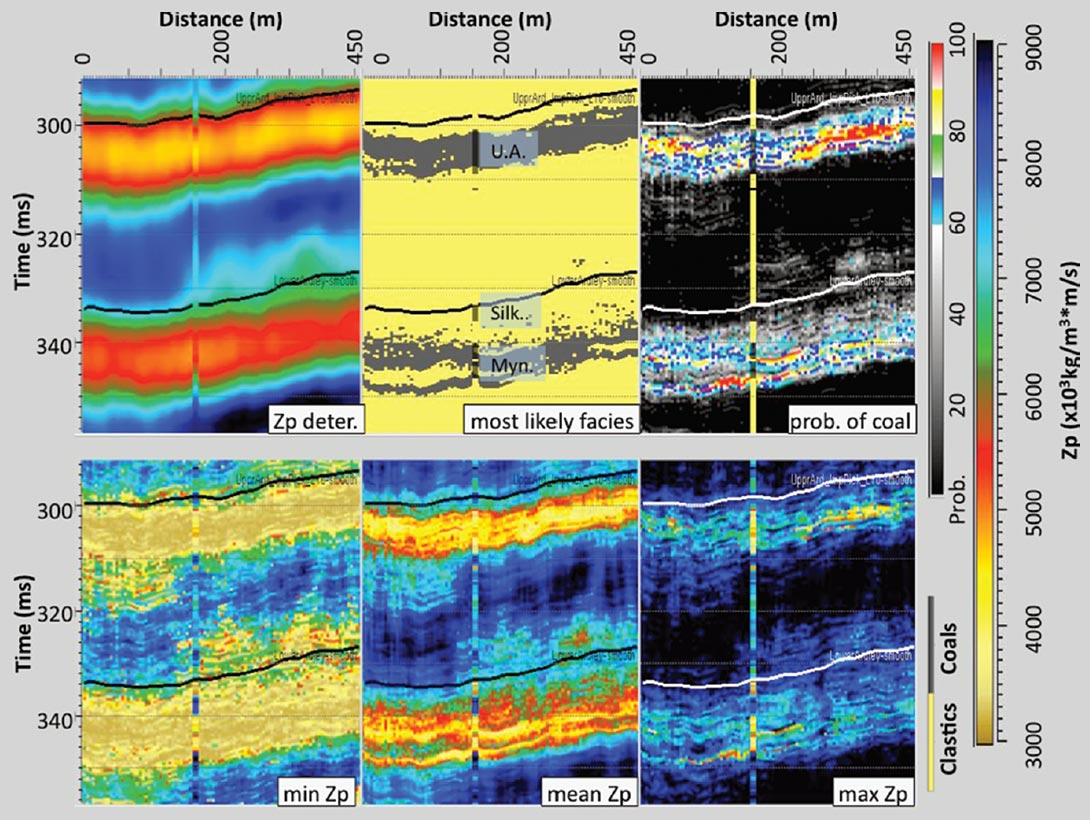
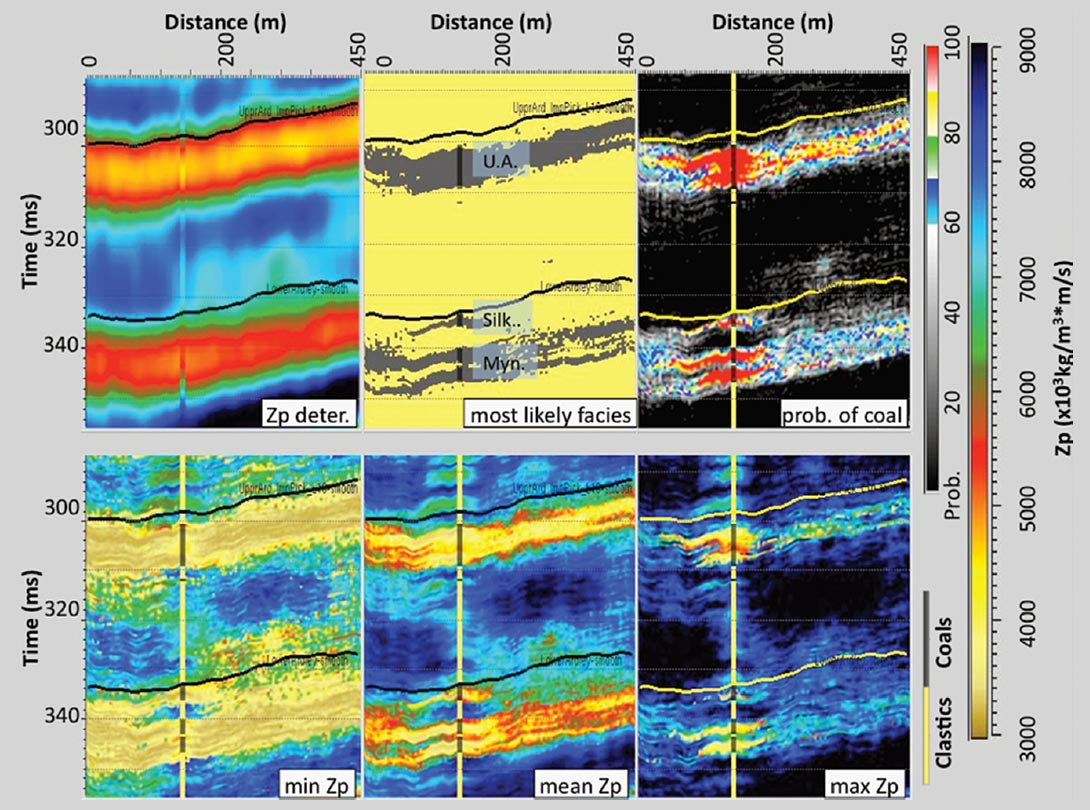
Figure 14 summarizes the results of the unconstrained inversion. It shows the deterministic inversion results (for comparison) as well as the most probable facies, the likelihood of coal facies, and the minimum, mean and maximum Zp from the set of model realizations. The probability of coal is high in each of the coal zones and this data can be used to give a quantitative understanding of the likelihood of encountering different gross thicknesses of coal. Again the results are robust for the Upper Ardley coal zone but indicate greater uncertainty in the Lower Ardley coal zone. The data seems to suggest that the existence of the Silkstone coal zone is improbable, since there is a very low probability of coal facies at that level.
The Inversion constrainted by the well
The inversion was then run with the Zp values and the facies log of Well #2 included as a constraint on the geostatistical realizations. Again, the inversion found 10 possible model realizations that are each constrained by the well data, the geostatistics and the seismic data. Figure 15 shows the residual difference between the seismic data and the synthetic seismogram created from one of the realizations. It shows that the residual is again very small. It is noteworthy that the Silkstone coal zone is a part of the model solution at least at and near the Well #2 location.
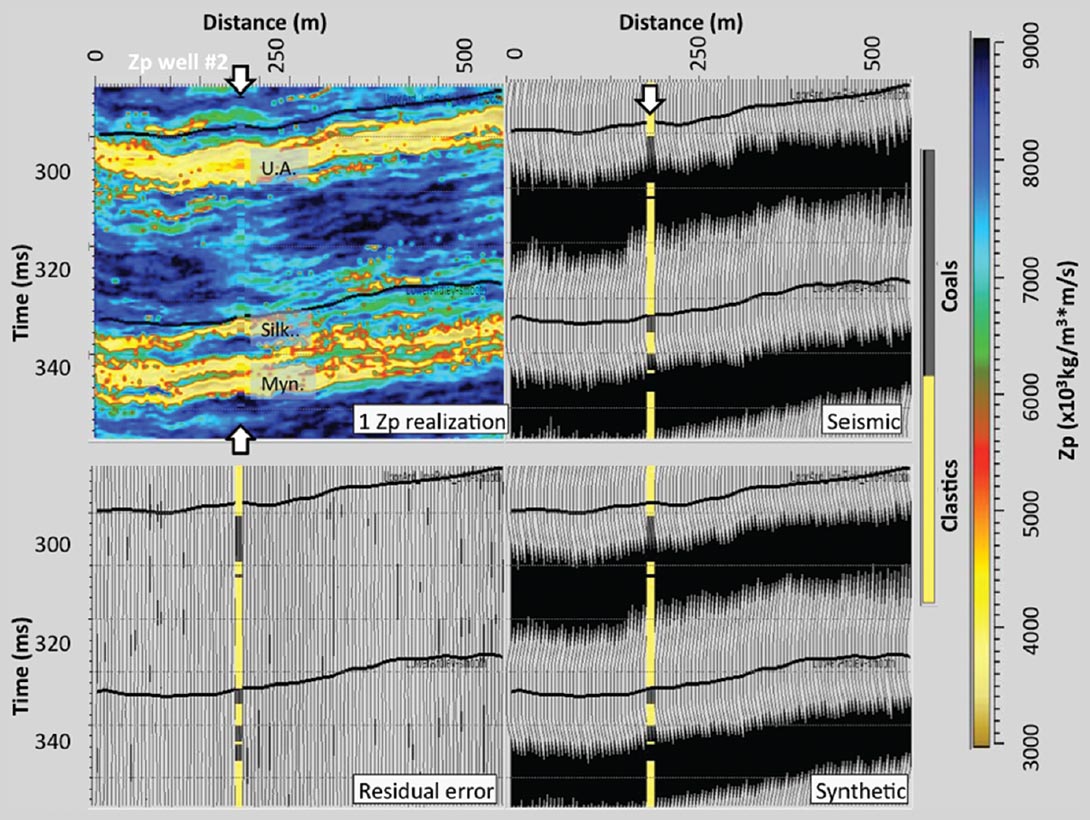
Figure 16 shows nine of the ten realizations along with the facies log from Well #2. As in the unconstrained results, the absolute Zp values of the inversion match those of the well log with coal zones showing Zp values as low as 3.0x10⁶ kg/m3*m/s. Each of the realizations shows evidence of the Silkstone coal zone at or near the Well #2 location, but in each realization the low Zp zone of these coals disappears away from the well.
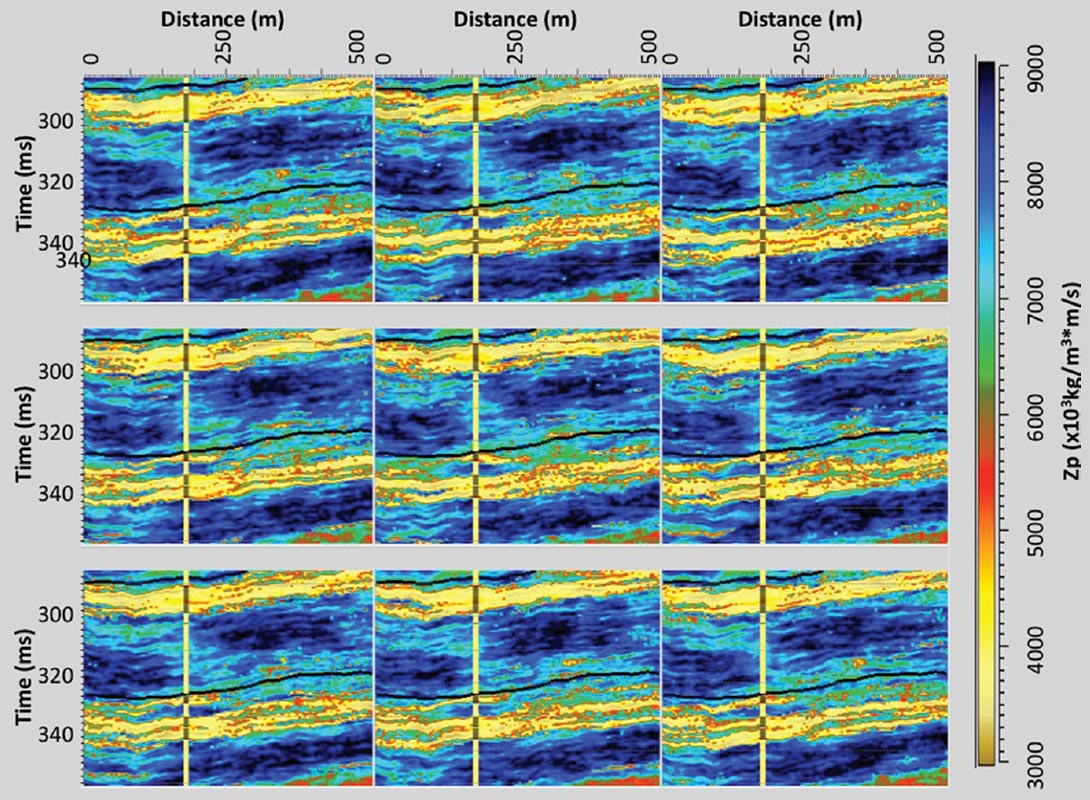
Figure 17 shows the mean Zp estimate of the 10 realizations and Figure 18 shows the associated most probable facies generated from the inversion with well constraint. Again, the expected continuity and thickness of the coal zones is produced.
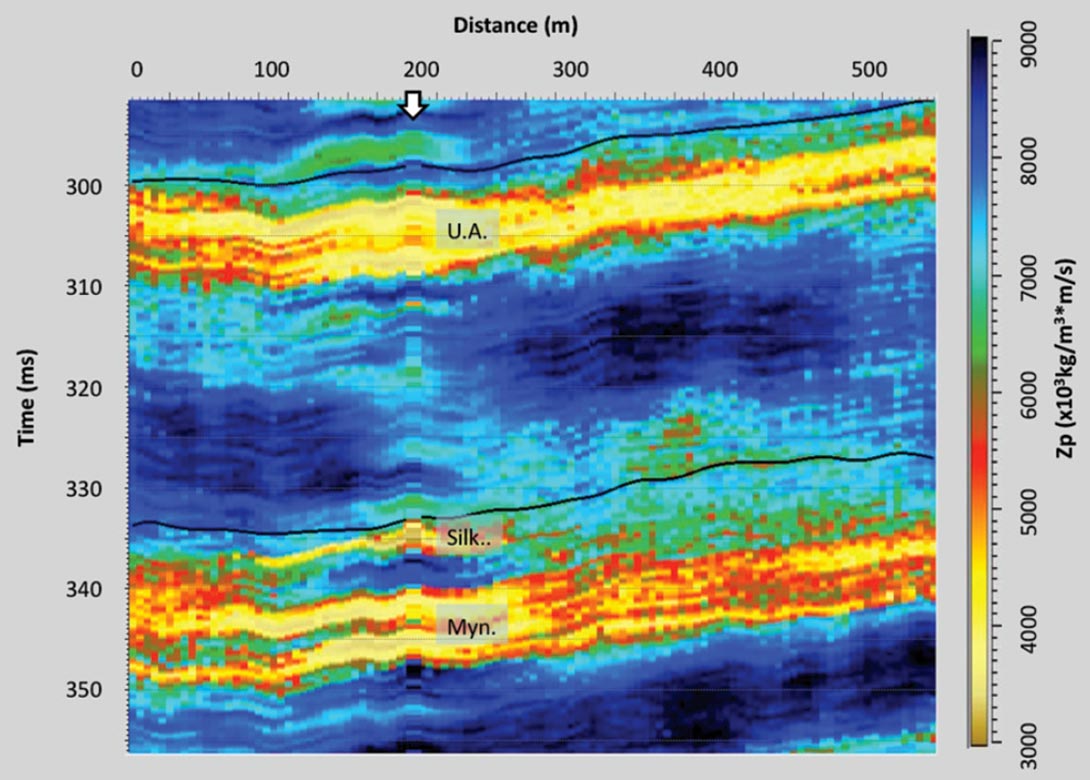
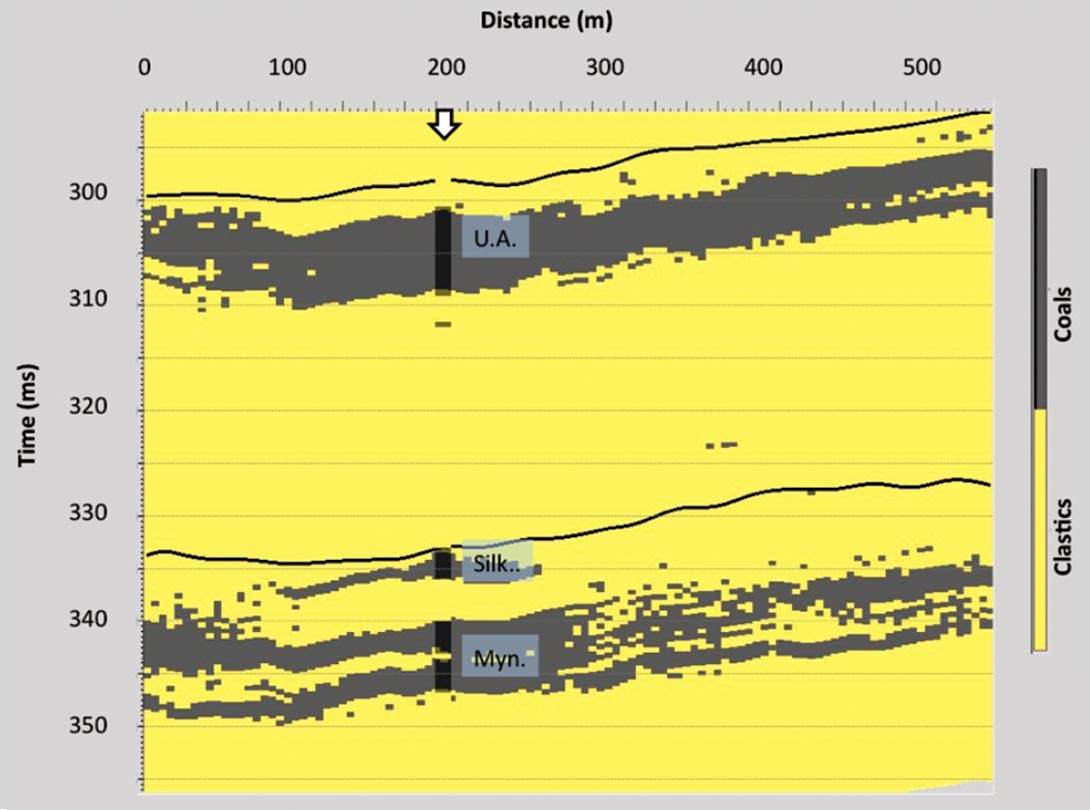
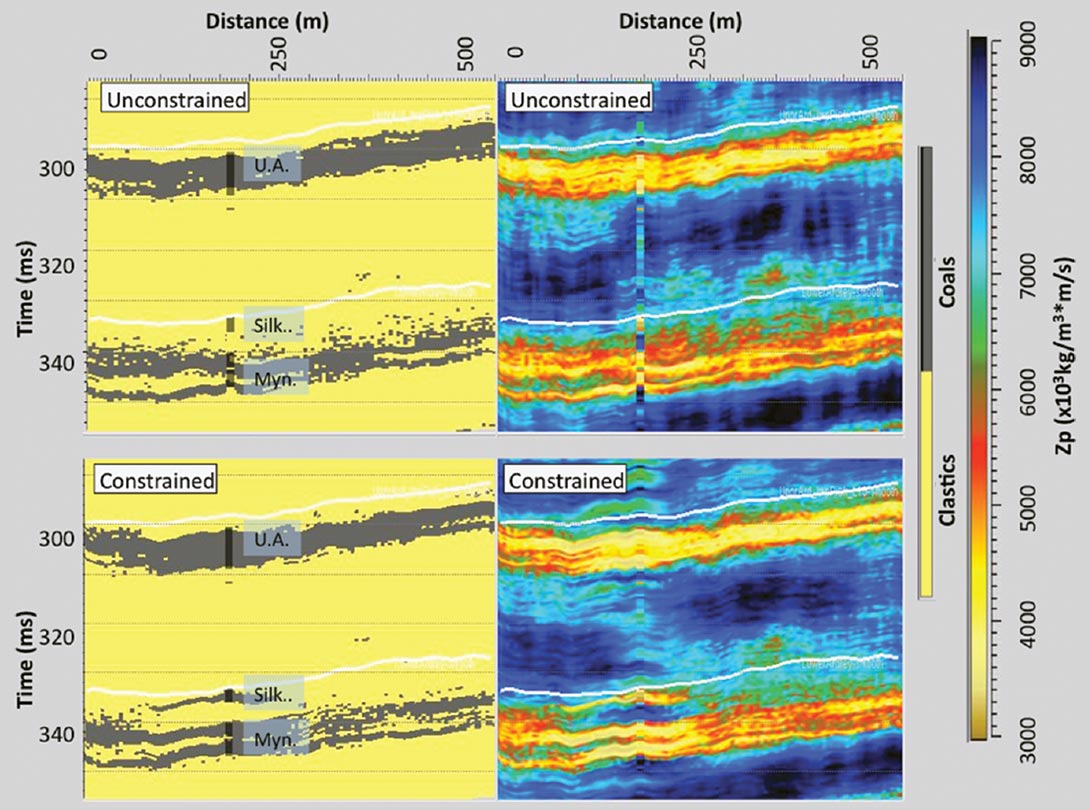
Figure 19 shows a summary of the constrained inversion results. The panel in the upper right illustrates the probability of coal facies existence and shows that the probability of coal is highest closest to the well location and Figure 20 illustrates the comparison of the mean Zp and most probable facies results for the constrained and unconstrained inversions. The figure shows that the constrained inversion clearly honors the well data where the unconstrained results do not. However, both are comparable in terms of the coal zone thicknesses and lateral continuity.
The Upper Ardley coal zone is well characterized in the constrained inversion; however, the Lower Ardley coal zone character is more problematic. While the Silkstone coal zone is predicted at and near the Well #2, it disappears within 50 – 100 m away from the well. Thus it appears that the seismic data is overriding the likely geostatistical prediction at a distance of less than a quarter of the lateral variogram range (400 m). The likely explanations for this are there is a fundamental flaw with the seismic trace waveform, the wavelet may not be accurate or the time-to-depth table for the well log may be incorrect. However, given that the inversion works very well for the Upper Ardley coal zone, it may be that the problem is localized to the seismic event of the Lower Ardley coals.
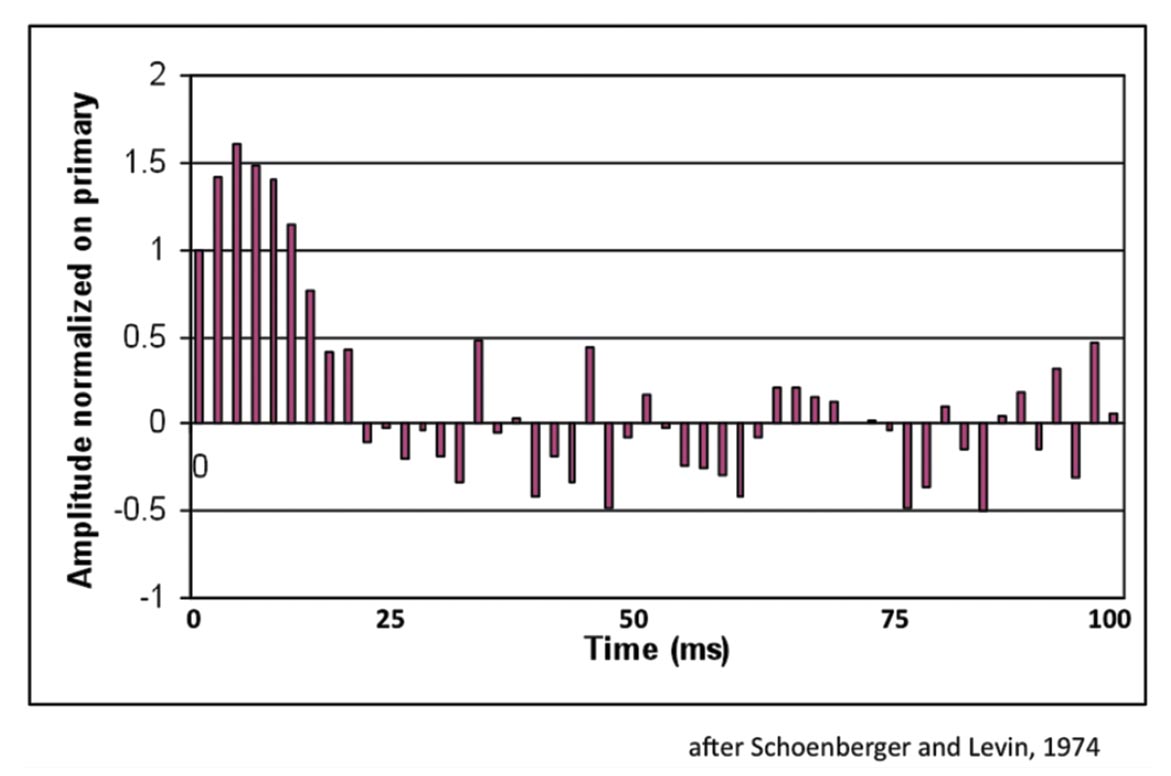
A possible explanation comes from Schoenberger and Levin (1974 and 1978) who investigated the effect of short-path multiples on the seismic response of cyclically bedded coal seams. They showed an example (replicated in Figure 21) where the energy of the primary reflection from coals deep in a cyclic series of coal cyclothems was overpowered by the energy from interand intra-bed short-path multiples. The net effect is a delay in the arrival time of the peak energy of the reflections.
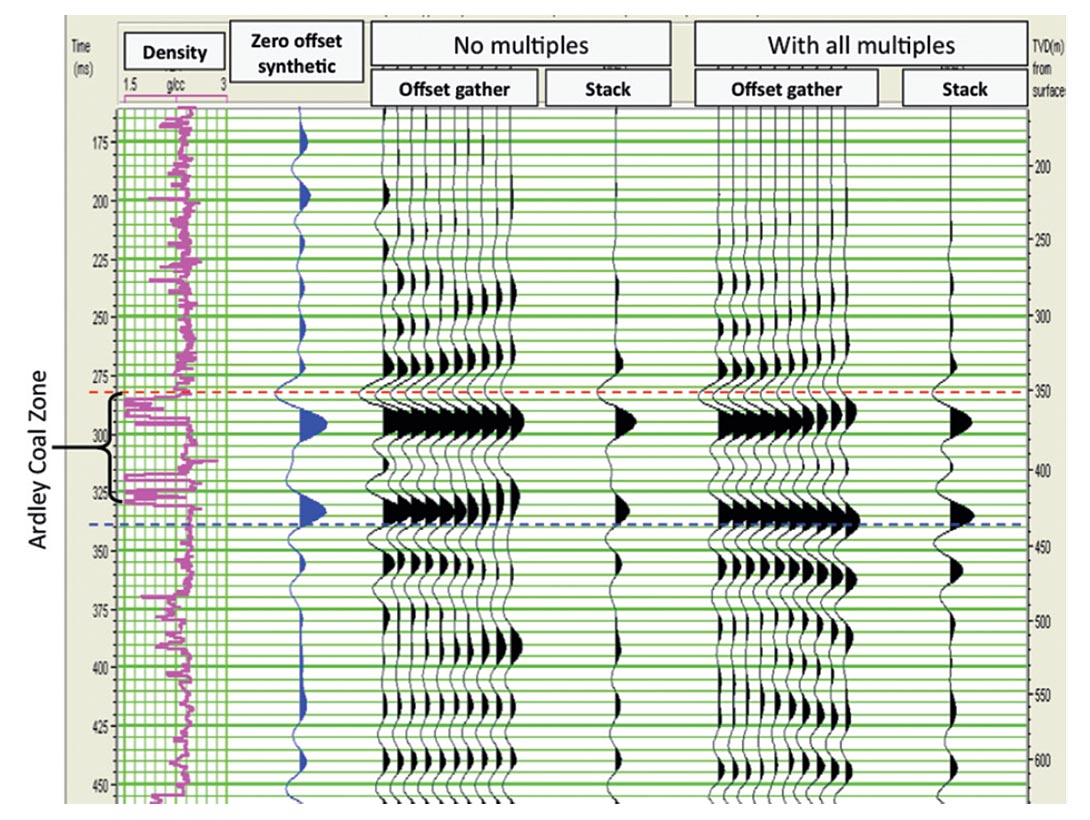
To investigate whether short-path multiples play a role in the trace wave form of the Alder Flats data, offset gathers were synthesized with the reflectivity method. The method models the full waveform response of the earth and can be calculated with or without including multiples and mode conversions. The results are illustrated in Figure 22 which shows the offset gathers with NMO removed and the stacks of the modelled gathers. In the stack that includes all multiple and mode conversion reflections, there is a slight phase delay (3-5 ms) in the onset of the reflection event that ties to the base of the Lower Ardley coals. This delay corresponds to the scale of delay that would be required to explain why the inversion result is unable to predict the location of the Silkstone coals.
Conclusions
The geostatistical inversion successfully improved the Zp inversion result in the Upper Ardley coals. The absolute estimated Zp values were equivalent to the values from the well logs at logging resolution and bed thicknesses were accurately predicted. In addition, since each of realizations is consistent with the seismic data and is a possible representation of the earth model, the range of Zp values and coal zone net-thicknesses that are captured by the realizations allow the uncertainty of the coal characteristics to be assessed. For example, the probability of achieving a certain coal net-thickness could be calculated from the multiple realizations.

Acknowledgements
The authors would like to thank Fugro-Jason for donating the use of the Jason Geoscience Workbench to conduct this work. Additionally, the assistance of John Pendrel, Jawwad Ahmad, Brian Hoffe and Olga Rehkopf was very much appreciated. Of critical importance was the support of the CREWES sponsors, the volunteers and workers who contributed to the field acquisition, and the faculty, staff, and students of CREWES and the University of Calgary Geoscience Department. Finally, Hampson Russell Software was used to conduct synthetic reflectivity modelling.
Related Reading


Join the Conversation
Interested in starting, or contributing to a conversation about an article or issue of the RECORDER? Join our CSEG LinkedIn Group.
Share This Article