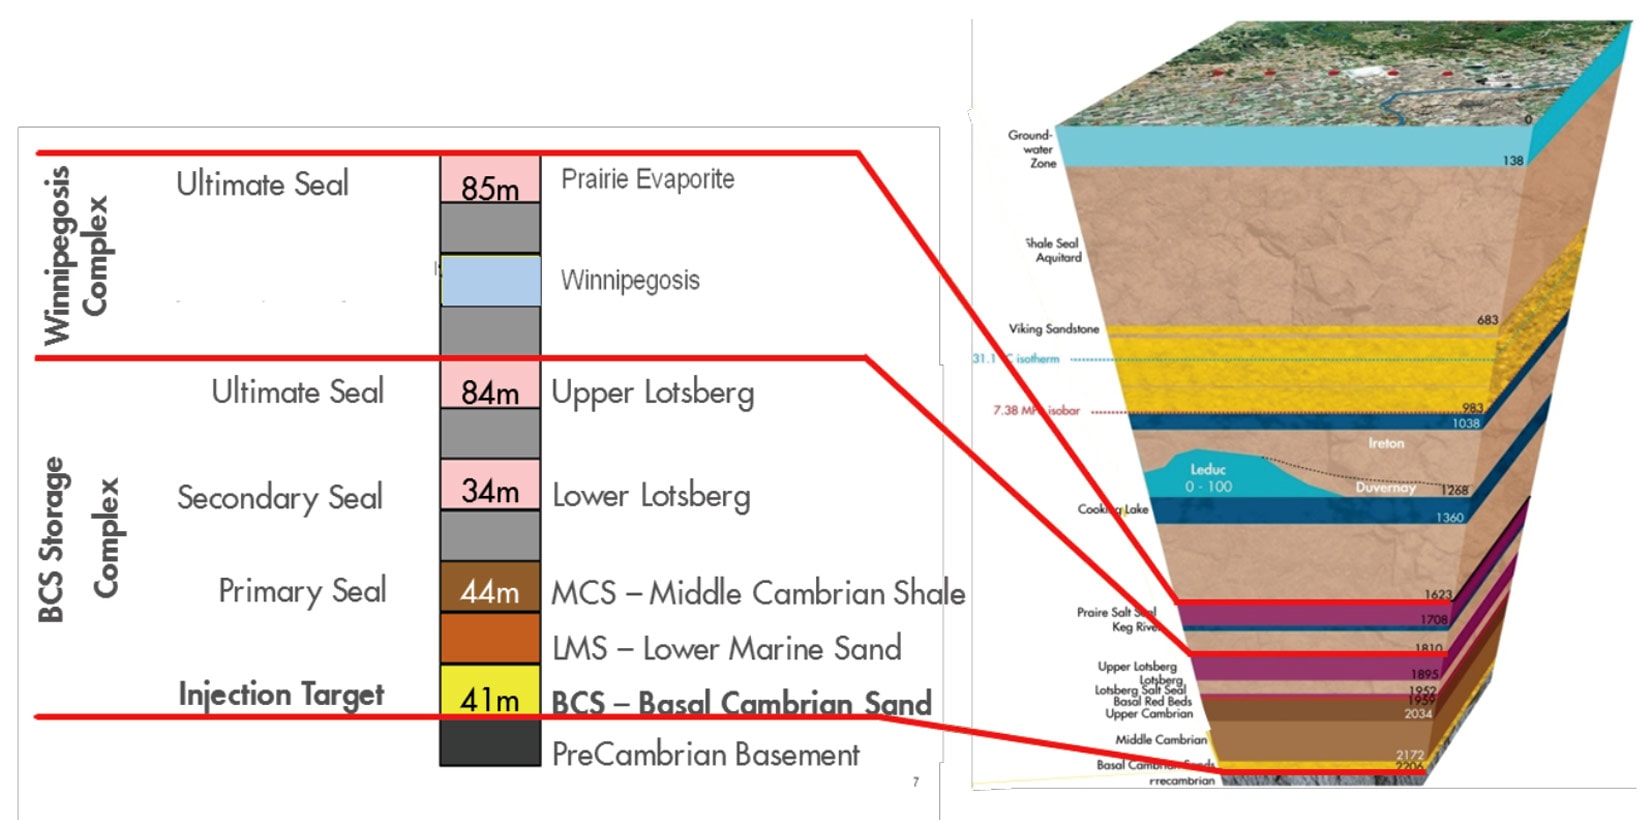
Shell Canada operates the Quest project, which is the first commercial scale and fully integrated carbon capture and storage (CCS) project related to the oil sands. The project is part of a joint venture between Shell Canada Energy, Chevron Canada Limited and Marathon Oil Canada Corporation. CO2 injection at Quest began in August 2015 and the project has successfully captured and stored more than 1 million tonnes of CO2 in its first year of operation (Tucker, et al. 2016; Rock, et al. 2016). The CO2 is captured from the hydrogen manufacturing units at the Scotford Upgrader, transported by a ~65 km long pipeline to injection wells (IWs) where it is injected into the Basal Cambrian Sands (BCS) Formation. The BCS is a saline aquifer located at a depth of about 2 km below surface, which directly overlays the Pre-Cambrian basement.
The BCS is part of the Quest storage complex which also includes a number of overlying seals (Figure 1). The storage complex has excellent characteristics like high porosity, high permeability and multiple seals that allow the safe storage of the injected CO2. A risk-based Measurement, Monitoring and Verification (MMV) plan is in place to ensure containment and conformance during the project life-cycle (Shell Canada Limited, 2014). Ensuring containment and conformance in Quest means to demonstrate the current and long term security of CO2 storage, respectively. Further information about the Quest project setup, design, operation, etc. can be found at the Alberta Energy CCS knowledge sharing website (Alberta Energy).
One component of the MMV activities is time-lapse seismic surveys, encompassing both 3D surface seismic and Vertical Seismic Profiles (VSPs). Utilizing time-lapse seismic methods provides a mechanism for understanding how the CO2 behaves in the reservoir, which enables us to address the MMV objective of conformance. The MMV objective of containment is also addressed via time-lapse seismic monitoring as the resulting images are used to confirm whether the CO2 is contained within the Quest storage complex. Additionally, the time-lapse seismic images provide an estimate of the CO2 plume growth which allows us to refine our models and better forecast the end-of-life plume size.
During the first few years of injection, walk-away 2D VSPs are a practical and economical alternative to 3D surface time-lapse seismic as the CO2 plume is expected to be contained near the well. As part of the injection well completion, fiber-optic cables were installed in each of the injection wells. This equipment enables distributed acoustic sensing (DAS) VSPs, a technology that has been proven in other projects (Mateeva, et al. 2013; Harris, et al. 2016). In addition to improving the cost of the VSP acquisition, the use of DAS at Quest has allowed for data recording without interrupting CO2 injection, while simultaneously reducing HSSE exposure. Over the course of acquisition, 9450 tonnes of CO2 were injected in IW 7-11 and 8325 tonnes of CO2 were injected in IW 8-19. The monetary value equivalent to these volumes of CO2 is in the same order of magnitude as the cost of the VSP acquisition campaign.
Baseline DAS walk-away VSPs were acquired in 2015 at the Quest injection wells, followed by monitor surveys approximately 6 months after the start of injection. A time-lapse difference in the signal is predicted to indicate a change in fluid saturations as the super-critical phase CO2 replaces the aquifer fluids around the well.
The goal of this article is twofold: a) to describe and discuss the successful deployment of DAS VSP technology to monitor CO2 plumes growth at the injection wells; and b) to demonstrate containment and conformance as per project expectations.
Seismic Acquisition and Processing
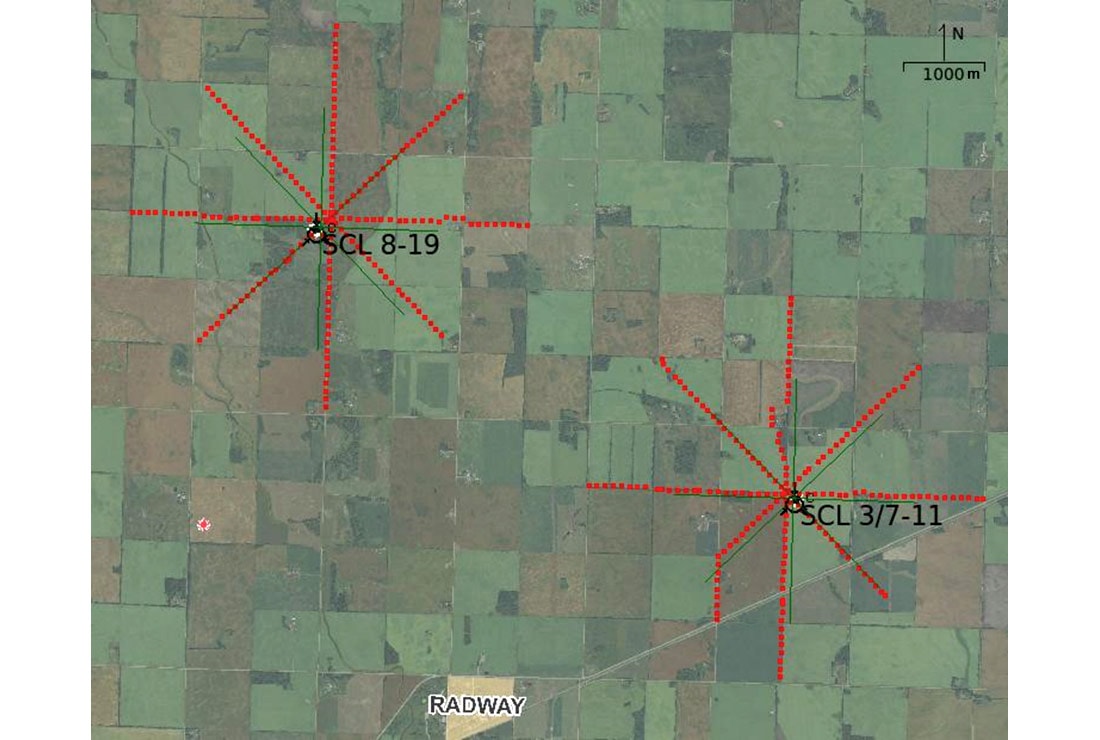
The 2015 baseline and 2016 monitor surveys included four walk-away VSPs at each of the two wells, IW 8-19 and IW 7-11 (Figure 2), with the intent of minimizing the impact of the acquisition on the surrounding farmland. Increasing signal repeatability is critical for time-lapse seismic projects, achieved primarily by minimizing acquisition differences between experiments. In order to reduce acquisition-related variability between surveys, all data was recorded during the winter (to ensure similar frozen ground conditions) using the same vibroseis and recording equipment, with special attention to shot point consistency.
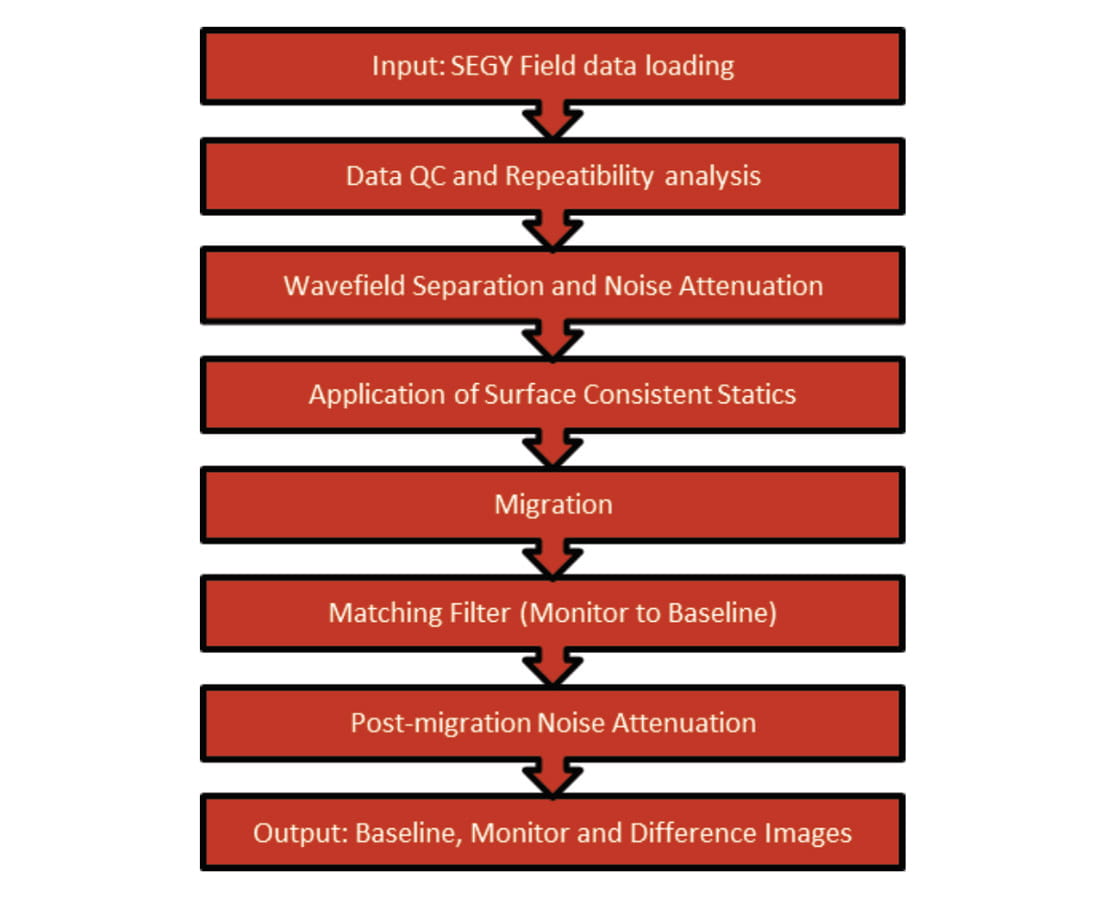
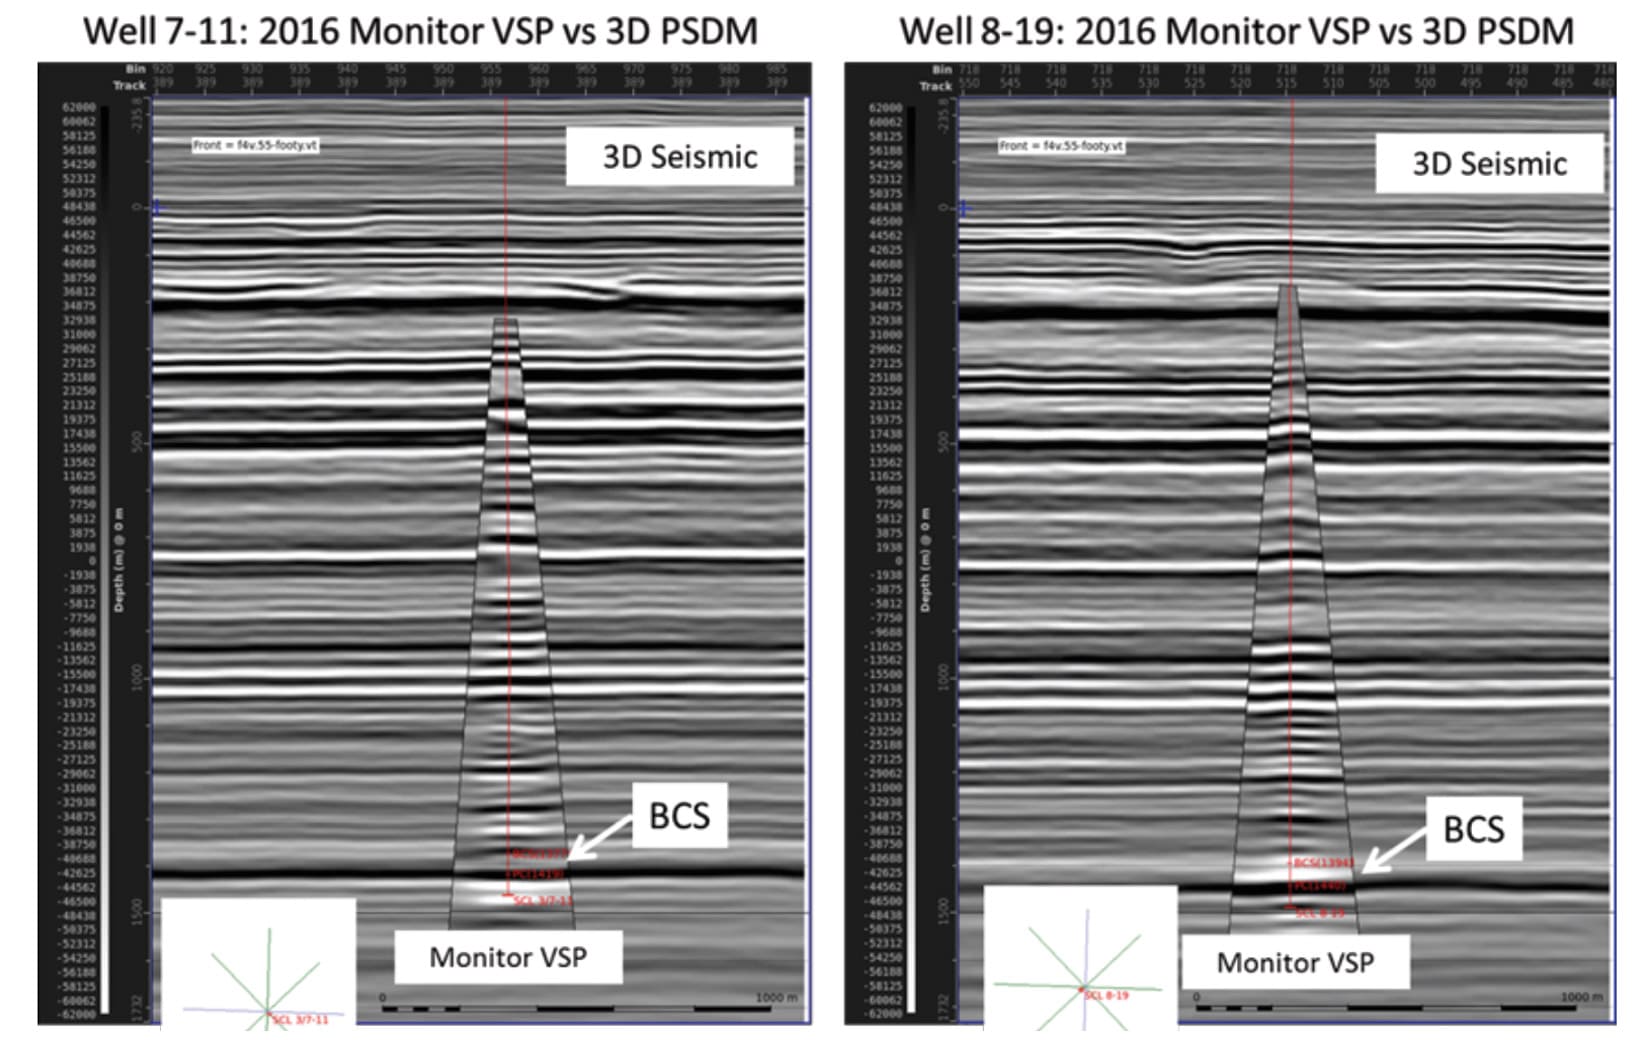
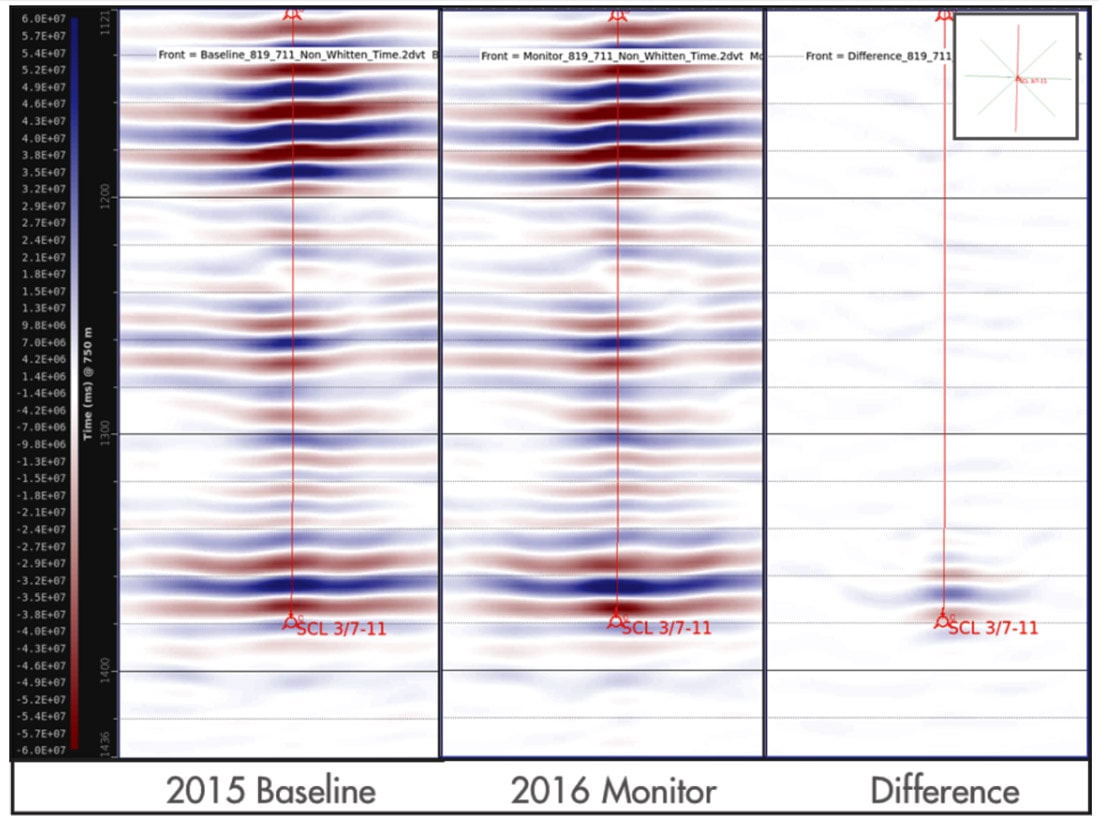
The seismic processing project had two main objectives: a) to extend the image of the BCS beyond 500 meters from the IWs while preserving image quality, and b) clearly image the time-lapse signal. A seismic processing workflow was developed to maximize lateral imaging extents while enhancing the time-lapse signal repeatability between data vintages at each step (Figure 3). A comparison of the VSP imaging results to the 2010 3D PreSDM (Figure 4) demonstrate that the VSP results align with the 3D surface seismic, demonstrating that VSP results can be used to assess the extent of the CO2 plume within the reservoir. The image differences between the 2015 baseline and 2016 monitor showed large amplitudes consistent with the modelled seismic response from the presence of CO2 (Figure 5).
Modelling the CO2 Response
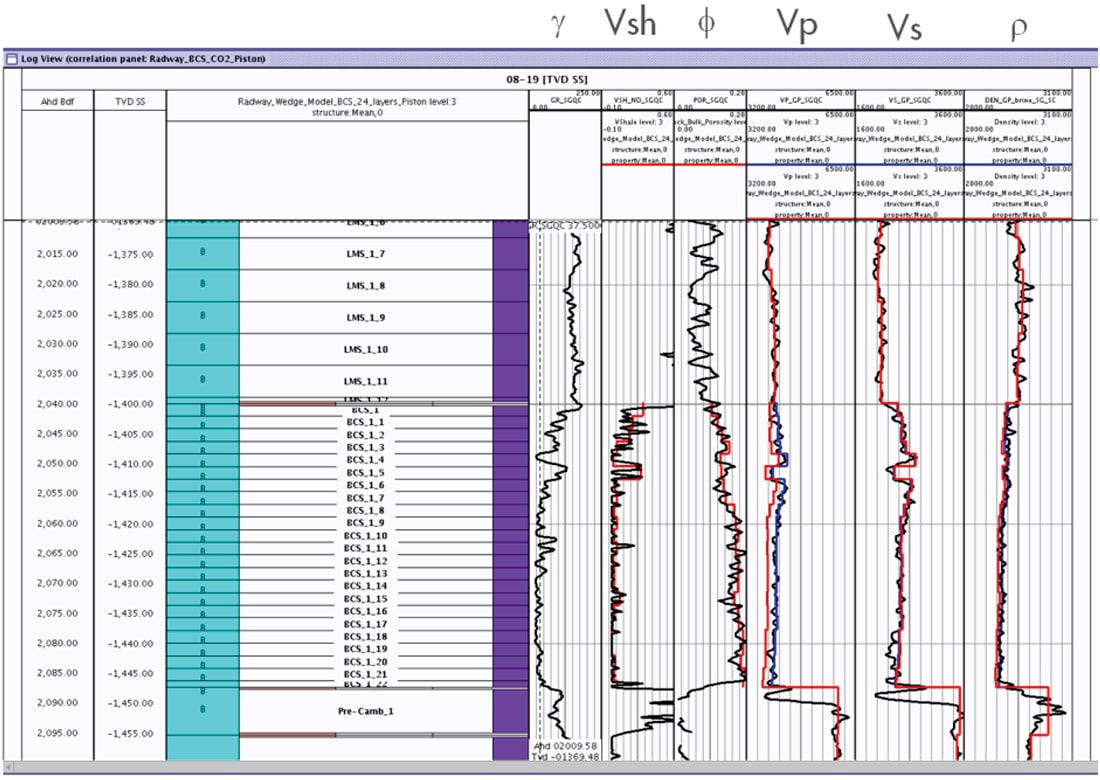
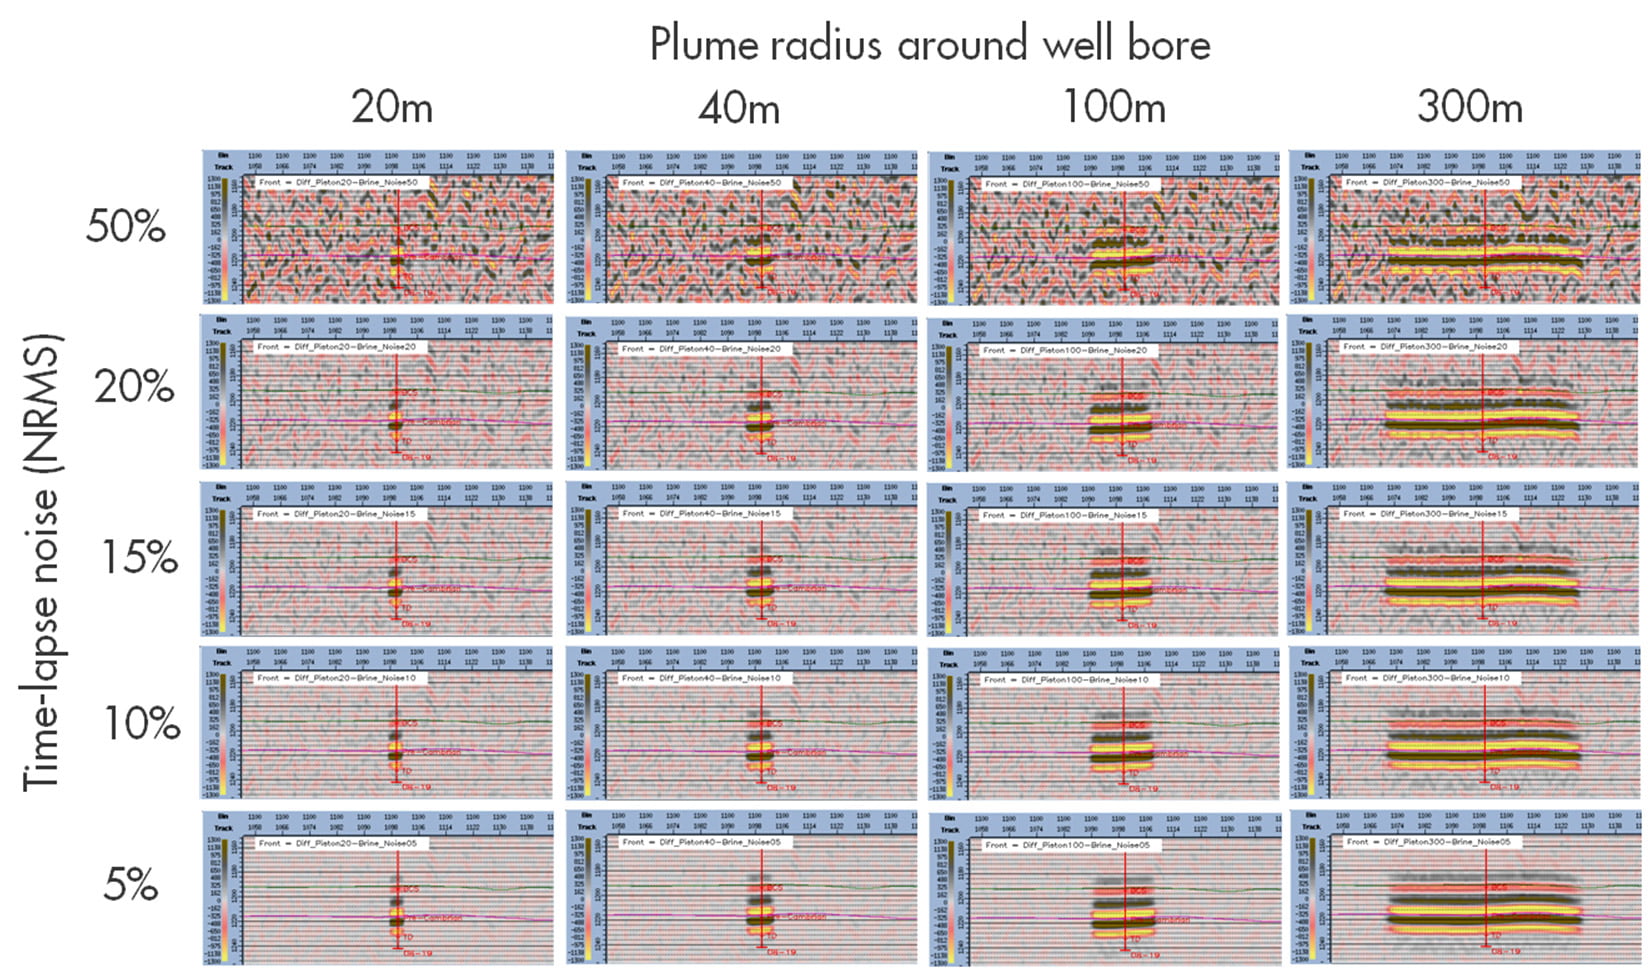
Understanding the seismic response to the presence of CO2 increases the confidence of the interpretation of the difference anomaly. The time-lapse seismic response to CO2 injection into a saline aquifer was demonstrated using an acoustic rock model. The model used petrophysical trends extracted from well data to determine baseline values for the fluid properties of the brine. The fluid change effects were then analysed using Gassmann’s equation. This showed that for a typical BCS CO2 plume, the acoustic impedance is expected to drop about 8%, with greater sensitivity expected at low saturations, making time-lapse seismic data more sensitive to detecting the edge of an injected CO2 plume than quantifying the saturation within it. Additionally, it is expected that the positive base of the BCS (Top Pre-Cambrian) will have a stronger seismic reflection than the Top BCS due to the significant increase of Vp, Vs and density at this interface (Figure 6). A synthetic time-lapse seismic response was calculated using ray-tracing and full waveform modeling, showing that a saturation change from brine to CO2 is both measurable and robust above typical noise levels. In contrast, pressure change effects are expected to be very small. The modelling also demonstrates that reflections from small, early-stage plumes (<50 m radius) appear on only a few seismic traces and could be difficult to detect and discriminate from the strong down-going wavefield (Figure 7). However, VSPs are expected to be an effective monitoring tool some 5 years into the project, up to plume sizes of about 500m radius (Shell Canada Limited 2011).
Interpreting the Changes in the Reservoir
The modelling results give confidence that the time-lapse response is caused by the presence of CO2 in the reservoir. Therefore, each azimuth covered by the walk-away VSPs provides a point of information about the extent of the CO2. Some of the interpretation challenges include: resolution limitations of the seismic (especially given relatively small volumes of injected CO2), 2D imaging and interpolation issues, as well as some data signal-to-noise concerns. An additional challenge arises from the VSP shot line offset from the well, which adds uncertainty to the positioning of each 2D VSP image reflection point. Given that the CO2 plume at this early stage of the project is expected to be small; the lateral uncertainty is large compared to the interpreted plume dimensions. Fortunately, as the CO2 plume grows with time, the results from future walkaway DAS VSP surveys will become better determined.
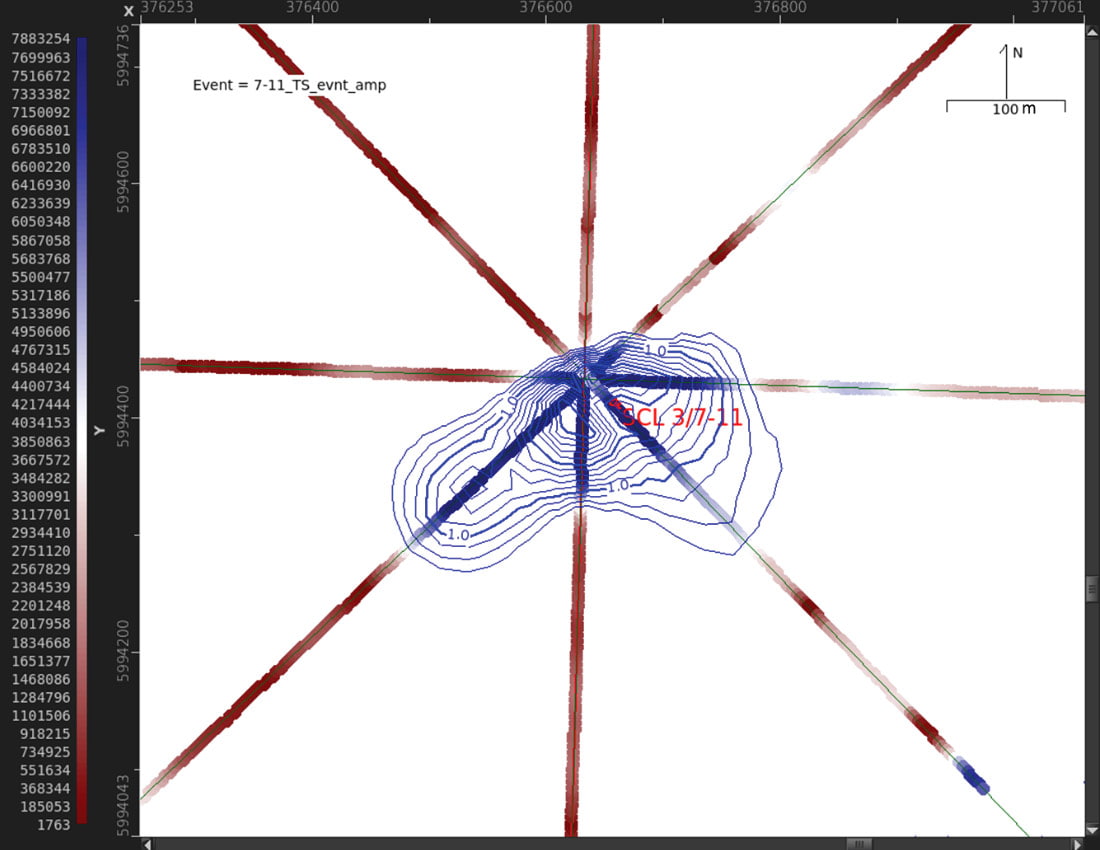
The time-lapse anomaly as a 3D interpolation of the CO2 plume at IW 7-11 is shown in Figure 8, and the dimension of the plume at each of the IW locations are presented in Table 1. These dimensions fall under the range predicted by the reservoir model (100-300 meter radius). These results allow for the monitoring of the plume development and geometry, helping to provide an indication of the relative permeability in the BCS. Additionally, they are critical for calibrating uncertainties in the dynamic reservoir models for future plume forecasting. Combining these results with those from future monitor VSP surveys will provide a more complete picture of the development of the CO2 plume, given that larger plume sizes should be better imaged and therefore provide more confidence.
| Well | Average radius of Time-lapse difference | Lateral uncertainty | Minimum concentration of CO2 | Vertical resolution |
|---|---|---|---|---|
| 7-11 | 158 meters | +/- 70 meters | 5% | 20 meters |
| 8-19 | 155 meters | +/- 70 meters | 5% | 20 meters |
Another key result is the absence of any time-lapse signal outside of the BCS (see difference panel in Figure 5). This addresses the key risk of containment of the CO2 within our reservoir and storage complex.
Conclusions
- Utilizing walkaway DAS VSPs at Quest has allowed us to meet two of the objectives stated in the MMV; to prove containment and conformance of the CO2 plume. There is no evidence of CO2 outside of the reservoir and the current plume interpretation fits within our expectations based on our reservoir modelling predictions.
- Our experience shows that using walkaway DAS time-lapse VSPs in the Quest project can be an effective way to monitor the dimensions of a CO2 plume for Carbon Capture and Storage (CCS) projects.
- Using DAS technology as a substitute for conventional wellbore geophones allows for faster and safer operations by reducing exposure time and equipment needs.
- Reducing the 3D survey to a walkaway VSP increases the affordability of the monitoring requirements. Results from the Quest CCS time-lapse walkaway DAS VSPs show that this technique provides enough information to estimate the size of the CO2 plume, thereby ensuring that its geometry can be interpreted during the first few years of injection.
- The uncertainty associated to the time-lapse image is expected to decrease as the CO2 plume grows. This will result in higher confidence in the illumination when future monitor surveys are acquired.
- These results represent important progress for DAS VSP monitoring technology and a further step along the path to making CCS economically viable.

Acknowledgements
We want to thank the partners of the Athabasca Oil Sands Projects (AOSP): Chevron Canada Limited and Marathon Oil Canada Corporation. Funding for the Quest CCS Project from the Government of Alberta and the Government of Canada is gratefully acknowledged. Thanks go to numerous Shell staff in Canada, US, Europe; as well as 3rd party contractors for their contributions. Finally, a special recognition is due to the Quest subsurface team members: Anne Halladay, Jeff Duer, Luc Rock, Tanu Dixit and Sarah Kassam for their contributions to this work.
Related Reading


Join the Conversation
Interested in starting, or contributing to a conversation about an article or issue of the RECORDER? Join our CSEG LinkedIn Group.
Share This Article