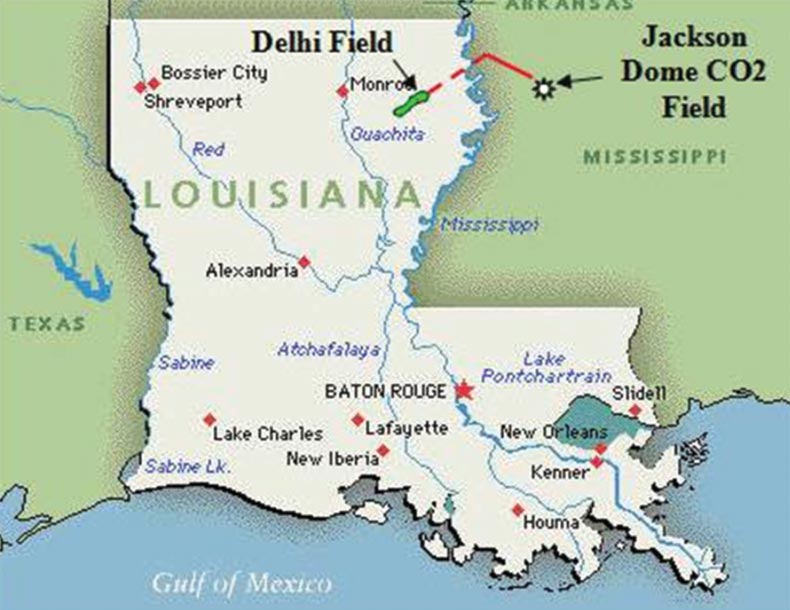
Delhi Field is a producing oil field located in the Madison, Franklin and Richland parishes of northeastern Louisiana (Figure 1). The field is 15 miles long and 2 to 2.5 miles wide, with an aerial extent of 6,200 acres. Delhi Field was discovered in 1944 and is estimated to contain 357 million barrels of original oil in place (OOIP) (Powell, 1972).
The main producing reservoir and target zone in Delhi Field is the Holt-Bryant reservoir, which is currently undergoing a tertiary CO2 enhanced oil recovery program, operated by Denbury Resources. Up to November 2009, 192 million barrels had been produced. The field has undergone primary production (1944-1953), secondary waterflood recovery (1953-1980), and since November 2009 is now producing through tertiary CO2 flooding.
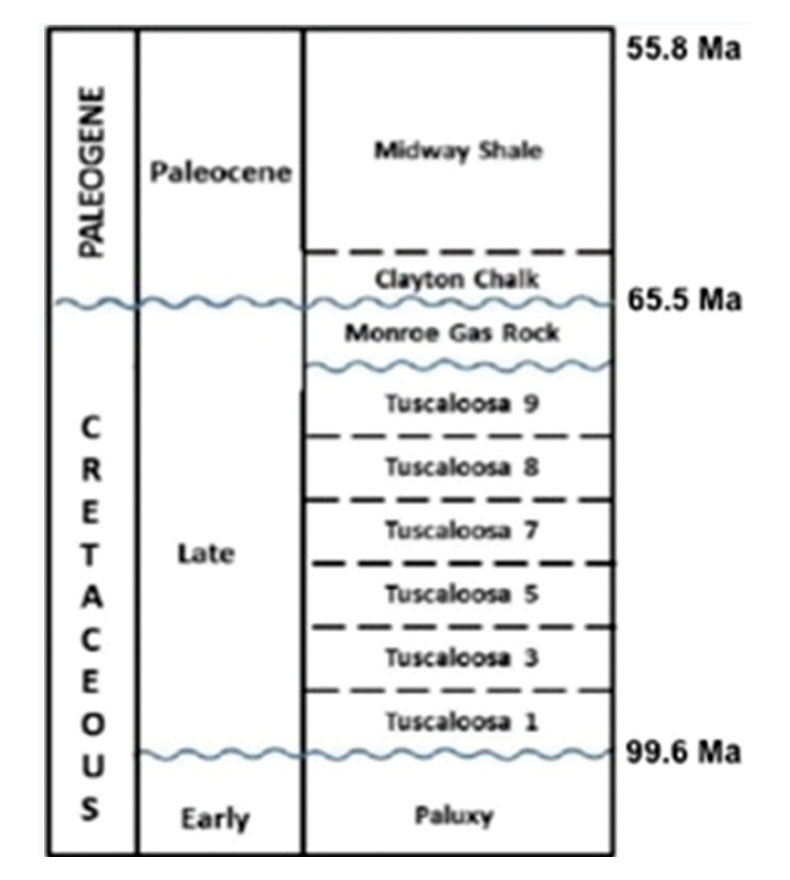
This unit occurs at depths between 3,000 and 3,500 ft and consists of both Upper Cretaceous Tuscaloosa and Lower Cretaceous Paluxy sandstones. A large stratigraphic trap binds the reservoir, where the Paluxy sandstones unconformably are overlain by the Tuscaloosa sandstones, which are in turn unconformably overlain and truncated by the Monroe Gas Rock (Figure 2).
The work of Silvis (2011) interprets the depositional system of the Base Paluxy and upper Tuscaloosa Formations as fluvialdeltaic environments, and therefore distributary channel sandstone deposits should be present. The channel features will be preferential CO2 flow pathways due to their higher permeability; this results in bypassed zones and ultimately affects the efficiency of the tertiary recovery program.
Reservoir monitoring is being carried out to improve the reservoir characterization and recovery efficiency. Time-lapse seismic interpretation results of this study were the identification of CO2 flow paths within the reservoir. An identified time-lapse anomaly indicates CO2 is flowing from the Paluxy up to the more permeable Tuscaloosa Formation, which is critical to the enhanced oil recovery project because it indicates the Paluxy is not being properly swept. The time-lapse seismic interpretation also allowed for the identification of permeability baffles in the Paluxy reservoir. The identified areas with low relative permeability improved the interpretation and delineation of high quality sandstone CO2 flow paths. The interpreted CO2 flow paths and low permeability areas allowed for alteration recommendations of the injection and production pattern to improve oil recovery.
Data Preparation
Cross-equalization was applied to the baseline and monitor surveys. For time-lapse, seismic repeatability is essential to provide confidence that the interpreted anomalies are due to changes in the reservoir related to injection and production (Calvert, 2005). Differences in acquisition parameters and near surface conditions are the main sources of noise in the seismic dataset. Differences in near surface conditions impact geophone coupling and can cause variations in frequency, amplitude, time, and phase of the seismic. Other sources of noise are the use of different source waveforms, different receivers, and mispositioned source and receiver points (Rickett and Lumley, 2001). Cross-equalization minimizes these variations, therefore increasing confidence that the remaining time-lapse changes are due to CO2 injection and fluid production. Interpretation of the time-lapse anomalies is crucial in the understanding of the fluid behavior within the reservoir.
Dynamic Reservoir Characterization
Time-lapse seismic monitoring is a geophysical technique applied to aid the understanding of fluid changes within reservoirs. This technique is used to look for subtle changes in the acoustic properties of the reservoir due to fluid injection and/or production. Changes in acoustic impedance are due to fluid saturation and pressure changes and yield a more detailed understanding of fluid movements, compartmentalization, barriers, and bypassed zones in the reservoir. This time-lapse study has evaluated the existing well performance and has identified areas that could benefit from alteration and result in increased sweep efficiency.
A dynamic, time-lapse interpretation was performed on the cross-equalized baseline and monitor datasets. Time-lapse seismic interpretations can be used to identify fluid flow paths from injectors to producers and improve the understanding of (1) permeability trends, of (2) the presence of baffles, and of (3) compartmentalization within the reservoir.
Time-Lapse Seismic Interpretation
The CO2 injection program began in November 2009. The baseline survey was shot before CO2 injection began, while the monitor was shot 7 months after continuous CO2 injection. The primary objective of this work is to use the time-lapse seismic data to delineate channel sandstones and evaluate dynamic changes in the Holt-Bryant reservoir as a result of fluid injection and production.
Figure 3 shows the average RMS amplitude difference between the cross-equalized monitor and baseline surveys within two windows: A) 5 ms below the Clayton Chalk Formation and B) 10 ms centered on the Tuscaloosa Formation. Markers around each well show the relative amount of injected CO2 (green) and produced brine (blue) and oil (red). The average RMS amplitude difference below the Clayton (A) shows amplitude changes around Paluxy injectors 164-3, 158-4, and 146-1, which are the shallowest injector wells. The anomalies tend to be elongated parallel to the truncation of the Paluxy against the Clayton indicating accumulation of CO2 along the pinchout edge. Well 158-4's anomaly is not centered on the well location, it is elongated towards the northeast, indicating the possibility that a lower quality reservoir sandstone is present, preventing the CO2 from surrounding the well symmetrically. Well 164-3 has a smaller time-lapse change than other injector wells, which is equated to the smaller amount of CO2 injected.
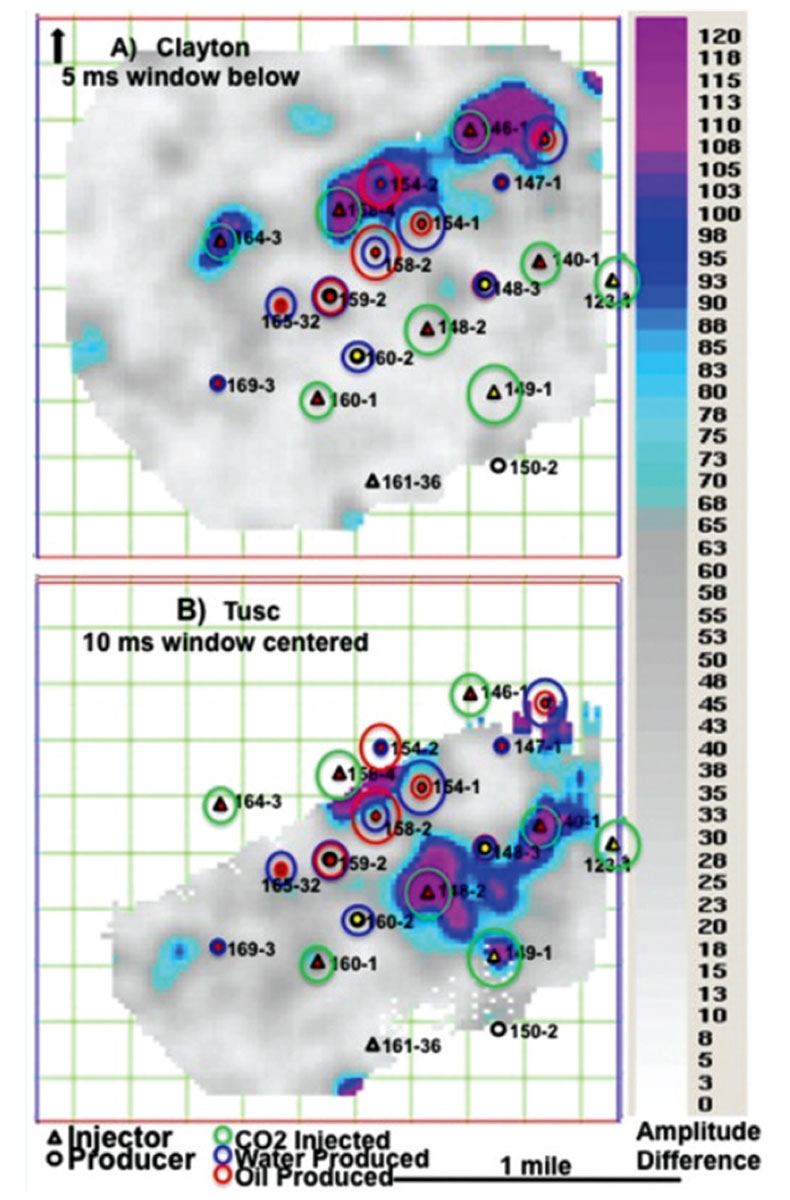
Wells 123-1, 149-1, and 161-36 are CO2 injectors into the Tuscaloosa sandstones. Well 161-36, due to improper injection, was shut-in prior to CO2 implementation. Between the baseline and monitor surveys, wells 123-1 and 149-1 were continuously injecting CO2 into the Tuscaloosa sandstones.
In B of Figure 3, the average RMS amplitude difference between the cross-equalized monitor and baseline surveys is shown within a 10 ms window centered on a minimum Tuscaloosa reflector. CO2 flow paths from Tuscaloosa injector 123-1 are difficult to interpret, due to the well location just outside of the overlap of the baseline and monitor seismic datasets. Updip CO2 movement from Tuscaloosa injector 149-1 is seen. A large timelapse change is seen around well 148-2 and an elongated anomaly is seen going from injector 140-1 towards producer 148- 3. Wells 148-2 and 140-1 are Paluxy injectors and the time-lapse changes centered on the Tuscaloosa interval indicate that CO2 is flowing from the Paluxy up to the Tuscaloosa. This is a likely scenario due to the Tuscaloosa having higher permeability values than the Paluxy. This CO2 flow trend identification is critical to the enhanced oil recovery project because it indicates that the Paluxy is not being properly swept due to the CO2 breaking through up into the shallower more permeable Tuscaloosa sandstones. As the flood continues, the CO2 will continue to break through into the Tuscaloosa and the oil in the Paluxy will not be contacted, therefore the injection rate or perforated intervals in wells 148-2 and 140-1 need to be altered in order to keep the injected CO2 within the Paluxy Formation.
Figure 4 shows the average RMS amplitude difference between the cross-equalized monitor and baseline surveys within two windows: A) 10 ms centered on the Top Paluxy and B) 20 ms centered 10 ms above the Base Paluxy. Markers around each well show the relative amount of injected CO2 (green) and produced brine (blue) and oil (red).
In A of Figure 4, the average RMS amplitude difference is shown within a 10 ms window centered on the Top Paluxy. There are prominent amplitude changes around every Paluxy injector including wells: 164-3, 158-4, 146-1, 160-1, 148-2, and 140-1. High amplitude connections can be seen between wells 158-4 and 160- 1, and 160-1 and 140-1, indicating the CO2 may be flowing along high permeability pathways. The same anomaly shape seen in Figure 3 A supports the interpretation of a permeability baffle between wells 164-3 and 158-4. An asymmetrical, elongated anomaly is seen around injector 160-1, indicating CO2 migration along strike and slightly downdip towards the southeast. The injection and production markers associated with each well have a good correlation between the amount of CO2 injected and the time-lapse change areal extent, for example wells injecting high volumes of CO2, with time-lapse changes connecting to producers that are producing high oil and brine volumes, like injector 148-2 and producer 159-2.
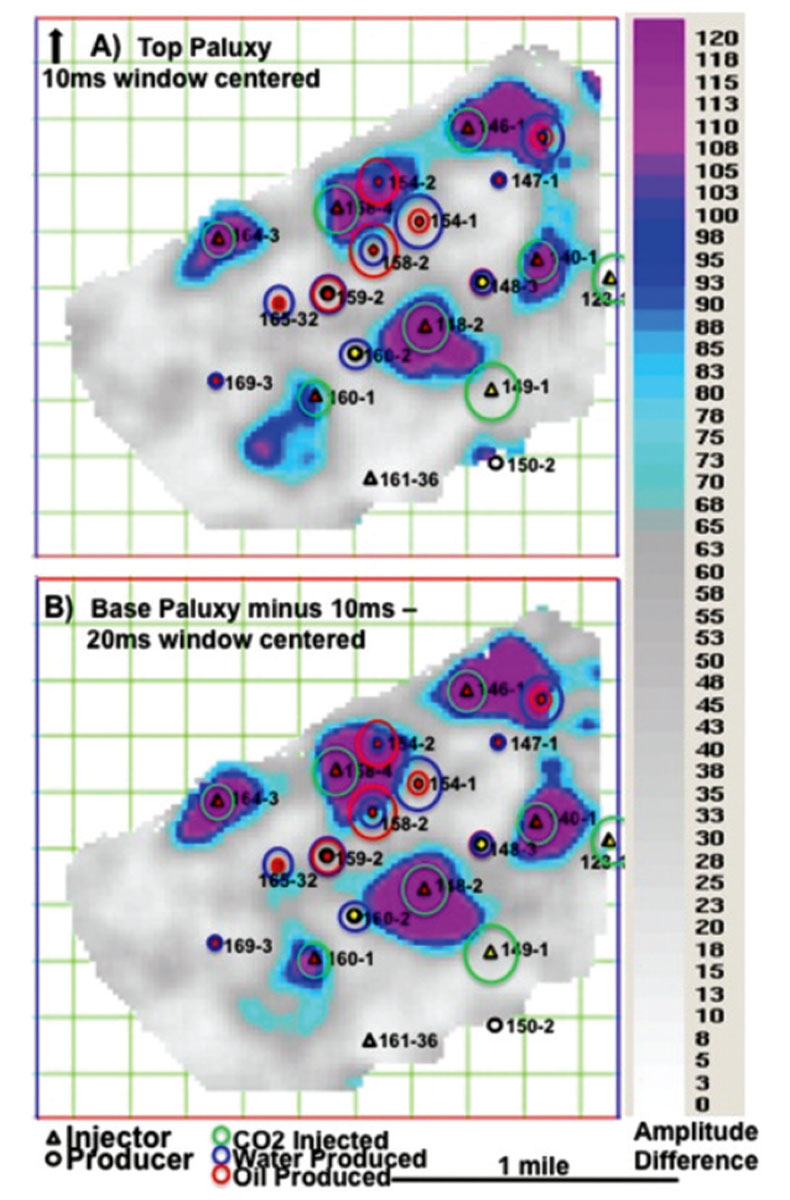
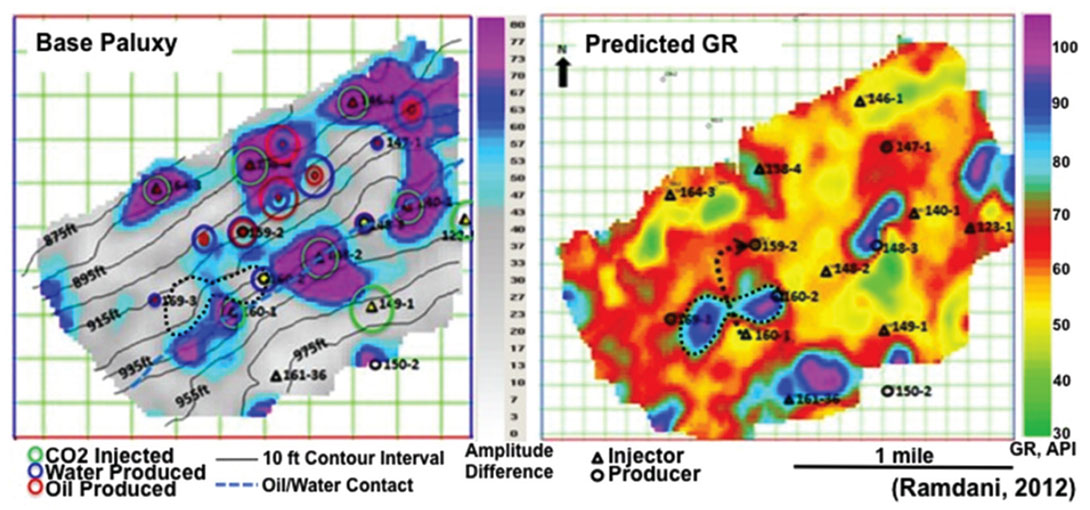
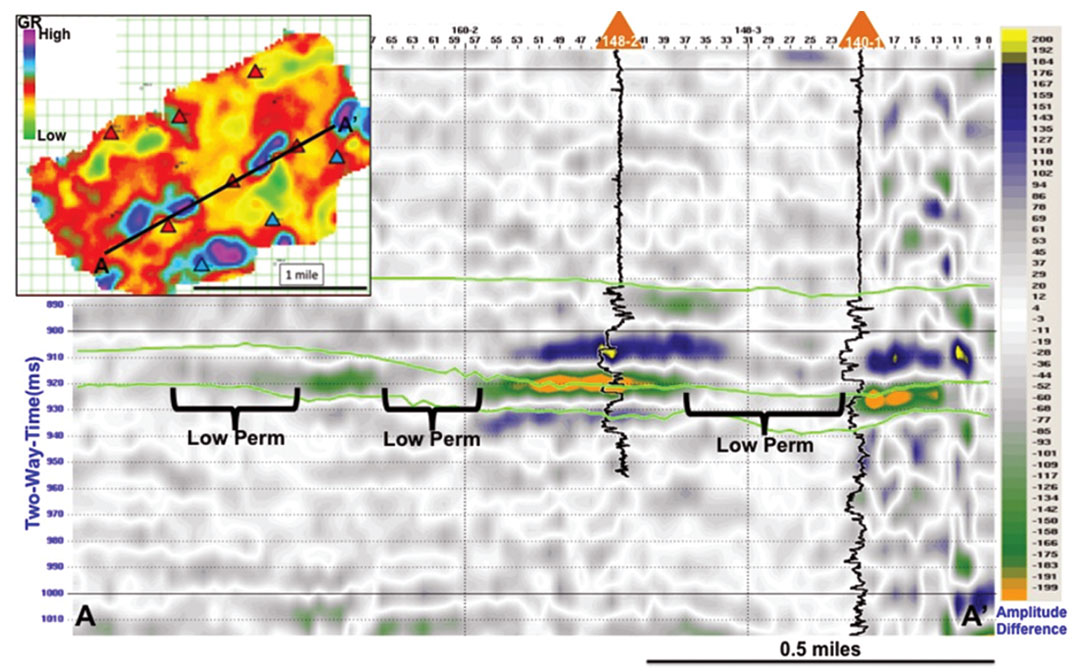
In B of Figure 4, the average RMS amplitude is shown within a 20 ms window centered 10 ms above the Base Paluxy. There are amplitude changes around every Paluxy injector. The highest oil producing well since CO2 injection began, well 158-2, is likely a result of CO2 sweep from injectors 158-4, 160-1, and 148-2. A subtle amplitude pathway between injectors 160-1 and 148-2 is present. By narrowing the color scale, shown in Figure 5 (left), the feature appears to be a CO2 flow pathway. When compared with the predicted GR map (Ramdani, 2012), a lower quality reservoir zone has been identified straddling the CO2 flow pathway. These images show the possibility that the CO2 is breaking through the lower quality reservoir zone and is flowing to producer 159-2. The time-lapse changes seen around injector 160-1 show an elongated shape trending NE-SW. This shape indicates CO2 movement along strike and slightly downdip from the injector, which can be further understood by Figure 5, which shows interpreted low quality reservoir bodies around injector 160-1, inhibiting CO2 movement to the north and therefore CO2 is building up along strike and downdip. Figure 6 shows a cross-section through the timelapse monitor-baseline difference volume that crosses just north of injector 160-1. Here, the subtle CO2 path from 160-1 to producer 159-2 can be seen between the 2 interpreted lower permeability bodies. Also, the symmetrical anomaly around injector 148-2 is seen in a clean sandstone package from the GR map, while injector 140-1 only shows an anomaly towards the northeast, due to the clean sandstone in the northeast and the lower permeability reservoir rock presence in the southwest.
The identified permeability baffle between wells 164-3 and 158-4, seen in Figure 3 A and Figure 4 A is strengthened by Figure 3 B and Figure 5 (left), seen by a sharp amplitude change between the wells. The asymmetrical, sharp amplitude change elongated anomaly is seen around 158-4 and elongated anomaly around injector 164-3 in Figure 3 B, supports the hypothesis that CO2 from well 158-4 is migrating along strike towards the northeast due to a permeability baffle between the two wells. The proposed permeability baffle is supported by the work of Ramdani (2012), who shows a high gamma ray value trend, indicating lower quality reservoir presence, between the two injectors.
From the time-lapse seismic interpretation, CO2 flow paths between injector and producer wells were delineated. Areas of lower permeability reservoir rock were identified by the CO2 anomalies. No production is occurring from Paluxy producer 169-3 due to the lower quality reservoir presence between the producer and injector 160-1. Further investigation needs to be implemented in order to determine the potential benefits of converting producer 169-3 into a CO2 injector in order to sweep the oil in the western portion of the survey. Also, areas with potential bypassed pay were identified where CO2 from Paluxy injectors is moving into the lower permeability Tuscaloosa sandstone reservoir.
Conclusions
The primary objective of this study was to use time-lapse seismic data for the reservoir characterization and fluid movement interpretation of Delhi Field, Louisiana. The time-lapse seismic interpretation allowed for CO2 flow paths to be identified within the reservoir, allowing for further understanding of fluid flow between injector and producer wells. An improved understanding of the fluid flow paths allowed for alteration recommendations to be made to the Delhi Field reservoir model communication pathways.
An identified time-lapse anomaly over the Tuscaloosa indicates CO2 is flowing from the Paluxy up to the more permeable Tuscaloosa Formation. This CO2 flow trend identification is critical to the enhanced oil recovery project because it indicates that the Paluxy is not being properly swept due to the CO2 break through up into the Tuscaloosa sandstones.
The time-lapse seismic interpretation allowed for the identification of permeability baffles in the Paluxy reservoir. The identified lower quality reservoir rocks improved the interpretation and delineation of high quality sandstone CO2 flow paths. The predicted gamma ray (GR) map aided the time-lapse interpretation by indicating areas with and without Paluxy sandstone presence. The predicted GR map allowed the comparison of low GR sandstones and high GR, lower quality reservoir rock to the time-lapse changes to confirm the presence of lower quality reservoir permeability baffles, where no sandstone is present. The improved understanding of the lower quality reservoir rocks and CO2 flow paths will provide more detailed input to add to the reservoir simulation model.

Acknowledgements
The authors would like to thank the Reservoir Characterization Project sponsors for making this work possible. We are grateful for Dr’s Walt Lynn, Mike Batzle, and Larry Meckel who supported and aided this research. In addition, we would like to express our gratitude to Denbury Recourses for enabling this study to be undertaken.
Related Reading


Join the Conversation
Interested in starting, or contributing to a conversation about an article or issue of the RECORDER? Join our CSEG LinkedIn Group.
Share This Article