Introduction
Carbon capture and storage (CCS) in geological formations is becoming a key technology for the permanent reduction of CO2 emissions in the atmosphere. The Government of Alberta’s Carbon Capture and Storage Summary Report of the Regulatory Framework Assessment (2013) states, in its Summary of Recommendations, that it requires MMV (measurement, monitoring, verification) and closure plans to be based on a project-specific risk assessment and include the use of best available technologies to monitor the atmosphere, surface, ground and surface water, and subsurface. Pilot-scale projects with small volumes of injected CO2 are important, as they provide well controlled conditions that enable testing, validation, and quantification of these monitoring technologies.
Carbon Management Canada (CMC) is an Alberta-based, not-for-profit corporation, providing research facilities and technical expertise on CCS. The Containment and Monitoring Institute (CaMI) of CMC, in collaboration with the University of Calgary, has developed, and now operates, a comprehensive Field Research Station (FRS) in Newell County, Alberta, Canada. We are injecting small and controlled volumes of CO2 into the Upper Cretaceous Basal Belly River Sandstone Formation (BBRS) at a depth of approximately 300 m, with goals: 1) to determine the detection threshold for gas-phase CO2 at shallow to intermediate depths and 2) to improve and develop monitoring technologies to minimize risk in CO2 storage.
The FRS hosts a broad range of geophysical and geochemical monitoring technologies, including fiber sensors for distributed acoustic sensing (DAS) surveys, permanent borehole and surface electrodes for electrical resistivity tomography (ERT), and a permanent array of seismometers for monitoring microseismicity. An injection well, and two monitoring wells, host several pressure and temperature gauges, as well as fiber sensors for distributed temperature sensing (DTS). We conduct regular 2D, 3D, and vertical seismic profile (VSP) active seismic surveys for time-lapse monitoring of changes in the subsurface detectable with seismic. We are also testing a variety of cutting-edge technologies for atmospheric methane detection, mainly directed toward abandoned wells monitoring.
This paper presents an overview of the monitoring technologies tested at the site and their results, and it will show how the FRS can be used to assist end-user understanding and increase public confidence in CCS.
Background on CCS Projects
It is widely viewed that CCS will become a key technology for the permanent reduction of carbon dioxide (CO2) emissions in the atmosphere. The first CO2 enhanced oil recovery (EOR) project was established in 1972 (Terrell Natural Gas Processing Plant, Texas, USA). The first dedicated geological storage of CO2 has been operating since 1996 (Sleipner project, North Sea, Norway). In 2020, 26 large-scale facilities were operating. Two other projects were suspended for reasons unrelated to CO2 injection (economic downturn and fire). The majority of the facilities (22) are EOR projects, and six are dedicated geological storage projects (Global CCS Institute (GCCSI) Report, 2020). Worldwide, the facilities capture and store 40 Mt of CO2 per year. The total cumulative injection was 250 Mt as of 2020 (Global CCS Institute (GCCSI) Report, 2020). The last decade has seen the emergence of most of the projects (19). Thirty-seven new facilities should be opening in the near future: there are three in construction, 13 in advanced development, and 21 in early development (Global CCS Institute (GCCSI) Report, 2020).
In Western Canada, there are three CCS projects in operation:
- the Quest project (Shell, 2021), running since 2015, with more than 5 Mt of CO2 stored;
- Boundary Dam, Saskatchewan (SaskPower, 2021), a combined CO2 geological storage project (Aquistore) and CO2-EOR (Weyburn); and
- the newly launched Alberta Carbon Trunk Line (ACTL, Enhance Energy, 2021), the first Canadian hub project used for EOR, which stored 1 Mt from two sources in its first nine months of operation.
The International Energy Agency states that CCS needs to reach 5.5 Gt of CO2 captured and stored per year worldwide to comply with the net-zero emissions by the 2050 target (IEA, 2020). The current worldwide capacity of 40 Mt per year might seem inadequate, but CCS is gaining traction as a viable solution to emissions reduction for all carbon intensive industries. An increasing number of companies are pledging toward net-zero carbon by 2050, with the use of CCS in their scenarios, and government and private incentives to push toward a net-zero future are emerging. The estimation of available pore space that can be used for CO2 storage is promising: storage for 2,000 to 21,000 Gt in the USA alone, and capacity for 200 to 430 Gt in Canada. There is an estimated one thousand years of geological storage available worldwide (Global CCS Institute (GCCSI) Report, 2019).
The large-scale pioneer projects have established the basis for future successful operations. As more and more projects come online, costs of construction and operation will go down because of Wright’s law, or the learning curve (for every doubling of CCUS projects, costs will fall by a constant percentage), which we have seen in the renewables like solar and wind turbines. Also, with the development of CCUS hubs and the sharing of infrastructure, economies of scale can be taken advantage of, to further reduce costs.
Smaller test sites are equally important, as they enable testing and development of technologies in real-world conditions. CMC’s CaMI and the University of Calgary developed the Field Research Station for this purpose.
CaMI Field Research Station
The CaMI Field Research Station (CaMI.FRS) is located 200 km southeast of Calgary, Alberta, Canada (Fig. 1, inset). We are injecting a small amount of CO2 (several tens of tonnes per year) into the shallow subsurface (at approximately 300 m depth) to simulate an unplanned CO2 leakage from a deeper and larger scale CO2 storage project (Lawton et al., 2019). The injected CO2 enables us to determine the detection threshold for gas-phase CO2 at shallow to intermediate depths to improve and develop monitoring technologies and reduce the risks of CO2 storage by preventing potential leakage.
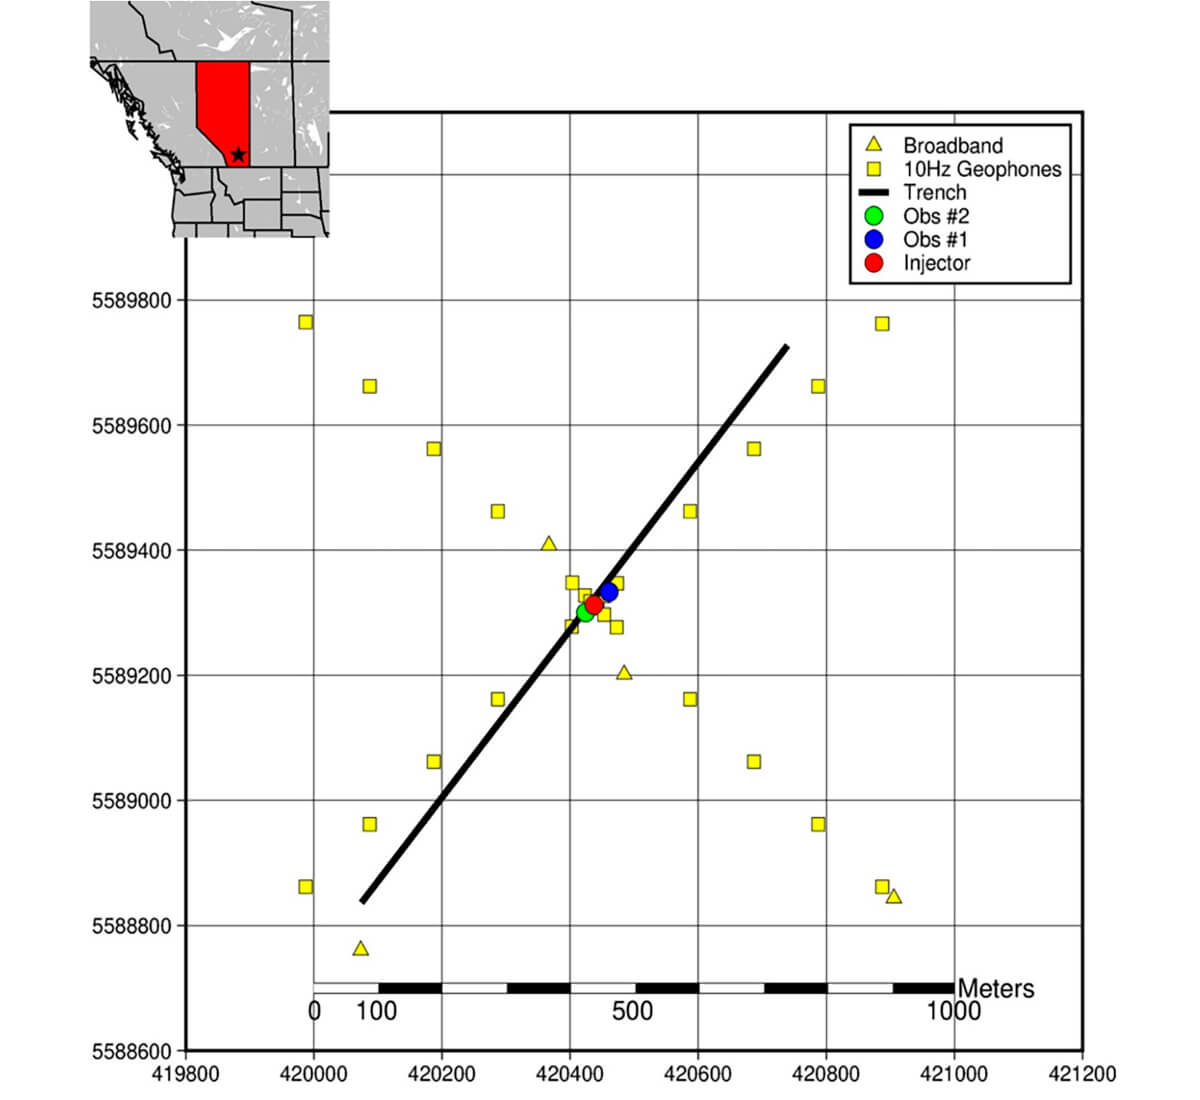
Figure 1. Permanent layout of the CaMI Field Research Station. Observation well #1 – or Geochemical well - (blue dot) hosts the geochemical equipment for gas and fluid sampling, as well as straight fiber optic cable for distributed acoustic sensing (DAS) surveys. It is located 30 m northeast of the injection well. Observation well #2 – or Geophysical well – (green dot) hosts 16 electrodes and 24 3C geophones, as well as helical and straight fiber optic cables for DAS surveys. It is located 20 m southwest of the injection well. The 1.1 km long trench hosts 112 electrodes, and helical and straight fiber at a depth of 1.5 m. At the surface, broadband stations and 3C geophones (yellow triangles and squares) are recording continuously for microseismicity analysis. Fiber for distributed temperature sensing (DTS) measurements are deployed in each of the three wells.
The FRS fills the gap between the shallower gas-phase injection experiments, such as those in Montana (Spangler et al., 2010) and the Svelvik CO2 Field Laboratory (Eliasson et al., 2018), which are injecting at depths of a few meters to a few tens of meters, and the larger-scale CO2 storage experiments, for example at Sleipner in Norway (Arts et al., 2008), Quest in Canada (O’Brien and Halladay, 2021) and Ketzin in Germany (Ivandic et al., 2015), which are injecting large volumes of supercritical CO2 at significantly greater depths.
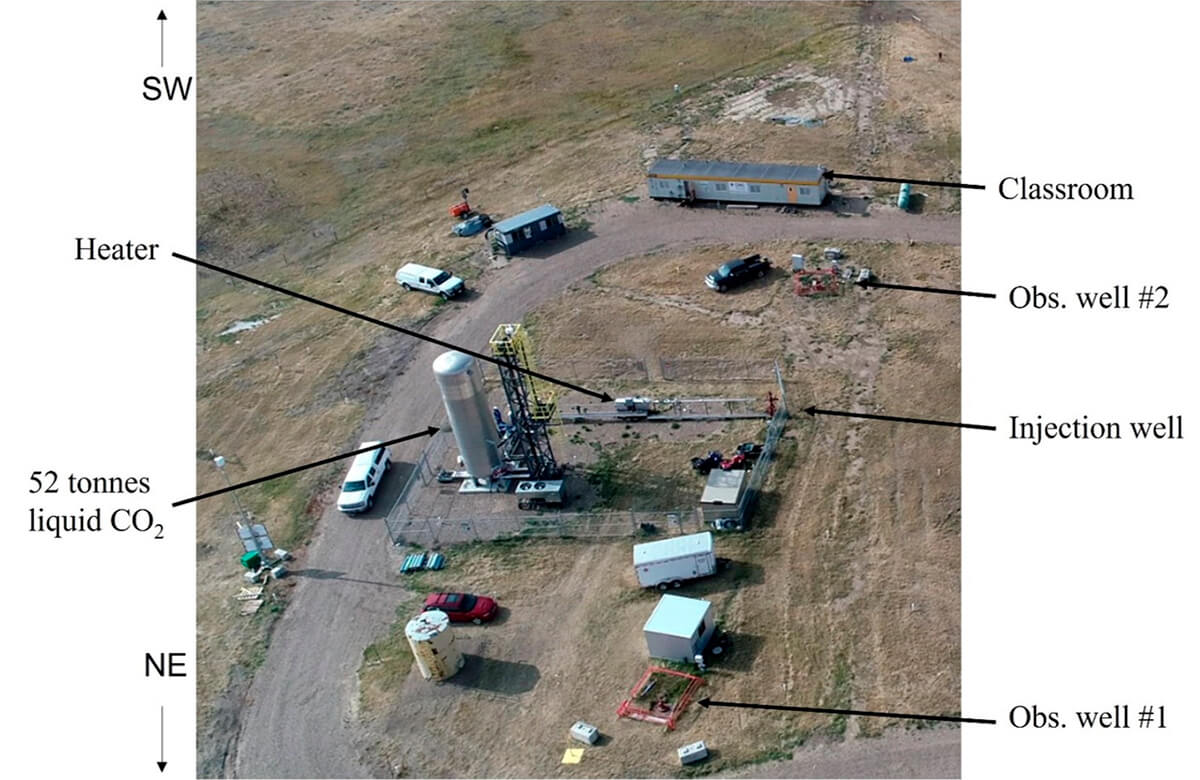
Figure 2 is a photo of the FRS, taken from a drone looking SW. The CO2 injection line comprises a 52 T liquid CO2 tank, a controllable pump, and a controlled heater which converts the liquid CO2 into gas.
Injection
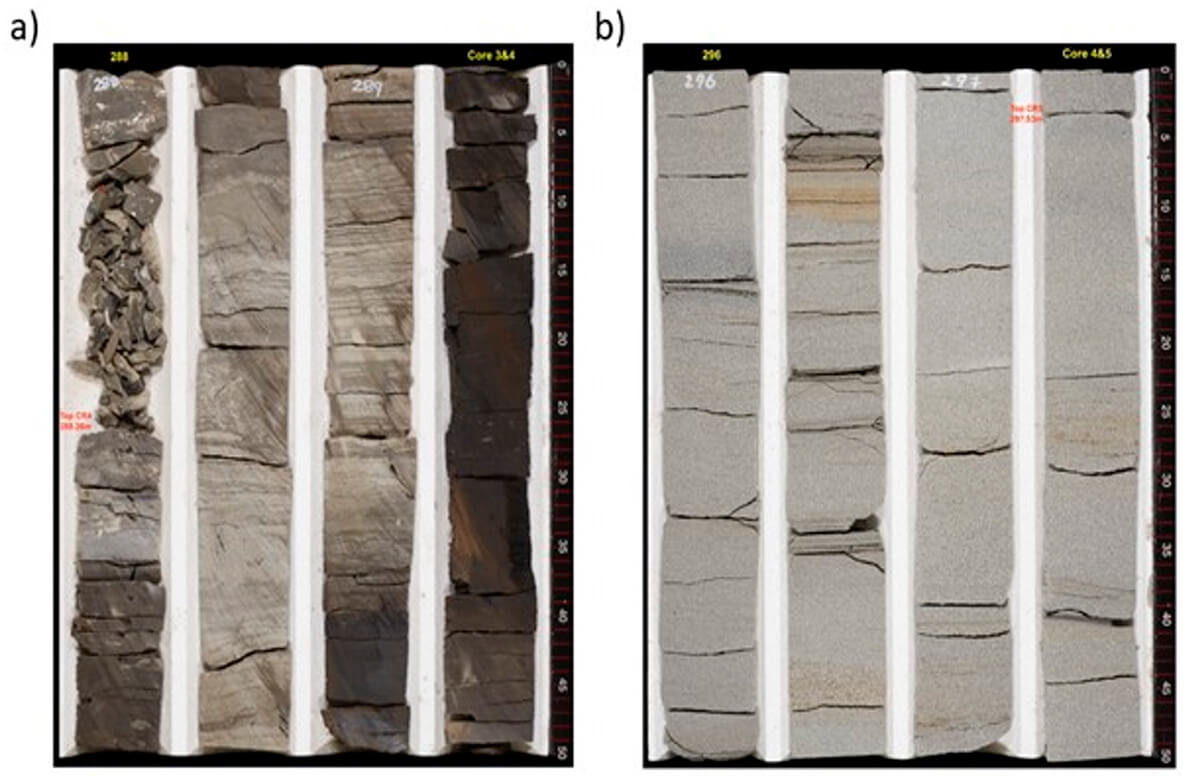
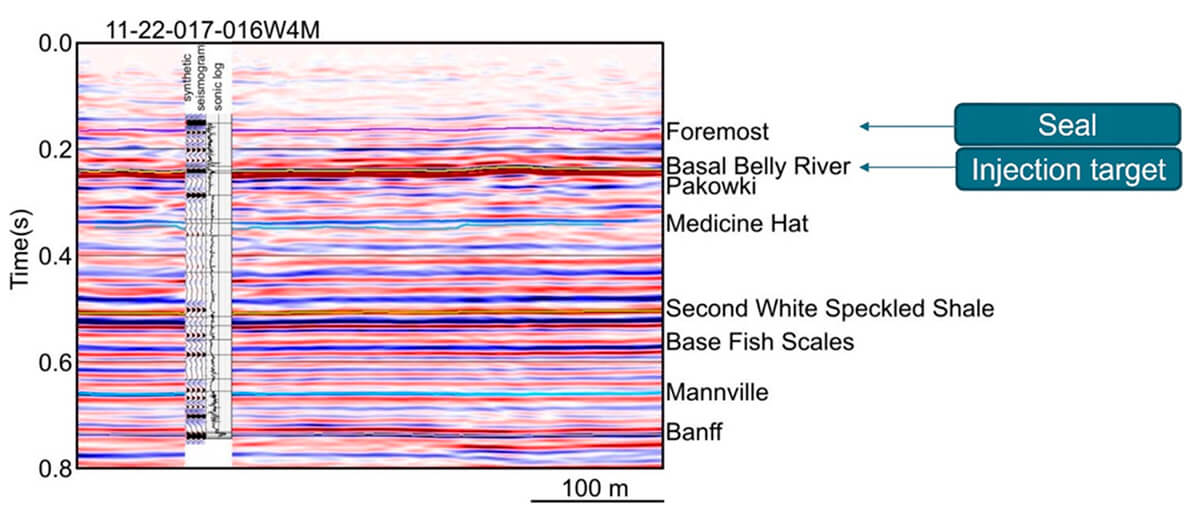
The subsurface injection target is the Upper Cretaceous Basal Belly River Sandstone (BBRS) located from 295 mKB to 302 mKB. It is a seven-meter thick, upper shoreface, fine- to medium-grained sandstone, composed mainly of poorly to well-sorted, angular to subangular quartz grains, (Fig. 3b). Various routine and special core analyses provide direct observations of the reservoir properties of the BBRS (Dongas and Lawton, 2015; Vocke et al., 2016; Muravieva et al., 2017; Jafari Raad et al., 2021). These data, particularly the special core analyses, were used to estimate the injection zone’s porosity (11% average) and permeability (0.3 - 0.8 mD) that were used to successfully match injection zone parameter histories (Jafari Raad et al., 2021). Recent studies of nearby BBRS core yield results similar to previous work, and suggest that the low injection zone permeabilities at the FRS are related to a combination of depositional processes and diagenetic effects that vary systematically, as a function of geographic position along the paleo-shoreline trend. The caprock is the Upper Cretaceous Foremost Formation, a 152-m thick clayey sandstone with interbedded coal layers (Fig. 3a), which provides the overlying seal for the CO2 storage complex (Osadetz et al., 2015).
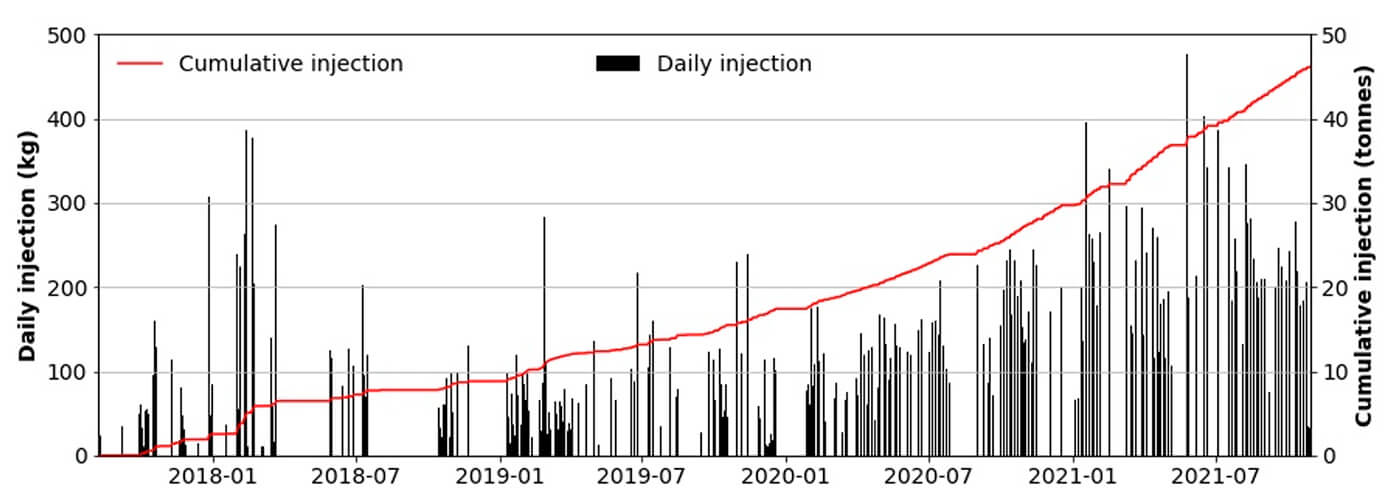
Macquet et al. (2019) used the geostatic model of porosity and permeability developed by Dongas and Lawton (2015, 2016) and worked on reservoir simulations and surface seismic time-lapse feasibility for the FRS. They estimated that, for 1665 T of CO2, injected over five years (with 266 T the first year), the CO2 gas plume should be detectable using surface seismic, as early as one year after injection. However, the pressure-temperature conditions at 300 m depth were such that the injected gaseous CO2 became liquified near the base of the well, which reduced the injectivity rate (Jafari Raad et al., 2021, 2022). This phase transition and the lower permeabilities have prevented us from injecting continuously. After four years of operation, close to 40 T have been injected (Fig. 4).
Continuous Pressure and Temperature Monitoring
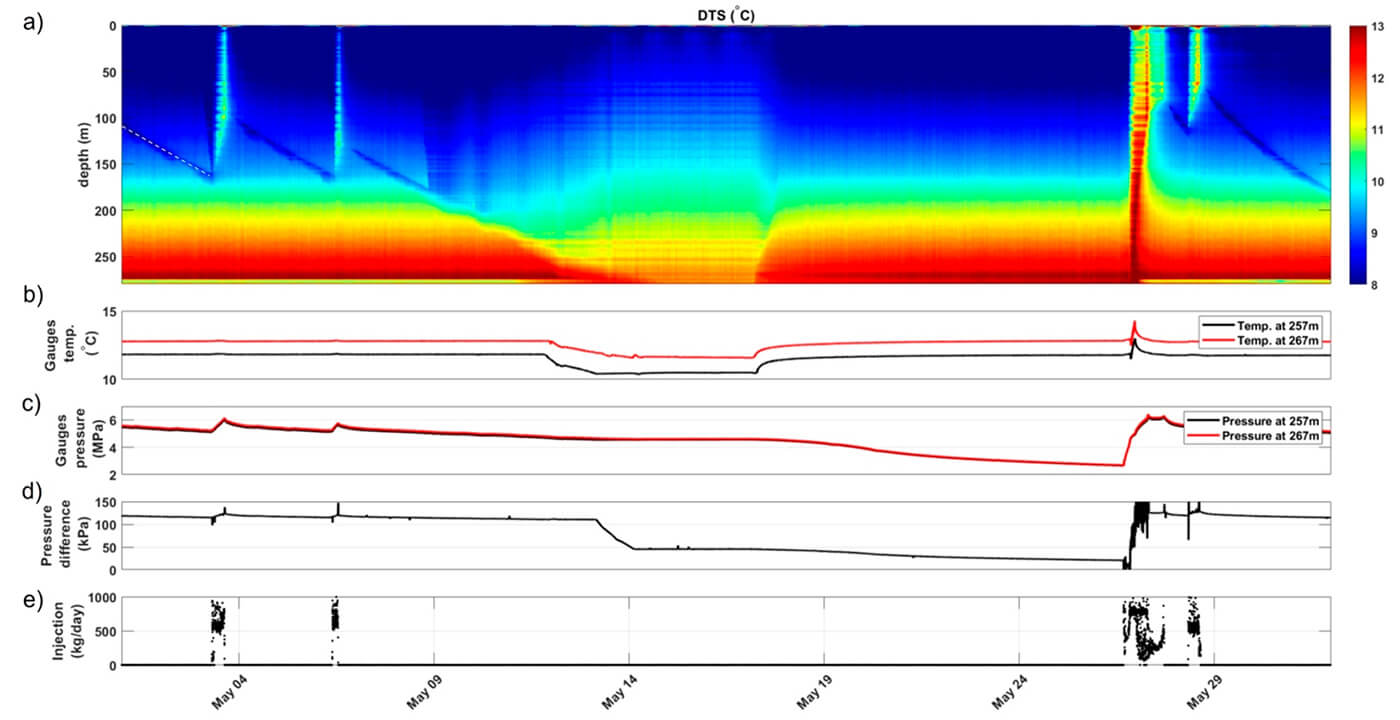
The injection well is equipped with two sets of pressure and temperature gauges at the wellhead, at 257 m and 267 m depths. Observation well #1 (30 m NE of the injection well – the blue dot on Fig. 1) is equipped with two sets of pressure and temperature gauges, at 285 m and 291 m depths. Fibers for distributed temperature sensing (DTS) are deployed in all three wells: down to 280 m depth in the injection well and down to 340 m depths in the two observation wells. Figure 5 shows an example of DTS data from the injection well, the downhole pressure and temperature in the injection well, and the injection rate for the period May 1–31, 2021. The downhole temperature increased during each injection period (May 3, 7, 26, and 28) due to the CO2 being heated before injection. Between May 7–26, we observed that the temperature recovered and returned to the baseline gradient. The pressure difference between gauges at different depths enabled us to determine the phase of the CO2. Figure 5c shows the pressure difference between the gauges at 267 m and 257 m depths.
The pressure difference gives us insights on the phase of the CO2. One of the challenges at the FRS is the change of phase of the CO2 due to the low pressure and temperature of the injection at 300 m depth. The CO2 is injected as gas but can become liquified when it reaches the bottom of the injection well. The density of liquid CO2 is higher than gaseous CO2, and so the injectivity is lower when the CO2 is liquid. On Figure 5c, we can observe a pressure difference higher than 100 kPa until May 13, meaning the liquid level is at least higher than 257 m depth (upper gauge). Between May 13 and May 14, we can observe a sharp decrease in the pressure difference due to the liquid level slowly decreasing. Once the injection resumes on May 26, the pressure difference jumps to 120 kPa, a sign that the well is being filled with liquid CO2.
The data acquired continuously since 2017 enables production history to be matched to our reservoir models, to better understand the reservoir parameters, and to refine our reservoir simulation results (Jafari Raad et al., 2021, 2022).
Geophysical Monitoring
Active seismic surveys
The 3D seismic surface baseline for the FRS was acquired in 2014 (Hall et al., 2016a, 2016b; Isaac and Lawton, 2016). The seismic volumes showed continuous and flat reflectors, with a strong reflector at 0.25 s two-way traveltime (TWT), corresponding to the BBRS injection target (Fig. 6). PP and PS seismic data volumes will be compared to future surveys for surface seismic time-lapse monitoring (Macquet et al., 2019). The injected CO2 changes the properties of the reservoir mainly because its density and bulk modulus are different that the ones of the in-situ brine. The properties will change the elastic parameters of the reservoir (Vp, Vs, and density) and so influence the seismic results. We can analyse the differences between seismic data acquired before and after the CO2 injection (amplitude difference, time-shift) and attribute them to the effect of the injected CO2.
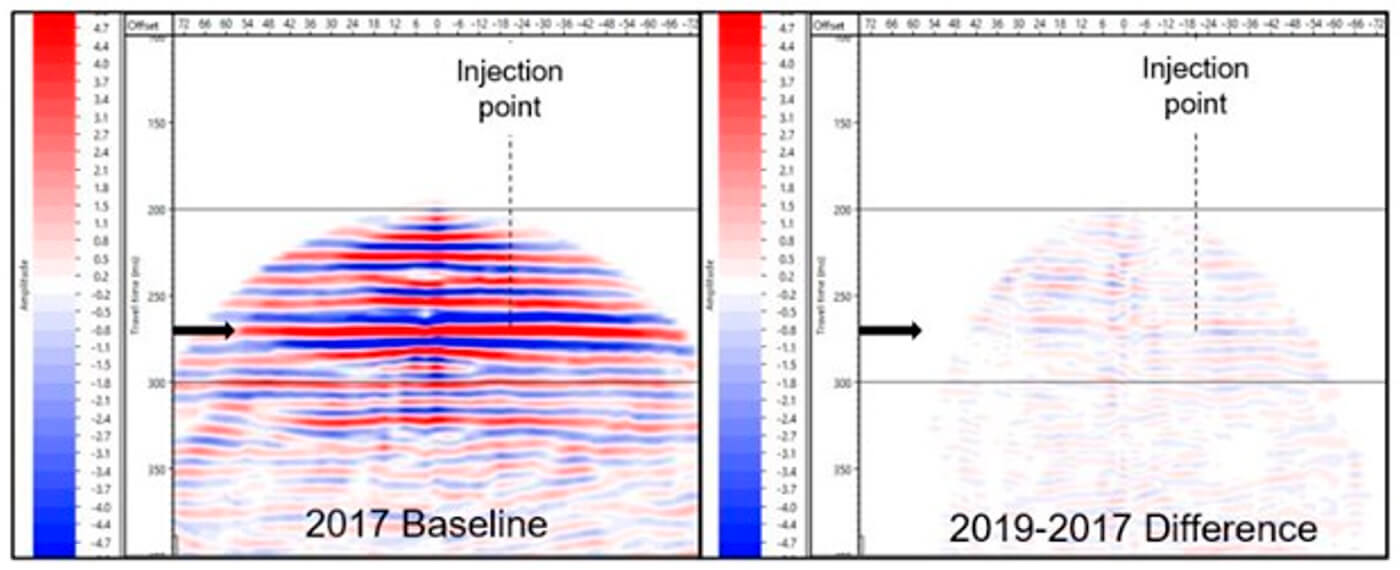
The active surface seismic is less able to detect the small amount of injected CO2 than the vertical seismic profiles (VSP), so the focus in the last few years was on VSP surveys. Several VSPs have been acquired and analysed with the goal of quantifying the threshold detection of CO2. The first VSP was acquired in 2015 (Hall et al., 2016a, 2016b; Gordon et al., 2017). It consisted of a walkaway and a half-walkaround survey recorded on a temporary 3C ESG SuperCable, deployed from 106 m – 496 m in the injection well. Since then, VSPs have been regularly acquired in observation well #2 using the permanent downhole 3C geophone array (191 m – 306 m) to estimate the CO2 detection threshold (Kolkman-Quinn and Lawton, 2021).
Figure 7 shows results from the 2017 survey, and the difference between the 2019 and 2017 surveys. Only 17 T of CO2 were injected in the time period between the two surveys, making the analysis challenging. A lot of effort was focused on data processing, addressing the repeatability issues found in time-lapse monitoring, and improving the results. Kolkman-Quinn and Lawton (2021) concluded that the 17 T of CO2 are not yet detectable. Since then, more CO2 has been injected, surveys have been repeated, and time-lapse results are more promising. Data processing analyses and interpretation are ongoing.
Several surface seismic experiments were also conducted at the FRS. These included the 2018 S-wave seismic surveys, which enabled us to produce a reliable shear velocity near-surface model (Isaac et al., 2019). The S-wave model is indispensable for active source seismic processing.
Distributed Acoustic Sensing
Over the past few years, distributed acoustic sensing (DAS) has emerged as a powerful geophysical tool for imaging and monitoring (e.g., Mateeva et al., 2014). A 5 km loop of optic fiber was installed at the FRS, using straight and helical fiber in observation well #2, straight fiber in observation well #1, and straight and helical fiber in the 1.1 km surface trench (Fig. 8).
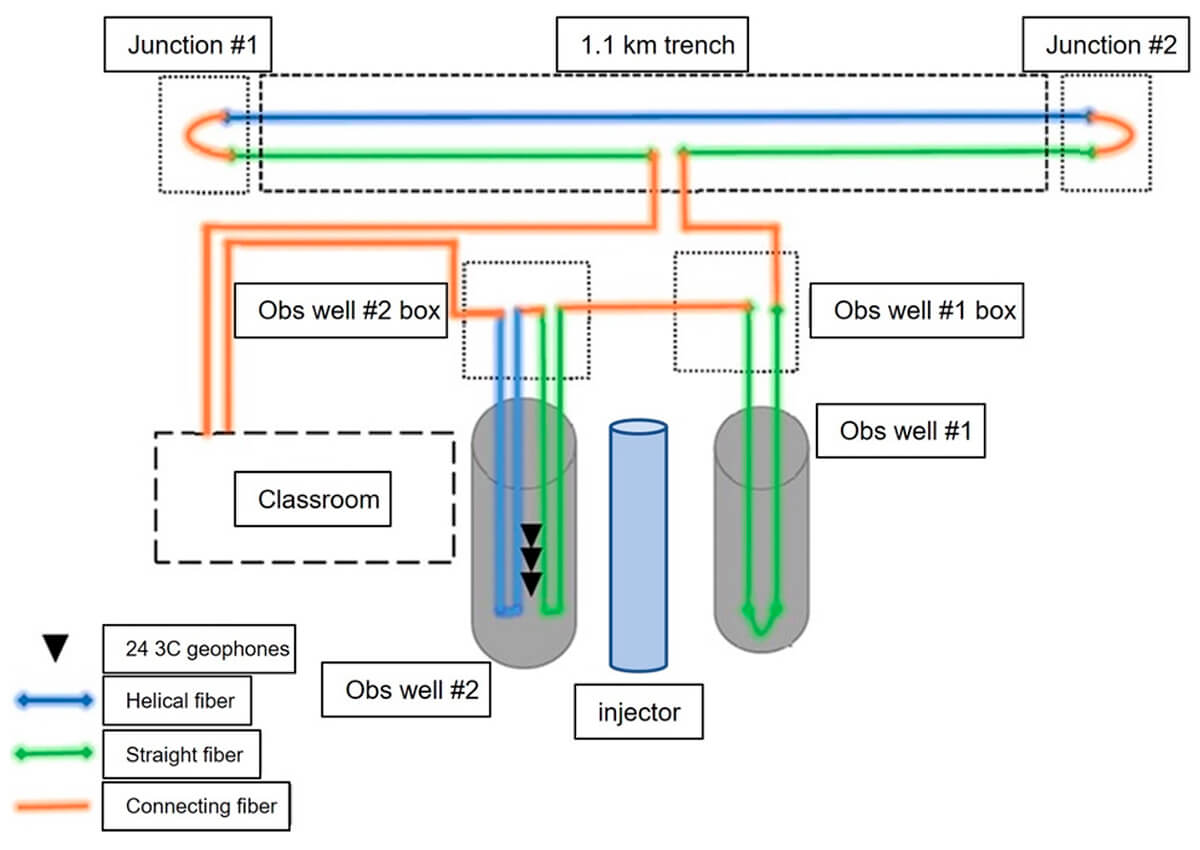
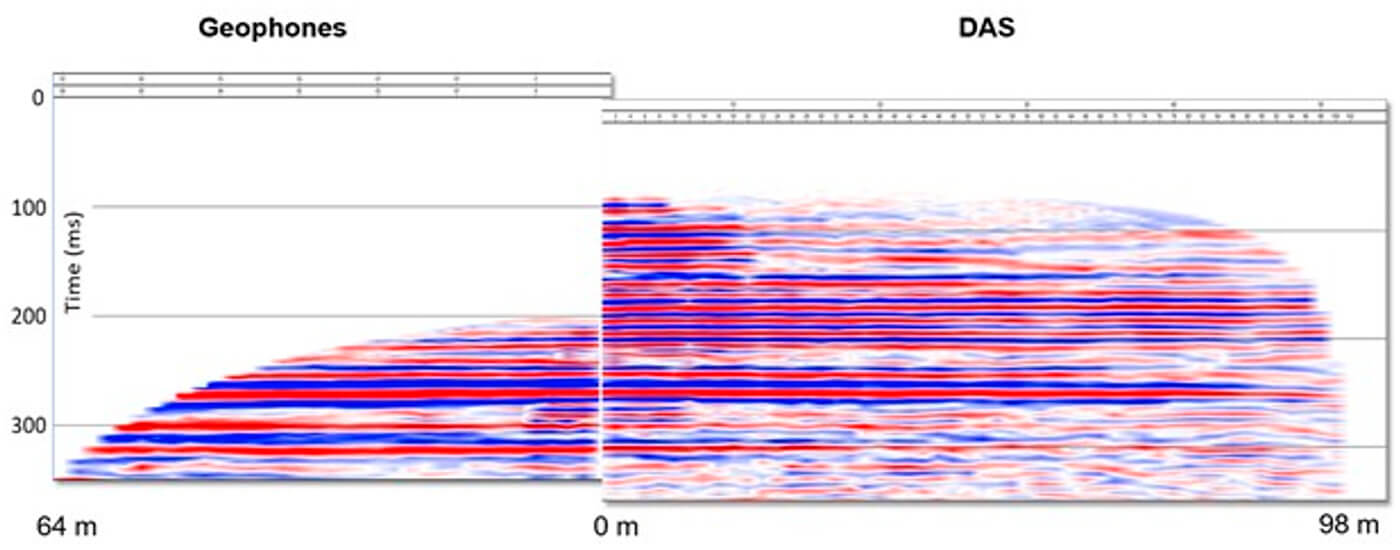
The helical fiber enables us to capture the wavefield in almost all directions, whereas the straight fiber is only sensitive to the direction of the fiber due to its straight directivity. The helical fiber can allow measurement of shear (SV) properties. However, the helical fiber has more complex response and a lower signal-to-noise ratio, making the data more challenging to process. At the beginning of the project, much effort was made to understand the fiber response and calibrate the fiber depth by comparing DAS surveys acquired on both borehole fiber optics and borehole geophones (Gordon and Lawton, 2018; Gordon et al., 2018, 2019; Hall et al., 2018a, 2018b, 2019, 2020a, 2020b). Figure 9 shows a comparison between VSP CDP sections from the geophones and DAS data. There is an excellent match between the two sections, even though the geophone and DAS datasets measure different attributes (i.e., geophones measure velocity, DAS measures strain rate). One of the advantages of the DAS data is the increase in vertical and horizontal coverage. One of the main challenges is converting the strain (or strain rate) measured by the DAS into particle velocity information (recorded by conventional geophones). Monsegny et al. (2021a) are developing a method to address this challenge and to better understand the information recorded by the DAS technique.
The permanently installed fiber optics enable us to easily acquire surveys to explore the potential of using DAS data for CO2 injection monitoring (Wang and Lawton, 2021). One of the challenges is the question of possible differences with the DAS data recorded, when using interrogators from different vendors. An interrogator transforms the back-scattered light from the fibre optic cable into digital seismic signal. Interrogators are interchangeable, but the fibre is usually installed permanently. This could potentially interfere with the interpretation of time-lapse results (e.g., recording parameters, frequency range of the output signal, etc.). We have tested and compared numerous interrogator units to explore the differences between them (Monsegny et al., 2021b) and have assessed the possibility of using different vendors for time-lapse monitoring studies.
DAS data collected at the FRS are also used to test the application of a full-waveform inversion (FWI) method (Qu et al., 2021a) and to characterize the near-surface through surface wave dispersion inversion of DAS data acquired along the trench (Qu et al., 2021b). FWI determines high-resolution, high-fidelity velocity models of the subsurface. This velocity model improves the stack and increases the frequency content and the velocities can be used for pore pressure work. These velocities can then be used to try to identify CO2 leaks outside the reservoir, track pressure fronts and CO2 saturation levels over time, and to improve the accuracy of flow simulations and history matching to production data (Meadows and Cole, 2013).
Continuous seismic recordings
Microseismicity monitoring is an important safety monitoring approach in CCS projects. As we inject CO2 underground, we increase the pressure of the reservoir, which may create micro-fractures or open pre-existing fractures. We employ a variety of pressure gauges, which enable us to verify that we are not exceeding the fracture pressure. The analysis of the continuous seismic data enables us to record any microseismicity at the site.
We are recording microseismicity on the following instruments:
- 7 broadband stations, since 2015 (yellow triangle on Fig. 1).
- 28 surface geophones (from 2 m – 640 m offset from the injection well), since May 2019 (yellow squares on Fig. 1).
- 24 borehole geophones located in observation well #2 (from 191 m – 306 m depth), since January 2020 (green circle on Fig. 1).
Savard et al. (2020) tested several different microseismic detection approaches, such as recursive short-term averaging/long-term averaging (STA/LTA) (e.g., Trnkoczy, 2012); fingerprint and similarity thresholding (Yoon et al., 2015); matched-filter detection (e.g., Chamberlain et al., 2017); and the matrix profile approach (Zimmerman et al., 2019). They detected thousands of microseismic events, mainly during the spring period. Events were primarily located in the shallower 150 m above the reservoir as a results of ground thawing. To date, we do not see a clear correlation between microseismivity and CO2 injection.
We also use the continuous seismic data recording for ambient noise correlation studies (Macquet and Lawton, 2019a, 2019b; Macquet et al., 2020a, 2020b). It was demonstrated that we can recover the approximated Green’s function between two stations by correlating the continuous ambient noise recorded at these two stations (e.g., Shapiro and Campillo, 2004). The Green’s function (also called the transfer function) is the surface response to a Dirac’s delta source (impulsive source containing all frequencies). In practice, only an approximation of the Green’s function is recovered, due to instrumental limitations and attenuation. The method can be used for tomography outcomes: because the receivers are located on the surface, the surface wave is dominant in the recovered Green’s function. Dispersion curves of the surface waves can be computed and inverted to recover the S-wave velocity models (Macquet et al., 2020a, 2020b). The recovered near-surface model shows similarities with the one obtained by Isaac et al. (2019) using an active S-wave source. The main advantage of using the seismic ambient noise is that the method is based on passive recordings, lowering the cost, compared to active surveys. Another advantage is the possibility of studying the near-surface conditions, as the ambient noise tomography is based on continuous recording of the noise field. Possible outcomes are the possibility of producing seasonally-based near surface models that can be used for active seismic processing, and the possibility of tracking changes in the subsurface due to CO2 injection. Indeed, the Green’s function is dependant on the elastic properties of the medium, and if the elastic properties change due to CO2 injection, the resulting Green’s function will also change. We can track those temporal changes, so use ambient noise correlation for monitoring purposes (e.g. Mordret et al., 2014).
Using continuous seismic data, Khadangi et al. (2021) analysed the horizontal-to-vertical spectral ratio, and showed changes in the spectrum due to ambient temperature and precipitation. The very different weather conditions between winter and summer on the Alberta Plains (e.g., up to 80℃ temperature variation between summer and winter, snowfalls, high-speed wind) make the near-surface conditions challenging for active surface seismic, but enable us to test the working range of the instrumentation.
One of the main advantages of the ambient noise correlation method is its low cost (no need for human-driven sources), but somewhat inconvenient are the large volumes of data and the lower-resolution results, compared to those from conventional active seismic surveys.
Electrical resistivity tomography (ERT)
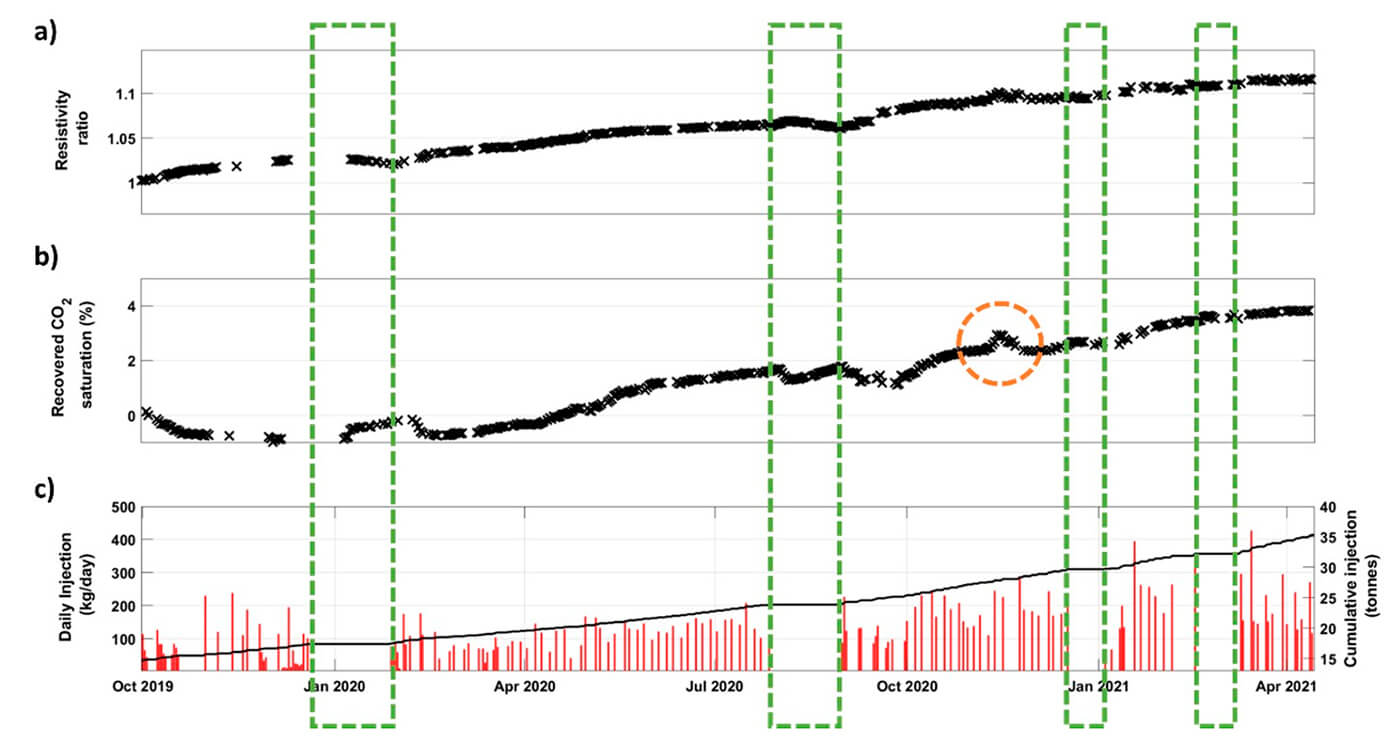
The FRS hosts 128 permanently installed electrodes: 112 along the 1.1 km trench (Fig. 1) and 16 in observation well #2, between 250 m to 325 m depth. Electrical resistivity tomography (ERT) is a well-established geophysical method for near-surface imaging, due to its high sensitivity to the presence, and composition of, the pore fluids (e.g., Binley and Kemna, 2005; Loke et al., 2013). The high resistivity contrast between injected CO2 and in-situ brine makes the use of electrical methods particularly useful for CCS applications (e.g., Carrigan et al., 2013; Schmidt-Hattenberger et al., 2014; Bergmann et al., 2017). Considering the small volume of CO2 injected at the FRS, we are focussing on the detection threshold, and the possible application of using ERT as an early leakage detection tool (Macquet et al., 2021; Macquet et al., submitted). We have been running daily borehole surveys since September 2019 and are computing the resistivity ratio, which can be directly related to CO2 saturation (Guéguen and Palciauskas, 1994). Due to the higher resistivity of the injected CO2 compared to the brine, the resistivity ratio is seen to increase with time, as more CO2 is injected.
Figure 10 compares the raw resistivity ratio (ratio between monitored resistivity and baseline resistivity), the CO2 saturation at 295 m depth recovered from the ERT inversion, and the injection history. The three parameters show a very good correlation, with a continuous increase in resistivity ratio. We observed a slight decrease in the resistivity ratio and stagnation in the CO2 saturation during periods of no injection.
Hydrogeological and Geochemical Monitoring
The geochemical observation well (blue dot on Fig. 1) is located 30 m up-dip of the injection well. It is equipped with a U-Tube sampler (Freifeld, 2009), with a sand-pack inserted between the BBRS injection zone and a screened interval in the well casing. This configuration permits sampling of injection zone waters and gases, used to characterize the pre-injection geochemistry and hydrogeology. The sampler also permits direct sampling of the injected CO2 plume as it arrives at this well, validating geophysical interpretations. The injected CO2 has a minor, but compositionally and isotopically distinctive, argon component that serves as an additional co-injected noble gas tracer of plume migration (Utley et al., 2020).
In addition to the injection, geophysical observation, and geochemical observation wells, we constructed six water wells (each <110 m deep) of variable construction and completion, as well as a large array of very shallow (<2 m deep) soil gas wells. The soil gas wells are used to track the gas migration impact of naturally occurring and injected gases in the groundwater protection zone (<224 m). To date, gas and water samples from these wells confirm the containment of the injected CO2 plume and the isolation of the storage complex from the groundwater protection zone. This is consistent with gas studies from the drilling muds and cuttings, that indicate an upward depletion of methane (CH4) carbon isotopic composition (Mayer et al., 2015), which was elsewhere attributed to naturally occurring diffusional fractionation (Hendry et al., 2016, 2017) and completely consistent with the characteristics of the horizontal-to-vertical permeability anisotropy observed at the FRS.
Several FRS investigators are studying noble gas compositional components in the methane-dominated gases that occur freely, or are dissolved, in FRS formation waters (Fig. 11). The compositional and isotopic variations of these gases are consistent with previous work (Hiyagon and Kennedy, 1992). As such, the noble gas components provide promising potential compositional and isotopic tracers for monitoring gas migration pathways and processes affecting natural CH4-rich gases in the geological and hydrological system (Utley et al., 2020), the injected plume (Gilfillan, 2013), and the natural hydrogeological systems.
The natural hydrogeological system at the FRS exhibits a variation in hydrostatic head that provides the best estimates of initial formation pressure. The hydrostatic head is ~12 m below ground surface in the glacial till and shallowest bedrock system but drops to ~30 m below ground surface in the deeper water wells. Hydrostatic head variations with depth indicate a complicated hydrological system that has higher permeabilities at shallower depths due to joints (fractures). The deeper unfractured bedrock is much less permeable and under-pressured between 62 metres below the ground surface and the base of the BBRS injection zone (Cheung and Mayer, 2009). Groundwater compositions and stable isotope ratios in the shallower aquifers suggest a hydrological connection to the current post-glacial surface water system, in communication with the Bow River south of the FRS. The less permeable, deeper succession has water compositions and stable isotope ratios indicative of “older” formation waters that are pre-Pleistocene in age (Cheung and Mayer, 2009).
The FRS provides a site for developing and demonstrating new monitoring technologies and procedures. Solid earth monitoring of injected plume migration (e.g., Macquet et al., 2019; Radd et al., 2021) discussed above and well integrity studies (e.g., Wigston et al., 2019;;Utting et al., in review) are augmented by atmospheric monitoring (e.g., Alden et al., 2019) that addresses climate policy and regulatory changes to reduce methane emissions at upstream petroleum industry facilities.
Conclusions
The CaMI Field Research Station is a test site at which we are injecting a small amount of CO2 at shallow depth to simulate the gas accumulation at shallow depths resulting from a hypothetical, unplanned leakage of a deep industrial-scale CO2 storage facility. It is a unique site, bridging the gap between large-scale CO2 storage sites and laboratory experiments. The small and controlled amount of CO2 (40.7 T at the end of July 2021) should enable us to determine the threshold of CO2 detection for the different monitoring technologies. We are assessing the use of well-established technologies applied to CO2 injection and monitoring, such as surface-active seismic surveys, vertical seismic profiles surveys, and electrical resistivity tomography. We demonstrate the high sensitivity of ERT to CO2 accumulation: the method can detect a few tonnes of CO2. Well integrity can be a critical issue for CO2 containment and can be a path for CO2 leakage and upward migration. ERT can be used to monitor early leakage along wells where the electrodes arrays are installed. The VSP time-lapse results show that the method is not yet sensitive to 15 T of injected CO2. Since the 2019 VSP survey used in this paper, more CO2 was injected, and new surveys were acquired. Processing is undertaken to determine the detection threshold of the method.
We are also testing novel technologies, such as distributed acoustic sensing and continuous seismic data collection for CCS conformance and monitoring and for reservoir monitoring in general. DAS results are promising, giving a very similar seismic section to the one obtained using conventional geophones. One of the main advantages of using DAS is the better spatial coverage, vertically and horizontally. Future work will be to assess the possibility of time-lapse monitoring, with a focus on assessing the possibility of using different interrogator units. Continuous seismic recordings are used for microseismicity detection, and no correlation between CO2 injection and microseismicity has been found so far. Continuous seismic data are also used to develop new tools for CO2 monitoring, such as using an ambient noise correlation method. As we need to move towards large-scale hub-type projects, monitoring large CO2 plumes might become difficult due to financial and deployment constraints. An effort is made to assess the feasibility of using continuous seismic recordings to monitor CO2 injection and containment. The advantage of using continuous seismic recording is that we can achieve fully continuous monitoring at low cost.
In addition to geophysical monitoring techniques, the CaMI Field Research Station hosts a program of hydrogeological and geochemical tools, enabling us to understand natural and induced gas migration processes, characterize the natural hydrological system, and demonstrate new tools and techniques. To date, gas and water samples from different wells confirm the containment of the injected CO2 plume and the isolation of the storage complex from the groundwater protection zone. In addition to subsurface monitoring, we are testing various cutting-edge technologies for atmospheric methane detection.
The integration of geoscience disciplines is critical in a CCS project, where reservoir engineering, geophysics, geochemistry, hydrogeology, and geology are all connected. The accumulation of huge amounts of data, especially with the use of new continuous monitoring technologies, also requires external competencies, such as data scientists and machine learning experts. The research done at the Field Research Station enables us to improve these areas of expertise, as applied to CCS. The learnings are also directly transferable to EOR operations, geothermal projects, or any reservoir projects.
Carbon Capture and Storage already accounts for one-third of current CO2 management. It is a proven technology that is readily employed, whose importance will increase as volumes of captured CO2 increase and more storage is required. The CaMI Field Research Station enables us to develop the tools that will make this future possible. The present overview shows only a small part of all the research underway at the site, so please feel free to reach out to learn more.

Acknowledgements
CaMI.FRS Joint Industry Project subscribers and sponsors of the CREWES project of the University of Calgary provided financial support for this project. This research was also supported in part through funding from the University of Calgary's Canada First Research Excellence Program: the Global Research Initiative in Sustainable Low-Carbon Unconventional Resources. Funding for the construction of the FRS was provided by the Province of Alberta (Department of Environment and Parks) and from the Government of Canada (Western Economic Diversification). Cenovus Energy, Torxen Energy, and the Alberta Eastern Irrigation District kindly provided access to the site for the Field Research Station to be established. We thank all the researchers who have been working at the CaMI.FRS since the beginning of the project. The list would be too long to mention, but the work and various collaborations have made the Field Research Station a successful project. All the research done at the CaMI Field Research Station is annually compiled into research reports, available to our Joint Industry Project Sponsors and other funders.
Related Reading


Join the Conversation
Interested in starting, or contributing to a conversation about an article or issue of the RECORDER? Join our CSEG LinkedIn Group.
Share This Article