Abstract
Distributed Acoustic Sensing (DAS) is a rapidly maturing fiber-optic technology with numerous applications in geophysical and in-well monitoring, and is being developed in a partnership between Shell and Optasense. DAS transforms nearly any fiber-optic cable into a distributed array of acoustic sensors. Recording data requires a special “Interrogator Unit”, which is connected to the fiber optic infrastructure. Fiber optic cables may be installed in any kind of borehole. Previously the cost, inconvenience, and risk of well intervention associated with conventional downhole geophones made in-well geophysical monitoring expensive and often unfeasible. Permanently installed down-hole fiberoptic cables are ideal for low-cost nonintrusive geophysical monitoring. Once the cable is installed, no further well intervention is required. In order to test this DAS technology, Shell/OptaSense have executed field trials in several locations around the world. One of these locations is the Quest Carbon Capture and Storage (CCS) project in Alberta, Canada.
In the Quest field trials Zero-Offset and Walk-Away VSP data were acquired to assess feasibility of monitoring CO2 containment and tracking the CO2 injection plume. The trials show that, for these applications DAS data can be substituted for geophone data: the Zero-Offset VSP using DAS is capable of deriving good quality checkshot velocity profiles and the Walk-Away VSP DAS image is similar to the corresponding geophone image. After imaging, the DAS Walk-Away VSP images are quite repeatable (NRMS=15%), a requirement for a successful time-lapse survey. In summary, this work demonstrates that it is feasible to use VSPs data recorded with DAS for geophysical measurement, monitoring, and verification.
Introduction
Distributed Acoustic Sensing (DAS) is a rapidly maturing fiber-optic technology with numerous applications in geophysical and in-well monitoring. DAS transforms nearly any fiber-optic cable into a distributed array of acoustic sensors. DAS is being considered as a permanent borehole The three societies (CSEG, CSPG and CWLS) are working closer together than ever, and this looks to continue for the foreseeable future. The momentum of these three societies working together has great technical, economic and networking upside.
Distributed Acoustic Sensing (DAS) is a rapidly maturing fiber-optic technology with numerous applications in geophysical and in-well monitoring. DAS transforms nearly any fiber-optic cable into a distributed array of acoustic sensors. DAS is being considered as a permanent borehole seismic sensor array for Zero-Offset Walk-Away, and 3D VSPs, refraction seismic, cross-well seismic, downhole microseismic monitoring, and as a permanent surface seismic surveillance system. To record data requires a specialized Coherent Optical Time Domain Reflectometer (C-OTDR) unit referred to as an “Interrogator Unit” or “IU”, which is connected to the fiber used for measurement. Currently, an entire (~4 km) cable can be sampled at a rate of up to 20 kHz. At this rate, the IU injects laser pulses into the fiber, and as the fiber is strained by external acoustic disturbances, the IU processes and records the changes in the back-scattered light. Processing divides the fiber into a distributed array of acoustic sensors, which results in data that is comparable to conventional seismic data recorded on geophones. This technology is being developed by Shell through an exclusive agreement with OptaSense, a subsidiary of QinetiQ U.K.
Fiber optic cables may be installed in any kind of borehole, and routinely multiple fibers are included in a single cable, which can allow DAS measurements in conjunction with other fiber optic techniques such as Distributed Temperature Sensing (DTS). Previously the cost, inconvenience, and risk of well intervention associated with conventional downhole geophones made in-well geophysical monitoring expensive and often unfeasible. Permanently installed down-hole fiber-optic cables are ideal for low-cost nonintrusive geophysical monitoring. Once the cable is installed, no further well intervention is required and repeat surveys only require additional seismic source efforts. Often DAS offers the only viable alternative for collecting downhole seismic data.
In order to test this DAS technology, Shell/OptaSense have executed field trials in several locations around the world. The proof of concept for DAS was provided in a tight-gas development in Canada in September 2009, which resulted in a program for further development of the IU and additional field trials. Here we discuss the results of the field trial in the Quest Carbon Capture and Storage (CCS) project in Alberta, Canada.
Quest
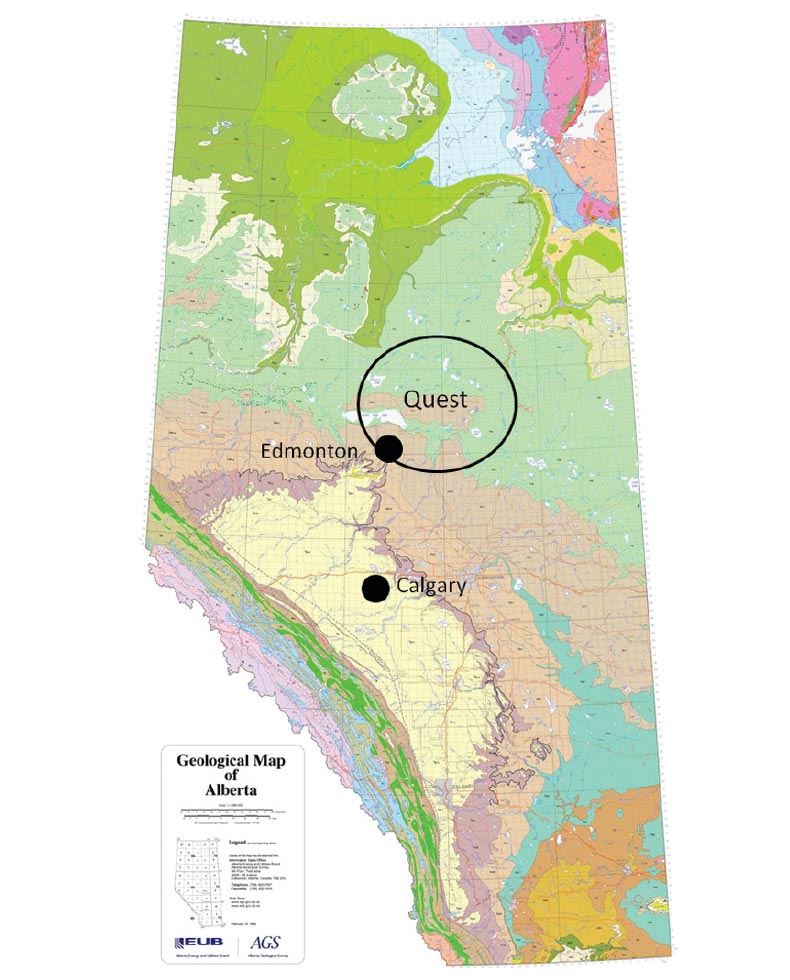
The Quest Carbon Capture and Storage (CCS) Project is a fully integrated CCS project being advanced on behalf of the Athabasca Oil Sands Project, a joint venture among Shell Canada (60 per cent) Chevron Canada Limited (20 per cent) and Marathon Oil Canada Corporation (20 per cent). Quest is designed to reduce direct greenhouse gas emissions from the Scotford Upgrader by up to 35% (Figure 1). To accomplish this goal, the Quest Project will capture, transport, inject, and store 1.08 million tonnes of CO2 per annum in the Basal Cambrian Sandstone (BCS). The injection will take place for an expected 25 years and at least 10 years.
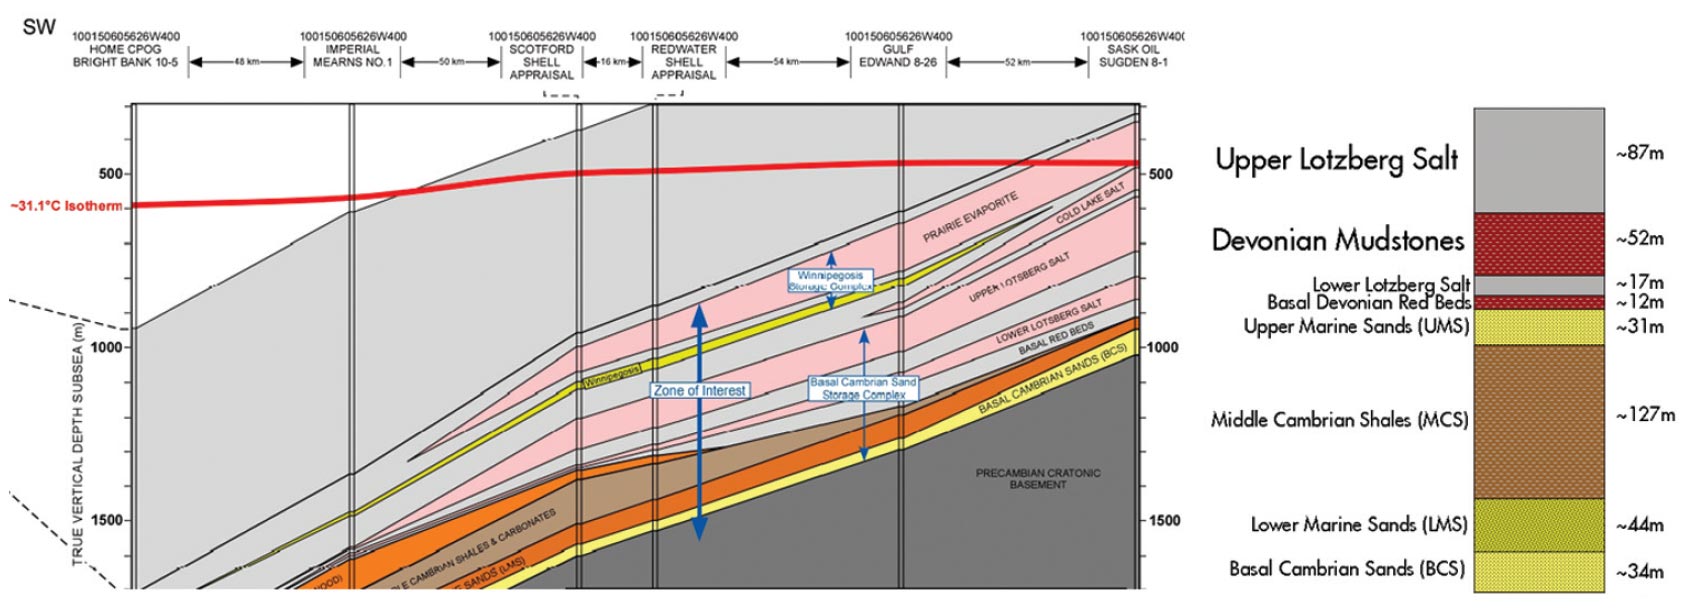
The BCS is the deepest sedimentary formation located directly above the Pre-Cambrian basement, at a depth of approximately 2050 m below ground level (Figure 2). The average net thickness of the BCS is about 40 m. The CO2 will be contained within the BCS storage complex comprising the BCS and three regionally extensive seals – in ascending order these are: the Middle Cambrian Shale (MCS), Lower Lotsberg Salt, and Upper Lotsberg Salt. The combined thickness of these three main seals is greater than 120 m, above which there is more than 1500 m of additional rock before reaching the Base of Ground Water Protection located at a depth of c. 150 m below the surface.
Between three and eight injectors will support the required rate of CO2 injection with a base-case expectation of five injectors. The prime means of demonstrating the performance of the Quest CO2 storage site is a program of Measurement, Monitoring and Verification (MMV). The aim of MMV is to provide assurance that the stored CO2 remains permanently contained and that geological storage of CO2 provides an acceptable and cost-effective means of mitigating climate change.
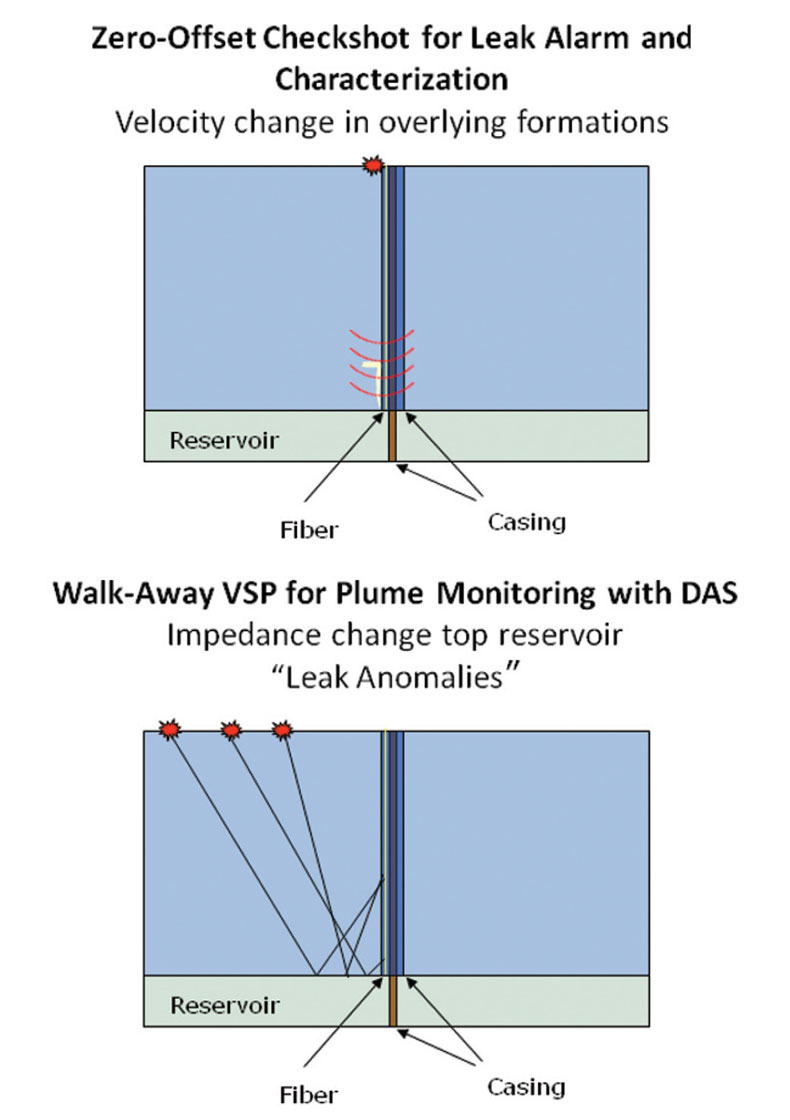
The Quest field trial was executed in September 2010. The objective of the field trial is to test the feasibility of recording VSP data, and DAS data in particular, as a Measurement-Monitoring- Verification (MMV) tool for the Quest CCS Project. In this field trial Zero-Offset and Walk-Away VSP data were acquired to assess feasibility of, monitoring CO2 containment and tracking the CO2 injection plume. Here we discuss the results of this field trial.
Field Trial
The Quest field trial made use of one of the Quest appraisal wells, which is an almost vertical well, having a TVD of 2133 m. A Zero-Offset and Walk-Away VSP were acquired.
The VSPs were recorded on both geophones and a DAS fiber optic cable that was installed in the well. The 65-level geophone array comprised geophones spaced at 15m intervals and was magnetically clamped inside the casing in the borehole. For the Zero-Offset VSP, the survey was repeated six times by moving the array to different levels to accomodate a desired depth level spacing of 7.5 m over the interval 22.5 m to 2085 m. For the Walk-Away VSP, with desired level spacing of 15 m, with interval 180 m to 2090 m, only three geophone array settings were required.
A fiber optic DAS cable is permanently installed in the appraisal well in between two casing strings. The DAS cable starts at the surface and goes within 100m target of top BCS. The DAS system has a 10m spatial resolution (determined by IU properties), which results in 204 DAS channels (depth interval of 10m for 2040m DAS cable). The cable contains three Single Mode (SM) fibers, which are used for DAS recording.
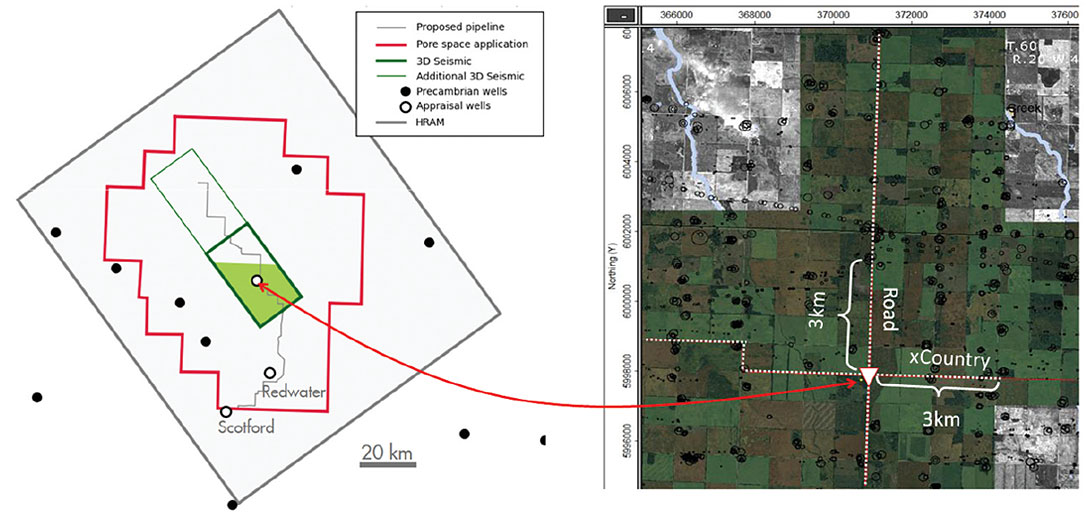
For the VSP aqcuisition vibrator sources were used. The Zero- Offset VSP source point was located at a distance of 102m South- East of the wellhead. For the Walk-Away VSP two shot lines were acquired:
- North-South line was shot on the road: 3km maximum offset to the South, and 9km maximum offset to the North.
- East-West line was shot across the field: 5.5km maximum offset to the West, and 5.5km maximum offset to the East.
The offsets up to 3km were aimed to record reflection seismic and had a source spacing of 25m. The offsets from 3-9km to the North had a source spacing of 100m and was used for recording refraction seismic.
Comparison between DAS and Geophone data
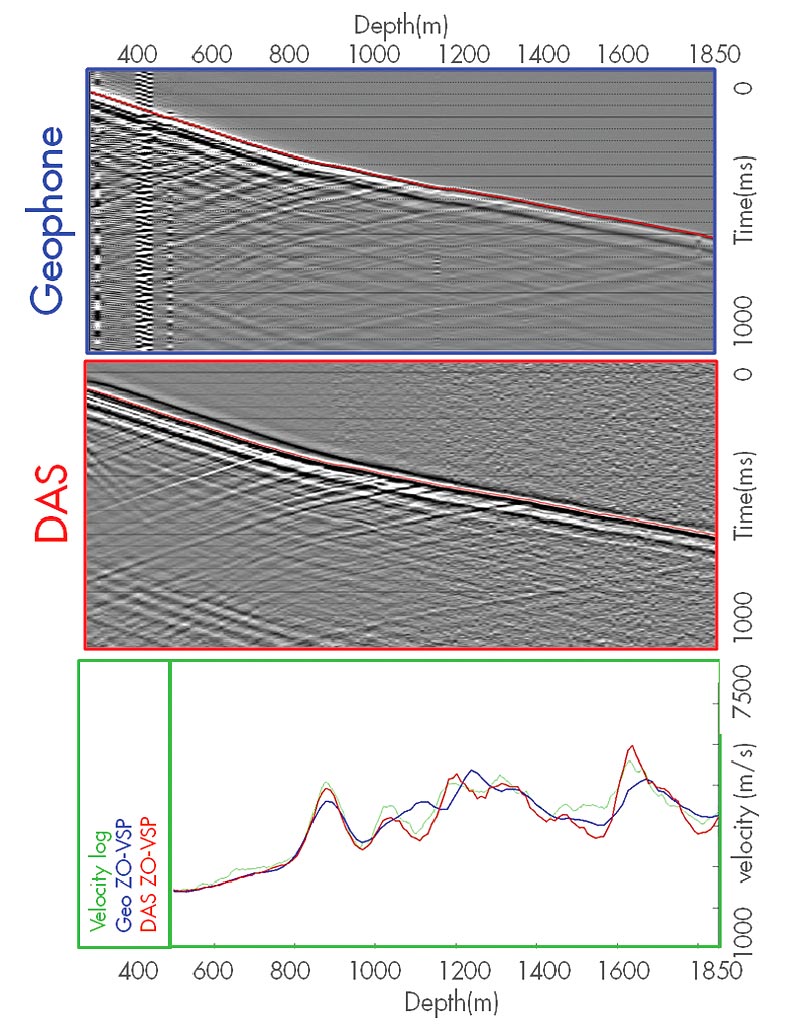
After recording, both the geophone and DAS data are correlated with the vibrator sweep to produce common shot gathers (CSG), as shown in Figure 5. This figure shows a comparison between the geophone data (top) and the DAS data (middle) for a Zero-Offset CSG. From this comparison, it can be observed that:
- The DAS phase is stable.
- The DAS first arrivals are strong to TD (2km).
- Strong reflections are observed on DAS, which are similar to geophone reflections.
- The signal to noise ratio is lower for the DAS data versus the geophone data.
- The frequency spectra for geophone and DAS are comparable, but the geophone data have slightly higher frequency content.
Zero-Offset VSP
From the Zero-Offset VSP a checkshot can be derived, which is a direct measurement of the first arrival travel time between the surface and the receivers in the well. This measurement, demonstrated in Figure 5, can be used to determine the time-to-depth relationships at the well location, and the receiver spacing divided by the difference in first arrival time difference between two receivers gives the interval velocity: v=dz/dt. In the Zero-Offset VSPs, recorded at both the geophones and the DAS, the first arrival is picked (red lines in the upper two images). Note that the DAS record is a stack of 22 sweeps, while the geophone record is only a stack of two sweeps. Less sweeps are available for the geophone data, as six levels were required to cover the entire depth range.
Once the first arrivals are picked, the derivative of the picked time to depth is calculated, which results in the velocity profiles shown at the bottom image in Figure 5. The velocity profiles derived from the geophones (blue) and the DAS (red) match the velocity log (green). However, the geophone profile has anomalous peaks around 1200m and 1400m depth. These are caused by the multiple geophone array settings. In the transition from one array setting to the next array setting the receiver spacing might differ from the assumed receiver spacing (7.5m), causing anomalous velocities as they are calculated based on depth versus time derivatives. The DAS velocity profile does not suffer from this, because the DAS cable is one permanent continuous array of receivers that does not require multiple level settings.
Walk-Away VSP
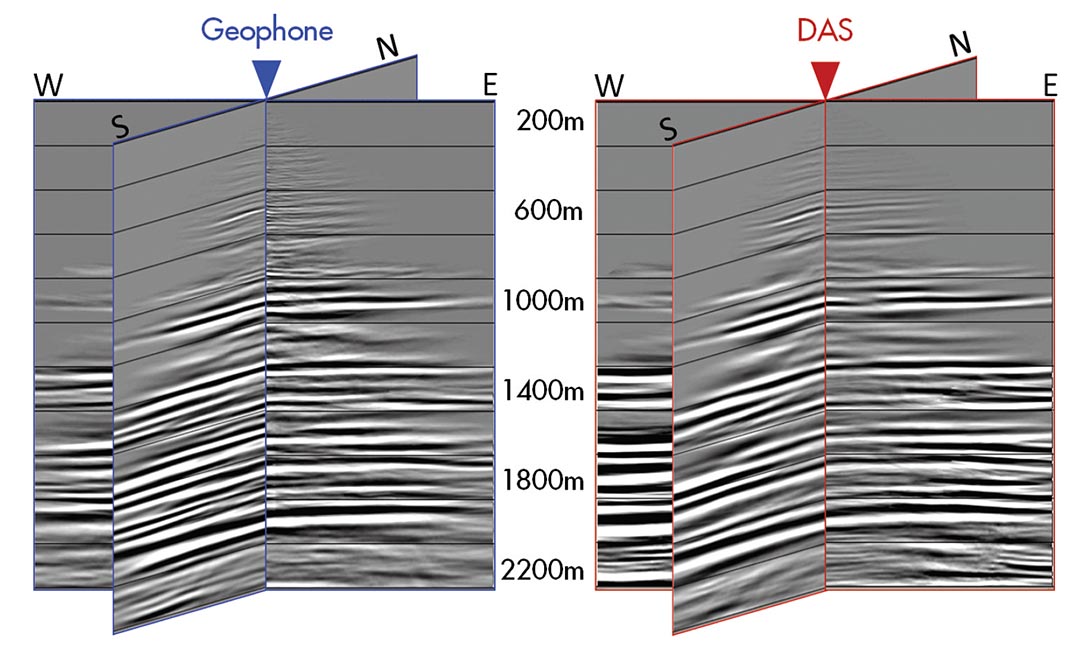
The Quest field trial contained two Walk-Away VSP lines: North- South and East-West. The processed Walk-Away VSP data will effectively provide a short 2D seismic line centered on the wellbore. Figure 6 shows the results after processing and migrating both the DAS and geophone datasets in exactly the same way. From this we can observe that:
- The DAS and geophone VSP images are very similar.
- The frequency content of the DAS VSP images is slightly lower than the frequency content of the geophone VSP image, which is to be expected, as the frequency content of the raw DAS data was also slightly lower.
- Both DAS and geophone images are rather smooth because an imaging dip limit was applied to prevent imaging noise.
- The North-South and East-West lines combine, which indicates that the processed results of both lines match well.
Overall, the DAS data result in a VSP image comparable to the geophone images, showing that DAS can replace geophones in the Quest MMV plan.
Is DAS suitable for time-lapse measurements?
In time-lapse measurements, the variations to be observed should be caused by variations in the subsurface, and not by variations in the measurement. – It is important that the repeatability of the seismic measurements is as high as possible. The repeatability is the variation in measurements taken under the same conditions. Here, the repeatability for the DAS VSP data will be analyzed.
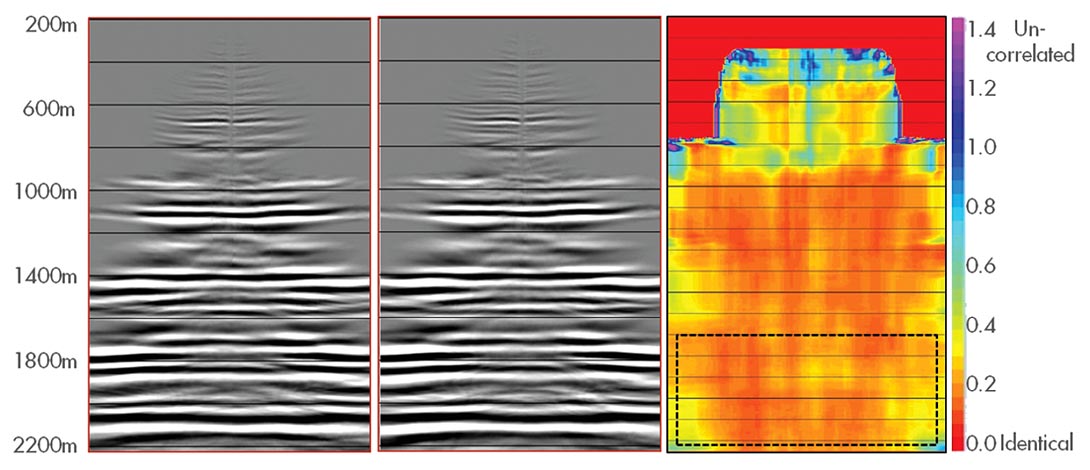
The North-South line was shot three times, as the geophones needed multiple settings to cover the entire well. This means that we can do a repeatability analysis for the DAS Walk-Away VSP image. As a quality attribute for repeatability, NRMS is used:

The NRMS is within the range of 0 < NRMS < 2, whereby:
- NRMS = 0, 100% repeatability – monitor and base data are identical;
- NRMS = 1.4, 0% repeatability – monitor and base data are uncorrelated;
- NRMS = 2.0, monitor and base data have same but opposite-sign amplitudes.
This means, the lower the NRMS, the higher the repeatability of the data.
In quoting repeatability, we use final images only – raw DAS data repeatability is lower than geophone repeatability due to the higher noise floor on DAS data.
We consider the repeatability of the DAS VSP images from data recorded on day 1 and day 4 (Figure 7). The right hand picture in Figure 7 presents a color plot of the NRMS, which shows that the repeatability is quite high in the area of interest (NRMS=0.15 in a 300ms gate around the reservoir @ 2km). This repeatability is quite good, as the NRMS needed to conduct a successful timelapse survey, is believed to be NRMS=0.2.
Conclusions and Outlook
We conclude that DAS acquisition can replace geophone acquisition for Quest and the Quest Venture has decided to include DAS in the MMV plan. Also it has been shown that Zero-Offset VSP using DAS is capable of deriving a good checkshot velocity profile, and that for the Walk-Away VSP, the final DAS image is similar to the geophone image. The DAS Walk-Away VSP images are quite repeatable (NRMS=0.15).
Further development of the DAS IU is ongoing: an improved version of IU has been used for a second field trial in the Quest project in October 2011, and showed higher quality data, with improved signal to noise ratio.
This paper has also shown that DAS down-hole acquisition is inherently simpler than acquisition with geophones in that the entire well is covered with a single shot. With geophone strings, several tool movements are typically required. Single deployment leads to reduced HSE exposure and savings on all expenses related to down-hole acquisition – equipment (source and receiver) rental, staff time and rig time. Acquiring the full well in a single shot (or a stack of single shots) should improve repeatability and hence time-lapse sensitivity. In addition, some of the savings inherent to DAS acquisition can be used to provide high fold shot stacking, further improving the DAS data quality.
DAS may yet realize the vision of a fully instrumented well from surface to total depth. It is becoming apparent that there are situations where DAS is the only viable alternative for down-hole geophysical surveillance, as in slim-hole wells, or wells that may not be entered without removing the completion equipment, or where long arrays may not be safely deployed (e.g. long horizontal wells). Improved repeatability is likely by using comparatively inexpensive permanently deployed fiber, rather than multiply deployed geophones. Therefore, while it appears that DAS measurements may not yet attain the high fidelity of geophone systems (for example higher noise floor and lower frequency content), the low cost, simplicity, and non-intrusiveness of DAS operations may be a “fit-for-purpose” solution for reservoir monitoring applications.

Acknowledgements
Shell Upstream Americas CoE teams for designing and supporting fiber installations; Jim Roy, John Holbrook and Stuart Russell from OptaSense for operating the system and recording the data; K. Hornman, B. Duijndam, P. Webster, B. Westwood for technical advice. We thank Shell and OptaSense for permission to publish this paper.
Related Reading


Join the Conversation
Interested in starting, or contributing to a conversation about an article or issue of the RECORDER? Join our CSEG LinkedIn Group.
Share This Article