The search for effective direct hydrocarbon indicators has motivated the development of a broad variety of methods that seek to make use of seismic data for locating economic reservoirs in the subsurface. One of the best known approaches is the analysis of amplitude variation with offset (AVO), which often provides accurate and useful results. Broadly speaking, the success of AVO techniques relies on insights into reflection amplitudes that assume relatively weak contrasts in seismic velocity and density across an interface, and angles of incidence that are less than about 30 degrees. More recent approaches do consider larger angles. Another important assumption in typical implementations is that the material properties of the two layers on either side of the interface experience purely elastic wave propagation. However, some recent, as well as historical investigations, suggest that inelastic effects may cause detectable changes in seismic signals that may be another indicator of hydrocarbons. Because seismic waves that propagate through a highly attenuating layer will lose energy, and this energy loss will affect high frequencies more significantly than low frequency components, several methods for detecting shifts in frequency content have been proposed and discussed in the literature. Furthermore, recent laboratory studies suggest that the quality factor Q may approach values as low as 10 in some rocks that are potential reservoirs. In such cases, the shifts in frequency content could be very large. Another important advance is the development of theoretical models for the properties of rocks containing distributions of fractures filled with various fluids; such theories predict potentially significant levels of attenuation during wave propagation too. In this case, accurately measuring changes in seismic signals associated with the inelasticity could provide another important tool for characterizing fractured reservoirs to identify fracture swarms that are important for reservoir management.
At the same time, there is an important problem that arises when the layer containing pore fluids or fractures is relatively thin, about 10 m or less in thickness. Under these conditions, the total distance of propagation will be only a small fraction of a wavelength, which will be about 100 m in typical surface seismic applications. Consequently, very little energy will be lost during propagation in the low Q materials, and it will be difficult, if not impossible, to measure frequency shifts that might otherwise be observed in such settings.
Fortunately, the effects of inelastic media are not limited to energy loss during transmission of waves through layers. It is straightforward to show that when two layers have different Q values, the reflection coefficient for the interface between them becomes complex, and there may be a change in the magnitude of the coefficient. There is, however, another important effect on waveforms, a phase rotation caused by the complex reflection coefficient. To explore the potential of using this effect as an additional hydrocarbon indicator, this paper presents simulations of seismic wave reflections from both homogeneous and heterogeneous reservoir models that include inelastic, but thin target layers. Because modeling wave propagation in 3-D inelastic media with exact finite difference techniques is slow and difficult to implement, we apply a technique using Born scattering theory, and our application is a unique and new implementation that allows us to examine the influence of localized regions of strongly attenuating materials embedded within the model. Our tests using homogeneous layers show that the modeling using Born theory is quite accurate and that measurements of instantaneous phase attribute may be a useful method for detecting the influence of the inelastic materials. Tests on a hypothetical fractured reservoir model indicate that the same effects may help to better locate highly fractured portions of the reservoir layer.
Modeling Method
An important result in elementary seismology is the analytic solution for the reflection coefficient that gives the amplitude of a plane wave reflected from a single interface between two homogeneous, isotropic materials, as this is the foundation of AVO methods. However, when an earth model includes complex, 3D variations in velocity and density, deriving exact results becomes much more difficult. If we can assume that the 3D variations in properties can be represented as weak fluctuations, or perturbations, added to a simpler background model, it is fairly easy to develop an approximate solution for the scattered or reflected waves generated by the 3D perturbations. This result, the Born approximation, has long found use in seismic studies for both modeling and inversion applications. It is a single-scattering solution, meaning that it assumes seismic waves are scattered only one time from localized heterogeneities. An important advantage is that it is easy to consider scattering from anisotropic regions, such as swarms of aligned fractures that form effectively anisotropic media, and there are therefore many potential applications. Here we outline the general steps used to develop the Born approximation and suggest how it can be used to examine the influence of inelastic materials on seismic reflections.
Unlike many, or most, applications, the development of the theory is most easily explained assuming a general case where the earth model is anisotropic. In this case, we can express the equation of motion as

where x and t are the coordinates of a point in the subsurface and time, respectively, while ui is a component of the displacement vector. The material properties are density ρ(x) and elastic moduli δcijkl(x). To apply the Born approximation, we first rewrite these properties in terms of a background value (with superscript 0) and a perturbations δρ(x) and δcijkl(x) to that background:

We next assume that when the perturbations are relatively small, the effect on the seismic waves can also be represented as a perturbation to the displacements:

The perturbed values in equations (2) and (3) are then inserted into equation (1), and, because all the perturbations are small, we neglect all products of perturbed values, such as

In this case, it is straightforward to show that the perturbed, or scattered, wavefield is governed by the following equation:

Looking closely at this equation, the left side and the first term on the right have exactly the same from as equation (1), showing that in this approximation, the scattered field propagates in the background model. The other important point is that the two additional terms on the right, fi(x,t) and Mi(x,t), are expressions of sources of the scattered waves, where the former is controlled by the size of the density perturbations, and the latter is controlled by fluctuations in the elastic moduli. In each case, the amplitude of the source also depends on the incident, or background, wave ui0(x,t) that is propagating in the background medium. The power of the Born approximation is that propagation of both the incident wave and scattered waves is controlled by the properties of the background. As long as we choose this to be fairly simple, standard fast methods such as ray tracing or analytic results provide tools for modeling. Because the effects of the perturbations appear in the form of standard sources in equation (4), conventional methods can be applied to compute the amplitudes of reflections.
Modeling homogeneous layers
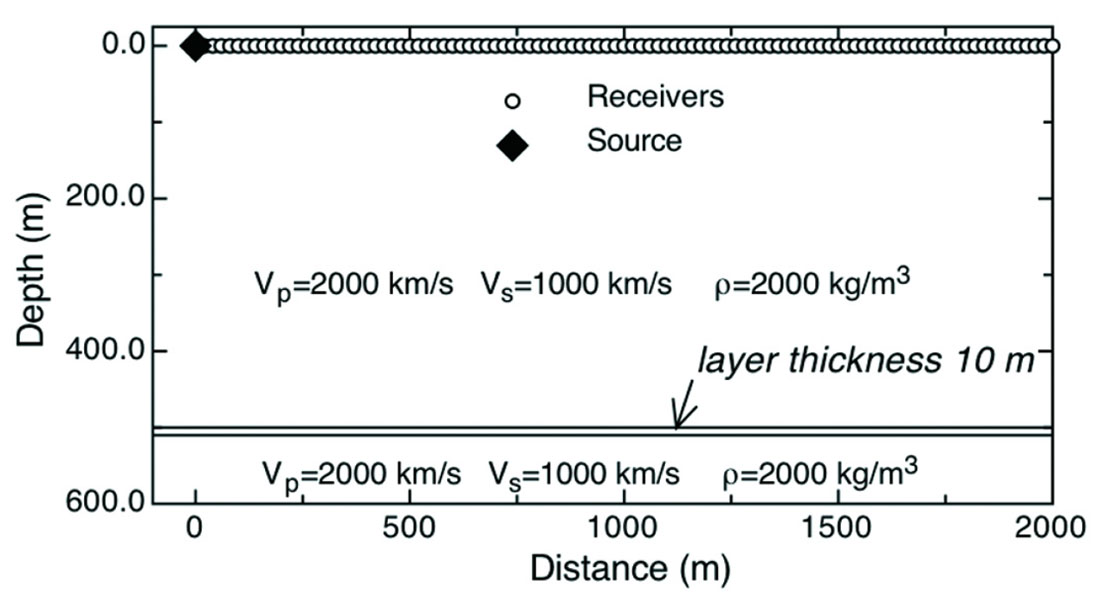
A simple model that includes a single, homogeneous layer provides a useful demonstration of the accuracy of modeling using the Born approximation and reveals the influence of inelastic material properties on reflection amplitudes. The model has a layer that is thin, so that energy loss is minimal, but the layer with a low Q value nonetheless leads to important changes in amplitude and phase of the reflection. Because the Born approximation is not generally applied in modeling when attenuation is considered, a validation that compares solutions to those provided by an exact solution of the wave equation provide a useful test of the Born solution in this case. The geometry of the model is shown in Figure 1, which also indicates the values of seismic velocity and density for each region. The modeling compared two general models, one where the reflecting layer is purely elastic and one where the layer is inelastic. The velocities indicated in the figure are those for the elastic model. When the layer includes attenuation effects, we set the Q value to be 2π, a value that is low but not far from recent laboratory measurements. Both P- and S-wave velocities were computed from the reference elastic values in the figure and from Q using the relationship

which neglects frequency dependence of velocity. Strictly speaking, this is incorrect, since velocity dispersion is required to maintain causal solutions for wave propagation, but for the relatively narrow bandwidth considered in our models, our tests show that the errors are negligible. The complex velocities from equation (5) provide a simple means of including attenuation in modeling.
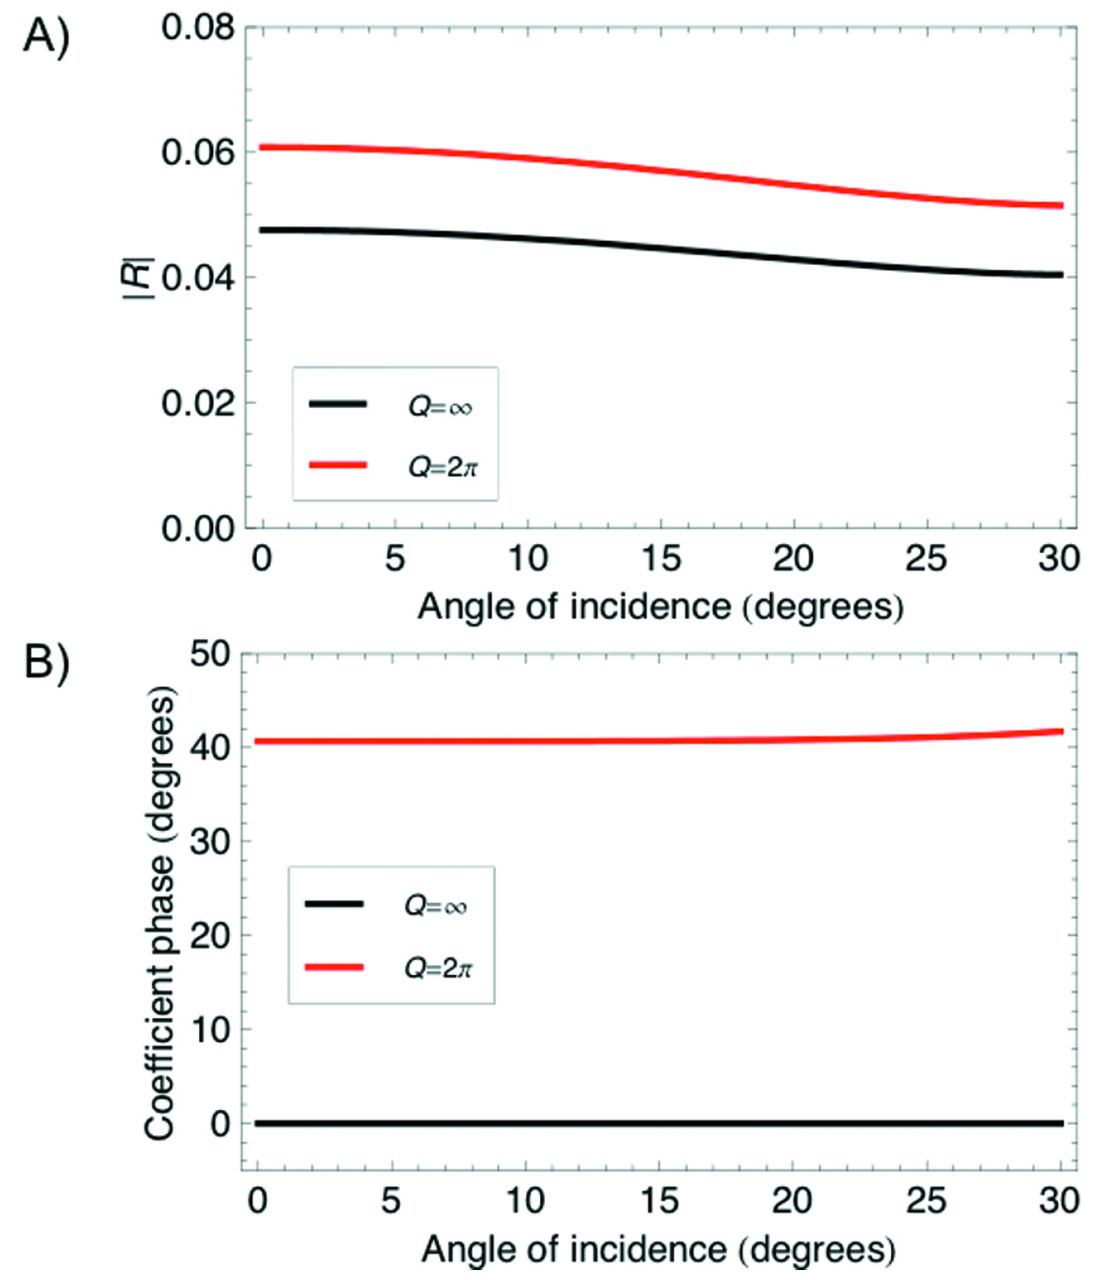
Calculations of reflection coefficients from the upper interface of layer illustrate the effects of the finite Q value (Figure 2). The usual exact reflection coefficient equations give these results, by simply utilizing complex velocities (equation 5) for the properties of the lower layer. In this case, the magnitude of the reflection coefficient increases somewhat when the layer is inelastic, but the most dramatic change is the introduction of a non-zero phase in the complex reflection coefficient. This suggests that seismic reflections from the layer will include a phase rotation that is added to any waveform distortions caused by the superposition, or tuning, of waves reflected from the upper and lower interfaces of the thin layer.
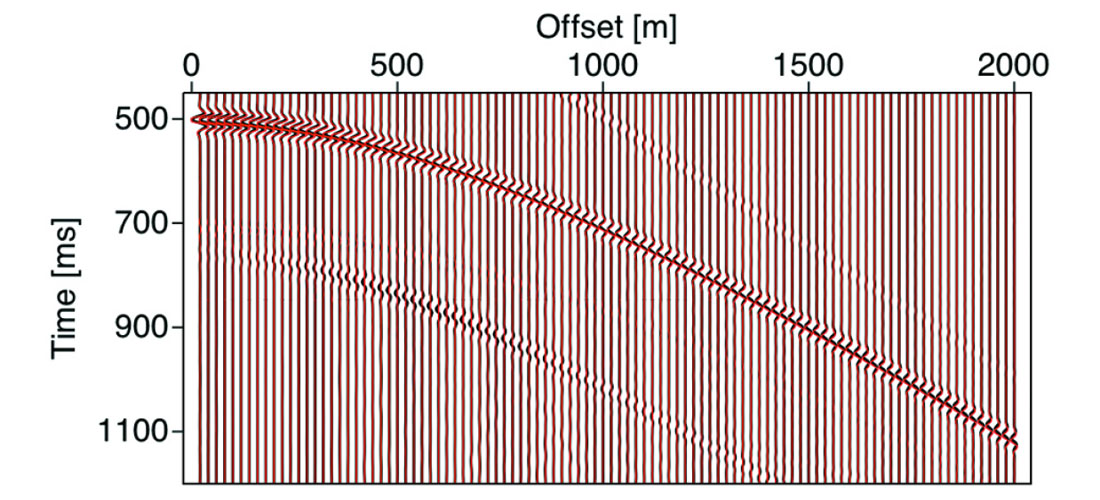
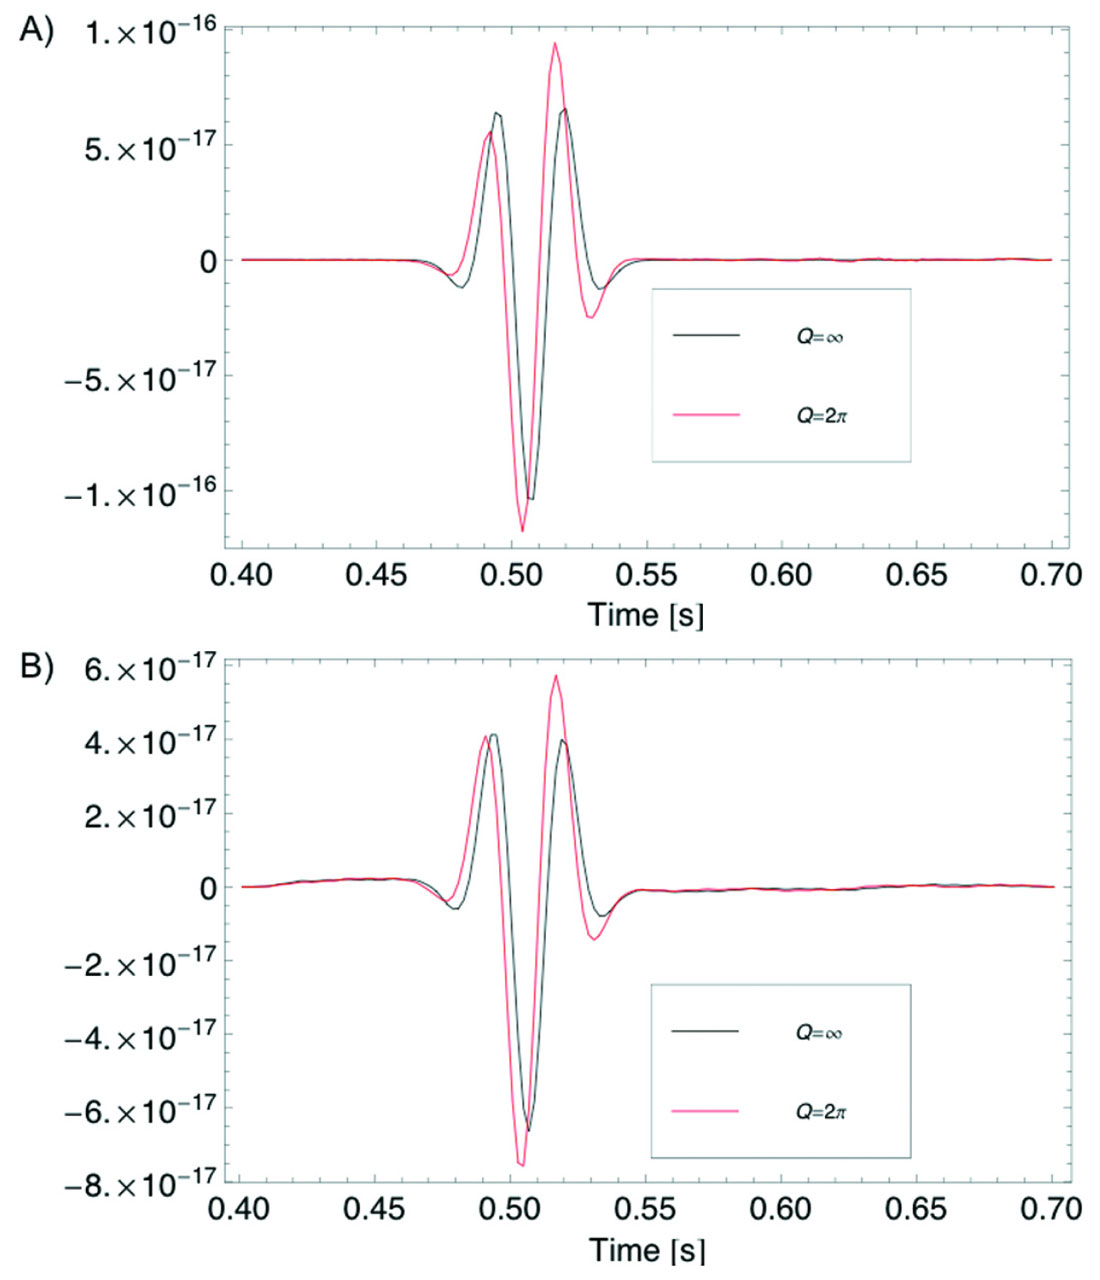
Acomparison between Born synthetic seismograms and an exact solution obtained from a reflectivity method show that the Born results are accurate (Figure 3). It is important to note that the exact result includes arrivals neglected in the Born modeling, such as a direct wave first appearing in the plot at about 900 m offset and a weak converted wave that we chose not to include in the Born result. The latter could be included if desired. A detailed comparison of traces from an offset of 20 m shows the results more clearly (Figure 4). Both algorithms show that the reflection amplitude increases slightly when Q=2π, and the influence of the phase rotation is also evident. These seismograms show that seismic waves do not have to propagate long distances through attenuating media to produce changes in waveforms that indicate low Q layers; reflection waveforms do provide indications of these properties.
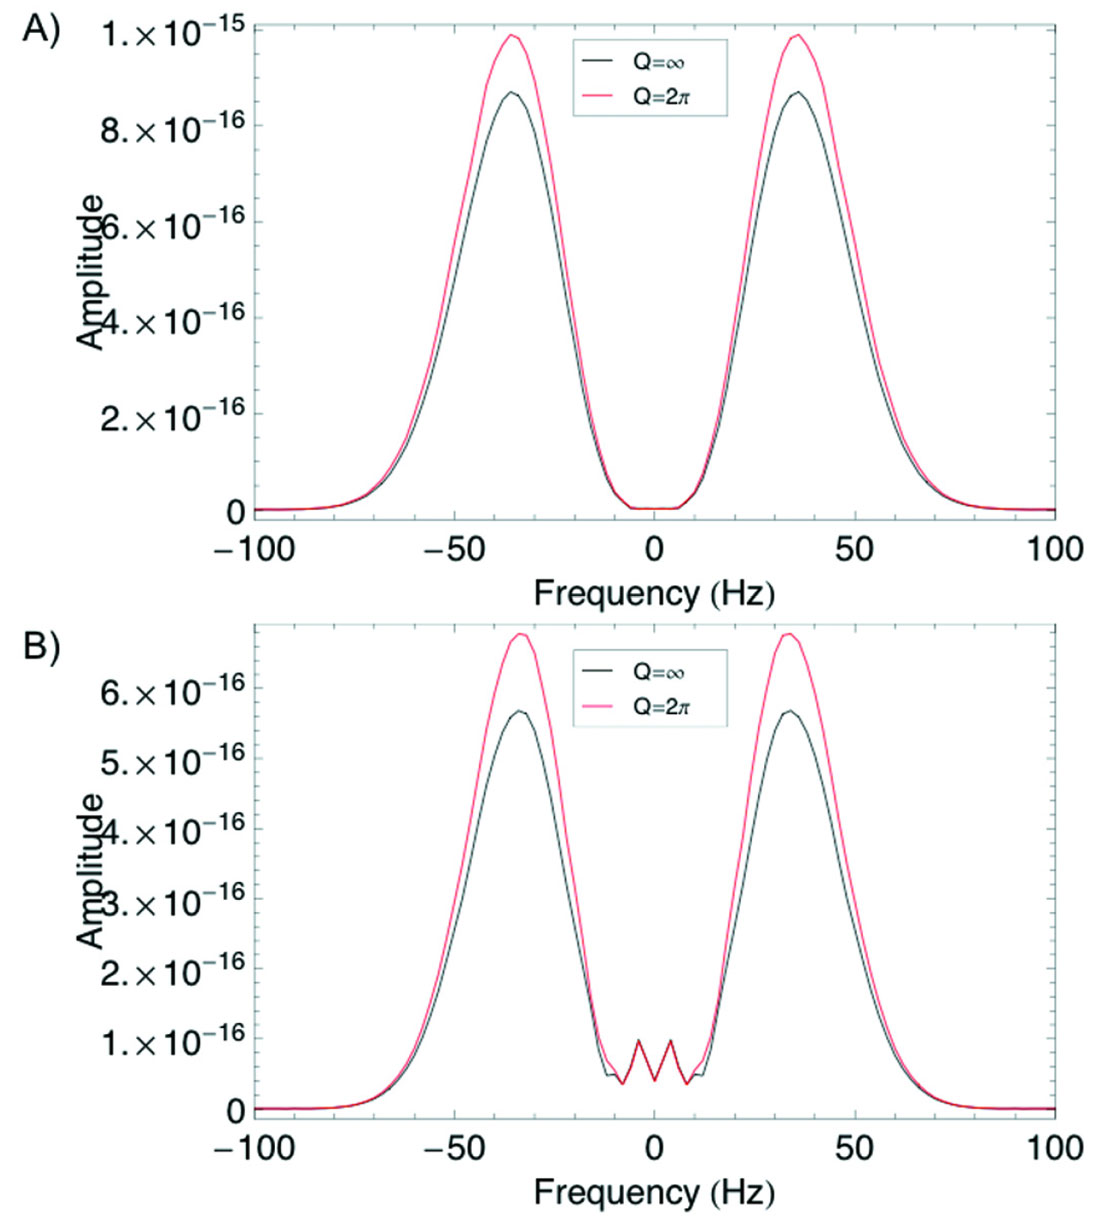
Spectra of the waveforms also help to explain the changes in seismic waveforms that are caused by the low Q medium (Figure 5). The amplitude spectra for seismograms computed by the two methods are very similar, though the Born solution slightly overestimates the amplitudes and predicts a smaller difference when comparing models with and without attenuation. As suggested by the analysis of reflection coefficients, the phase spectra show strong changes when Q is set to a low value. Specifically, there is a phase change of about 40 degrees measured in the seismograms, values very close to the phase shift expected from reflection coefficient results.
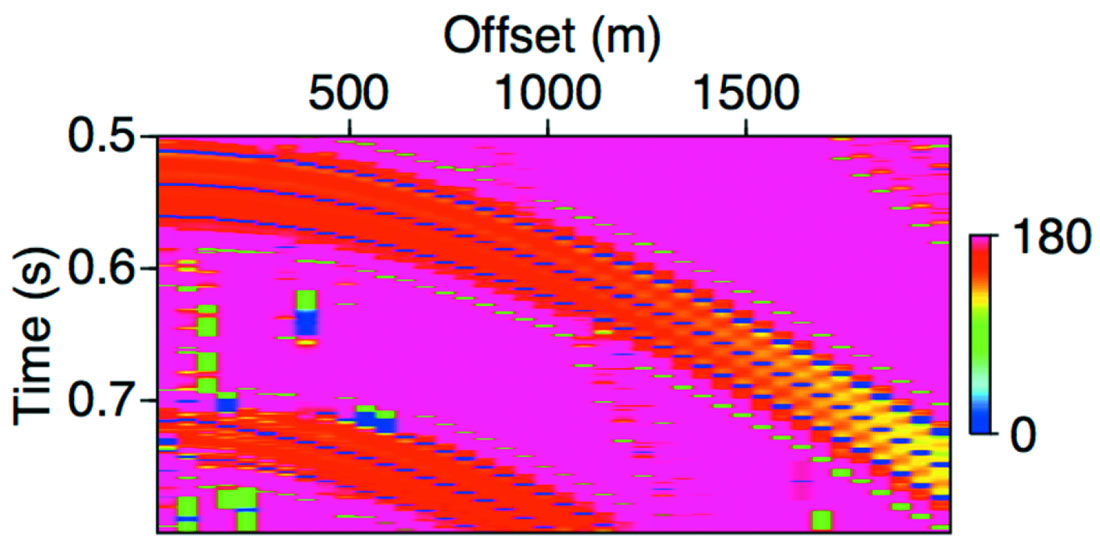
These comparisons suggest that it might be useful to examine seismic data for changes in phase to identify reflections from layers or fractured swarms with very low Q. An important challenge in practical applications is locating such phase anomalies within a larger volume of seismic data, since it is difficult to accurately measure spectra for small time windows. Some improved methods of spectral decomposition have been developed in recent years, but the conventional instantaneous phase attribute is designed to directly detect local variations in signals, suggesting it might be a useful attribute. Figure 6 shows the result of subtracting the instantaneous phase computed with the model with low Q from the phase measured from the purely elastic model. While there is a difference in the attribute values at all offsets, the anomaly increases in value with increasing offset. This is reasonable, since waves with larger angles of incidence will propagate for greater distances within the thin layer, increasing the effects of the low Q region. One possible workflow for applying this insight to field data could be to compare instantaneous phase measured from locations known to be brine-saturated to other potential reservoir sites. Anomalous phase could then serve as an additional measurement to attempt to detect low Q regions, especially when rock physics models or laboratory measurements indicate that attenuation may be significant under hydrocarbon saturation. It would be important to carefully analyze potential changes in tuning effects to distinguish them from phase changes associated with Q effects.
Modeling reflections from heterogeneous fractured reservoirs
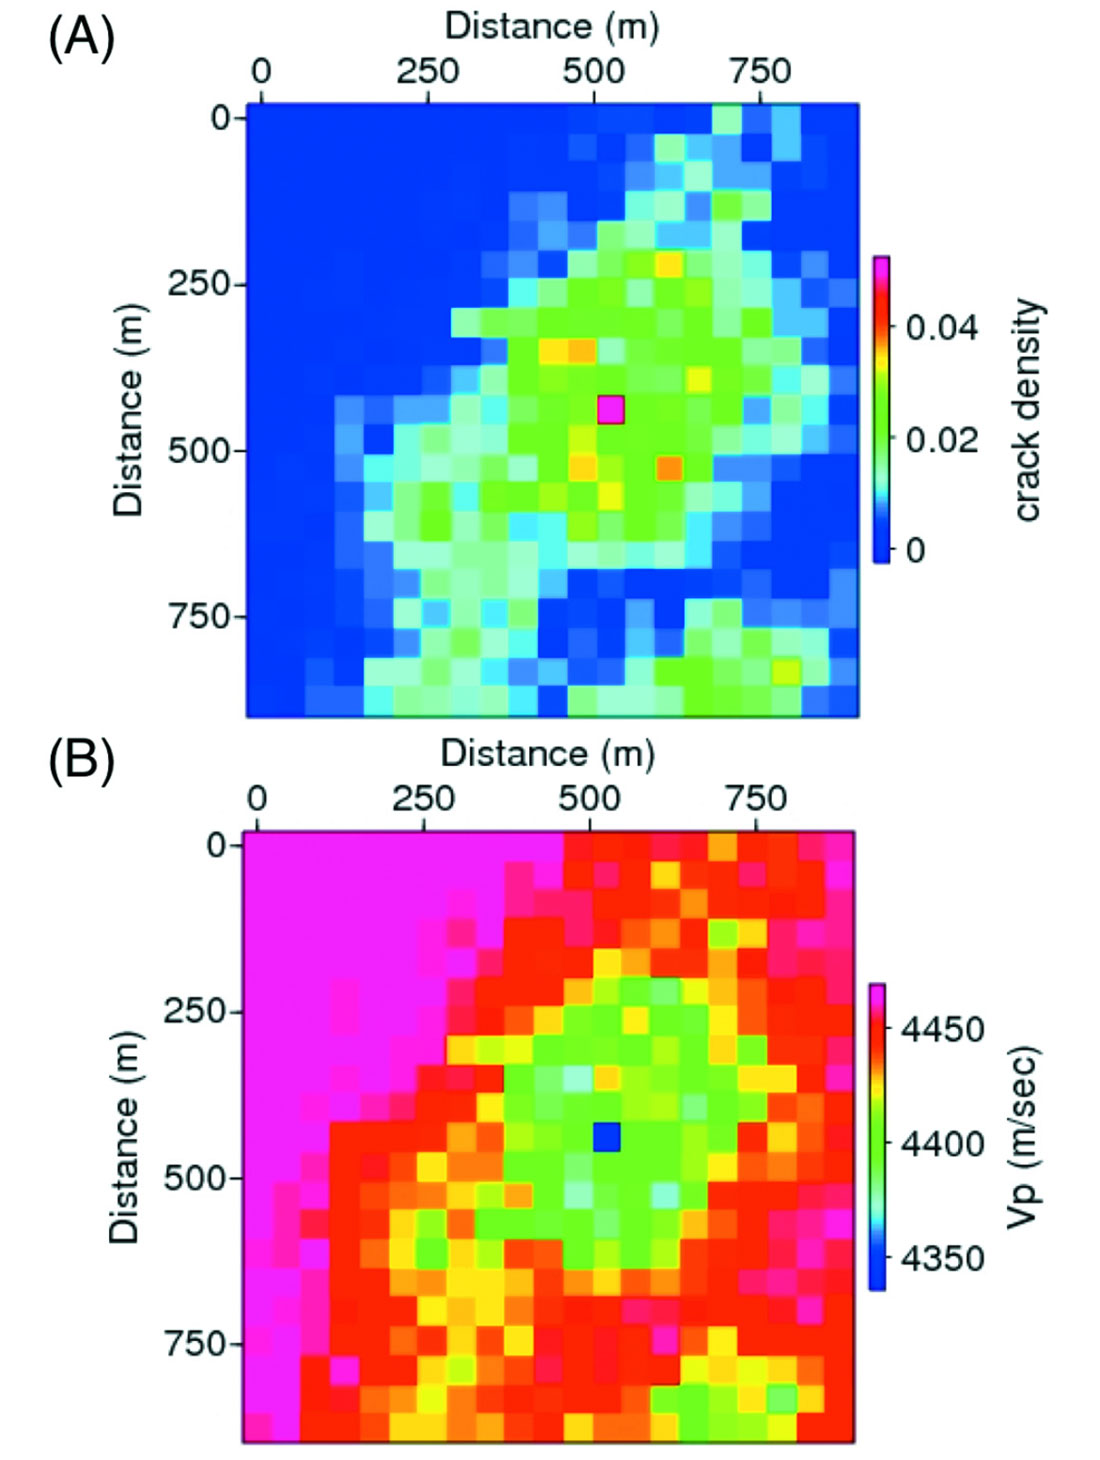
The model discussed in the previous section provides a illustration of the effects of the inelastic layer on reflection amplitudes, and, because it is laterally homogeneous, it provides a clear demonstration of the accuracy of the Born modeling. On the other hand, the low value of Q in the layer, 2π, may not occur commonly in nature, and the predicted changes in seismic waveforms caused by this value will likely be more difficult to measure in field settings. We consider a fractured reservoir model to explore the magnitude of effects that we might see in more realistic, laterally heterogeneous reservoirs. The reference model is shown in Figure 7, which shows the value of crack density in the reservoir layer, which is assumed to be a horizontal layer with a thickness of 20 m. Here the crack density is defined as

where n is the number of cracks per unit volume, and a is the radius of the fractures, which are assumed to be “pennyshaped”. The region of interest, the area with higher crack density, is mostly in the central portion of the model layer, is 21 by 21 cells in the horizontal direction, with a total size of about 920 m by 920 m. The model is one cell in thickness (20 m).
Crack density is an important parameter, since it is required for the calculation of the effective velocities of the fractured rock volume. Several theoretical models of these effective properties developed in recent years predict that the fractured rock will be inelastic, with complex seismic velocities and elastic moduli. For example, Pointer et al. (2000) present formulas for several configurations of fractures and for various models of interaction of fluids and seismic waves with fractures embedded within a possibly porous host rock. If the host is porous and permeable, such that fluid can flow between the fractures and the host, the model predicts attenuation that depends on several parameters, such as permeability and fluid viscosity. For the relatively low crack density values in this model, the change in elastic properties associated with fracturing is a linear function of ε. While there are equations allowing for the study of anisotropic media with aligned fractures, for simplicity we instead utilize results for randomly oriented fractures corresponding to an isotropic medium.
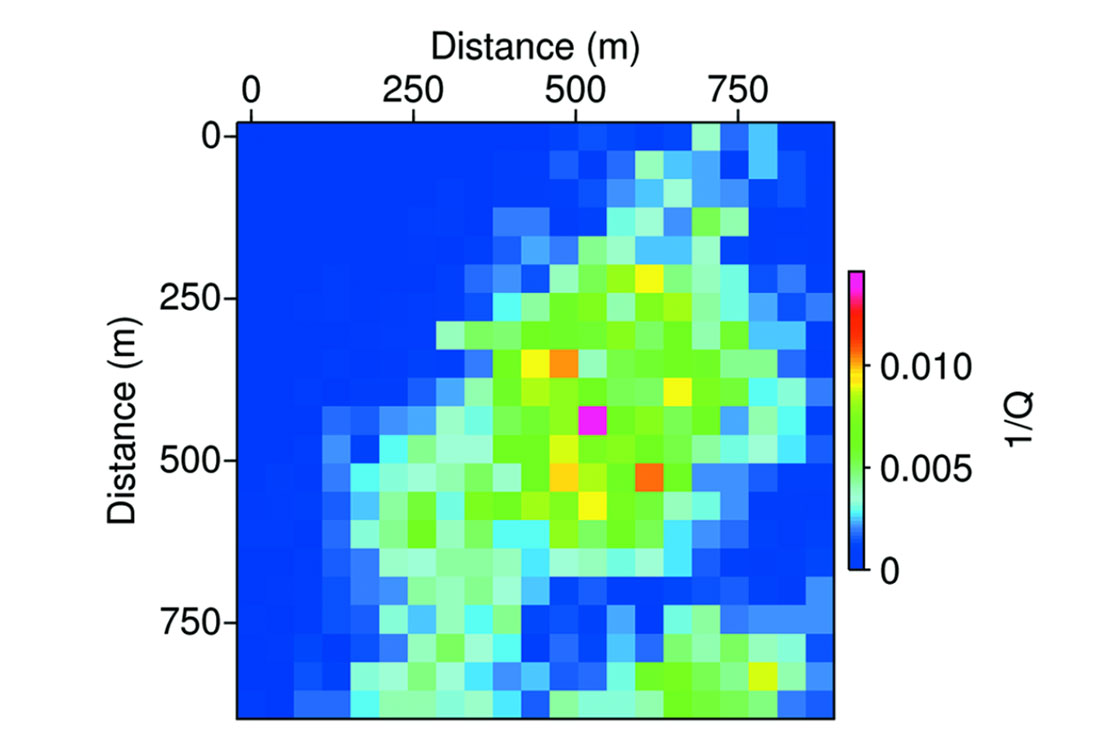
The predicted P-wave velocity distribution is shown in Figure 7b, when the fracture system is assumed to be saturated with supercritical fluid phase CO2. S-wave velocity shows the same general distribution in the reservoir, though the magnitude of velocity change is less since S-waves are less sensitive to pore fluids. Similarly, the S-wave attenuation is negligible, corresponding to a very large value of Q, though the P-wave Q approaches minimum values of about 70 (i.e., 1/Q~0.14). However, the general values are around Q=130 to Q=150, which is still relatively large (Figure 8). There was no attempt made to adjust parameters of the model to find lower values of Q since it was designed in part to use for other fluid flow studies, but it should be noted that by changing parameters related to porosity, permeability and fluid properties, it is possible to create realistic models with Q as low as 30.
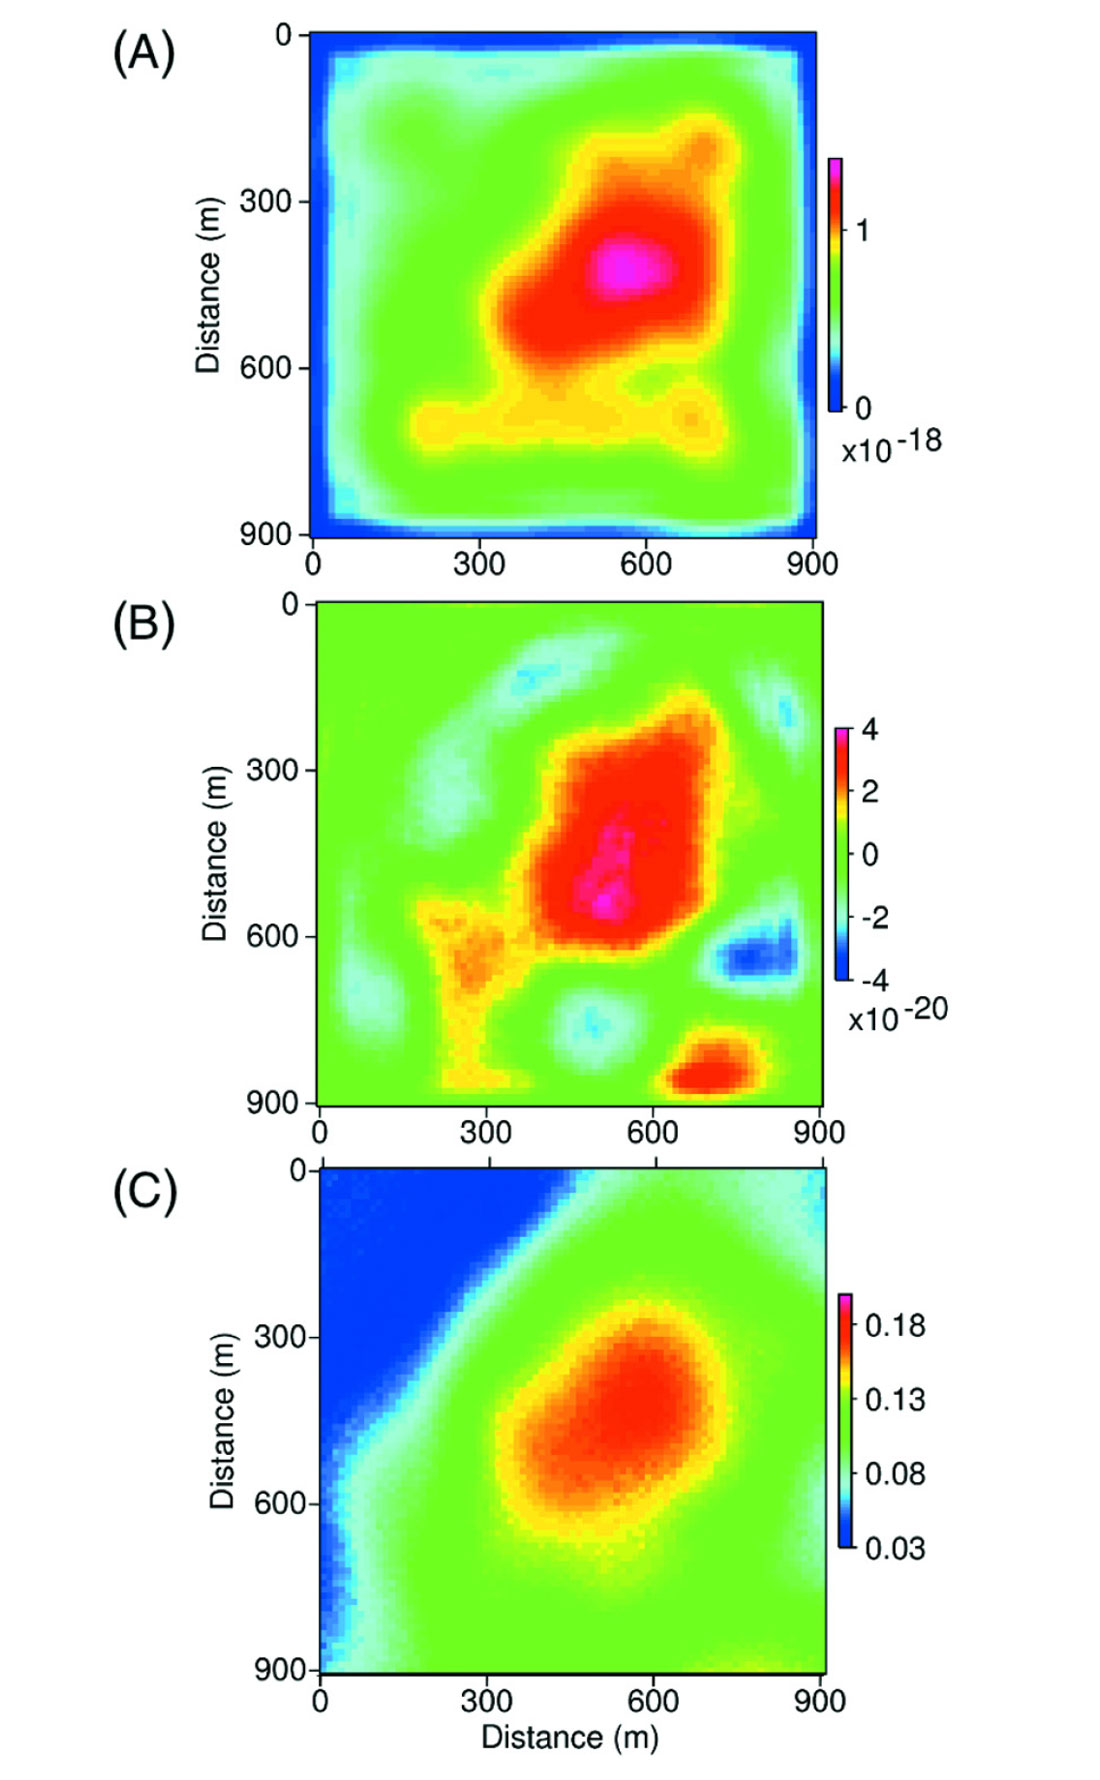
After computing the effective velocities for this hypothetical fractured reservoir, we then computed Born synthetic seismograms assuming that the homogeneous background model had Vp=4600 m/s, Vs=2490 m/s, and density 2350 kg/m3. The simulation applied a zero-offset source/receiver configuration at locations every 11.25 m in both horizontal and vertical directions, corresponding to an 81 by 81 grid. After modeling, standard phase-shift migration provided images of the reservoir, and Figure 9 shows the RMS amplitude of the migrated reflection from the reservoir. There is a clear correlation between the increase in reflection amplitude and increased crack density. Because the background velocity is assigned to a value greater than reservoir velocities, and an increase in crack density will lead to an additional decrease in velocity, high crack density causes larger velocity contrast and thus larger amplitude. The figure also displays the change in amplitude when Q is neglected and velocities are assumed to be real. Amplitude effects associated with the Q values are rather small, as the maximum amplitude change is about 4% of the original signal.
We can also examine the instantaneous phase attribute, following the analysis applied to the homogeneous reservoir layer. For simplicity, we show only the difference in the phase attribute that is caused by the finite Q values (Figure 9c). We subtract the instantaneous phase for the original model that includes attenuation from the phase computed from the model neglecting Q. Here the influence of the inelastic fractured rock properties leads to a change in phase of about 0.18 radians, or 10 degrees. This is also subtle, but it still provides an additional measurement that could be combined with amplitude measures to better identify locations with higher crack density. If, for example, it is known that reservoir thickness is essentially constant, then there should be no waveform changes associated with changes in tuning, and the changes in phase could be more reliably associated with changes in internal velocity and attenuation structure that are in turn caused by changes in fractures.
Summary
Waves traveling several wavelengths through an inelastic medium that has a relatively low value of Q can lose significant energy, leading to obvious loss of high frequency energy. However, our modeling results show that thin, isolated regions with low Q also may be detected through changes in seismic waves scattered or reflected by them. These effects, which are less obvious, are well modeled by the algorithm based on Born scattering theory, and they are parameterized by introducing complex perturbations in velocity values. Comparisons of these approximate results with exact, full waveform solutions from a reflectivity method show that the Born results can be accurate, at least when the reflecting layer is relatively thin. Though there will be small changes in reflection amplitude, the more interesting result is the change in phase of the reflection, which is caused by the complex velocity values, which cause the reflection coefficient to become complex too. We also show that the instantaneous phase seismic attribute may provide a simple, but useful method for detecting the waveform changes associated with reflections from localized regions with low Q in prestack or migrated data. The application to a heterogeneous, fractured reservoir model shows that the subtle changes can be detected even when Q is relatively high, with values around 100 to 150. Since laboratory studies suggest that Q can be much lower in some field settings, it is likely that such effects might provide a new and useful indicator of changes in pore fluid contents in reservoir development programs.

Acknowledgements
We gratefully acknowledge generous financial support from TOTAL for the research described in this paper. We also thank Dr. Ravi Shekhar for assistance in creating some of the heterogeneous fractured reservoir models that were used to set up calculations of synthetic seismograms.




Join the Conversation
Interested in starting, or contributing to a conversation about an article or issue of the RECORDER? Join our CSEG LinkedIn Group.
Share This Article