1. Introduction
The Tishrine-West field is located in North-East Syria and has been producing since 1978. In 2005, Tanganyika Oil assumed operatorship of this field as a part of its ownership commitment of the Tishrine block. 3D seismic data was acquired in 2006, and subsequent interpretation and attribute analysis, followed by drilling, has led to significant increase in production rates as well as reserve estimates of this field.
The seismic curvature attribute is defined as a three-dimensional property of a quadratic surface that quantifies the degree to which the surface deviates from being planar (Chopra and Marfurt, 2007). Analysis of the curvature attribute can help remove the effects of regional dip and emphasize the small scale features like fractures. In the Tishrine-West field, the presence of open or conductive fractures relates to higher reservoir permeability, leading to higher production rates. This paper describes how the curvature attribute has been applied in planning horizontal wells in the Tishrine-West field, so as to encounter the optimum degree of fracturing.
The next section describes the regional geology of North-East Syria, which is followed by a summary of the 3D seismic dataset and structural interpretation. Section 4 briefly summarizes the theory behind the curvature attribute. The calibration of existing wells with respect to the curvature attribute is discussed in section 5. In section 6 the workflow for planning horizontal wells using the curvature attribute is described in detail. The statistics illustrating the improved well performance is discussed in Section 7 and finally, section 8 summarizes the conclusions and scope for further work.
2. Regional geology
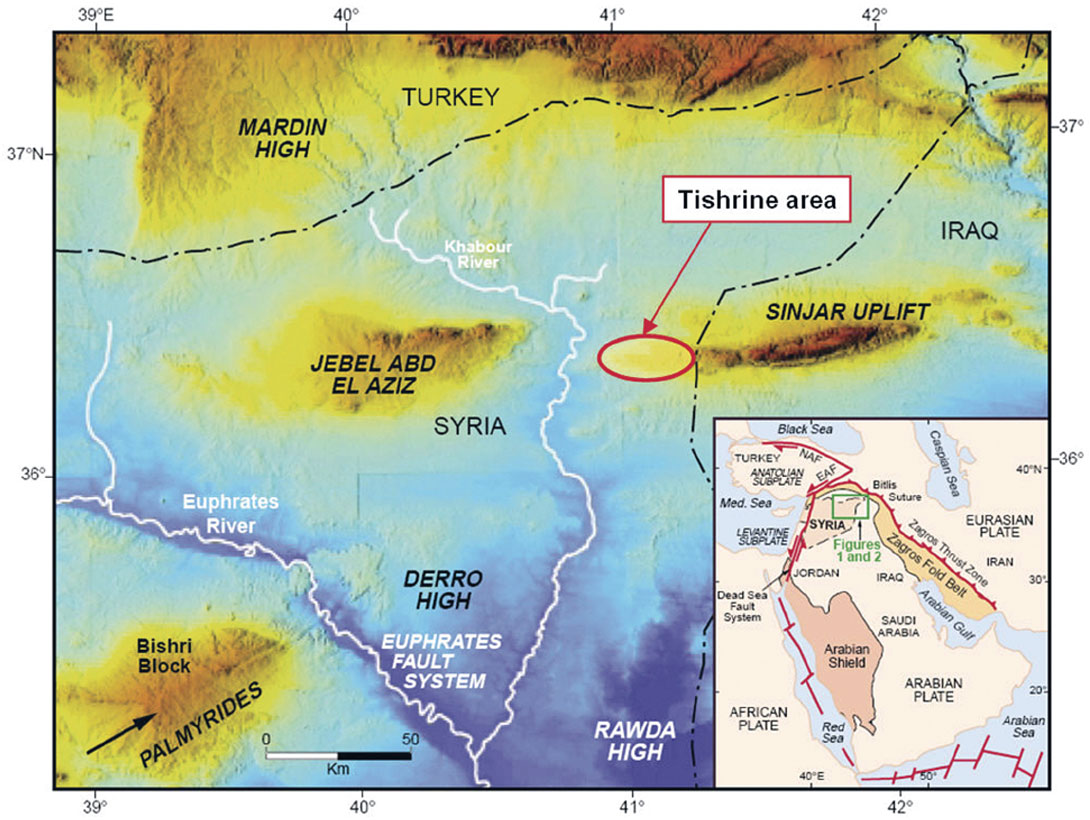
The Tishrine-West field is located in North-East Syria (Figure 1). The field is a part of a large anticline, whose present day signature is visible on satellite images. The main producing reservoirs are the Oligocene (Chilou) and Eocene (Jaddala) limestones. However, significant reservoir potential exists in deeper formations of Upper Cretaceous (Shiranish) and Triassic (Kurachin-dolomite).
2.1 Structural setting
Regional tectonics of North-East Syria has been discussed in detail by Kent and Hickman (1997) and Brew et al. (1999). Figure 1 illustrates the topographic image of North-East Syria; two features stand out immediately from this map. One is the Jebel Abd El Aziz structural high and the other is the Sinjar uplift. The Tishrine block is located at the Western edge of the Sinjar uplift. Both these structures are result of Pleistocene-Recent compression (inversion). The current plate configuration (Figure 1, inset) shows that the Arabian plate is subducting below the Eurasian plate giving rise to the Zagros fold belt, suggesting that the region is tectonically active present day.
Figure (2) summarizes the structural history of North-East Syria. The NW-SE trending Beida Arc divides the Palmyride and the Sinjar troughs as seen in Figure 2a. The Aleppo-Mardin High is located at the North-West flank of the Sinjar trough and this has been a positive structural feature since Precambrian. Another positive structural feature, the Rutbah high, has been in existence since the Early Devonian, and is located at the south-west flank of the Sinjar trough. These structural highs served as stable shelf platforms for subsequent deposition.
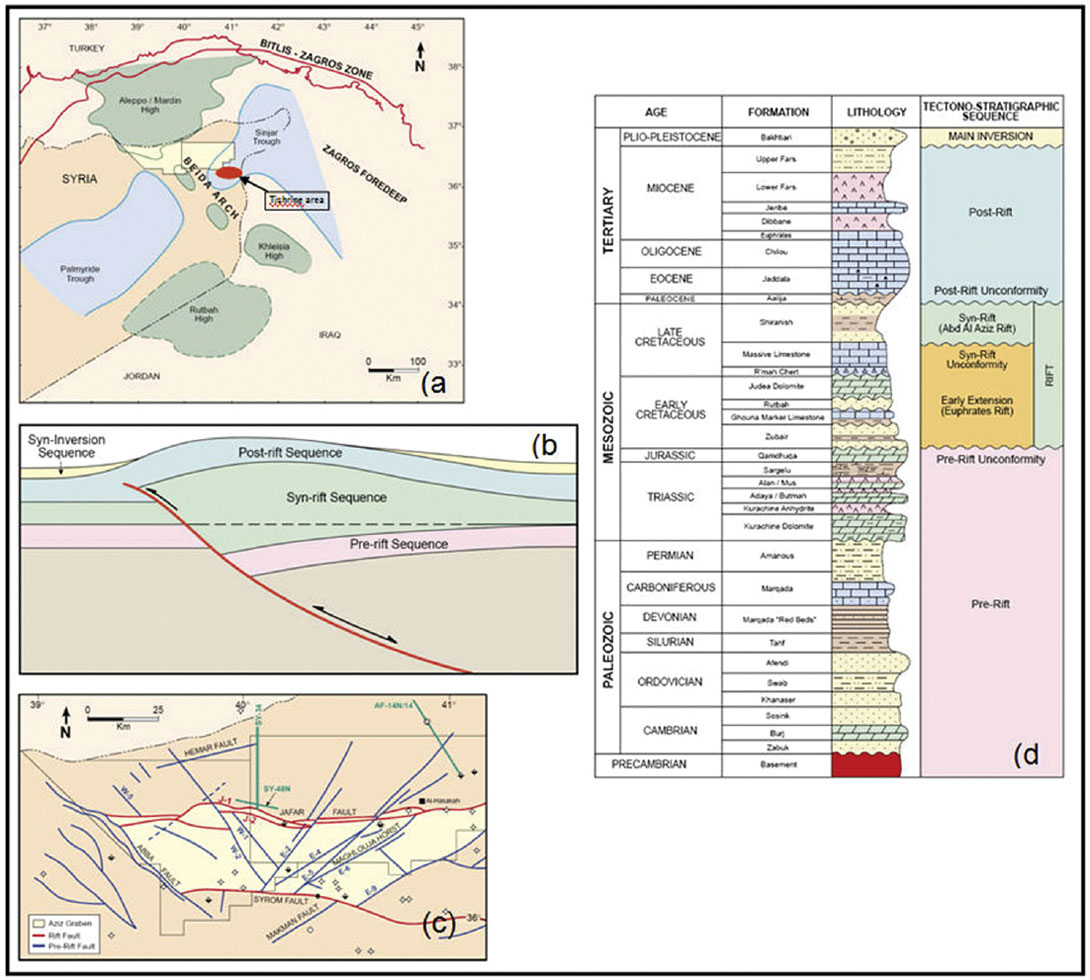
The structural history can be divided into pre-rift, syn-rift and post-rift periods. The rifting commenced at Early Jurassic, and continued till Late Cretaceous (Figure 2d). The rifting phase can be further sub-divided into and early-extension phase and the late Abd-Al Aziz rift. The early extension coincided with the Euphrates rift system that occurred further south. This extension is characterized by NW-SE trending normal faulting.
The period from early extension and syn-rift was fairly stable. During this time, the shelf carbonates of the Massive limestones prograded southward from the Mardin High into Syria. The edge of this carbonate platform is close to the present day Syria-Turkey border. Further south in the Tishrine area, finegrained basinal limestone were deposited during this time.
During syn-rift (early Maastrictian), renewed extension caused the formation of the Aziz Graben between the Southdipping Jafar fault and North-dipping Synrom fault (Figure 2c). This led to erosion along the margin of the graben and deep-water deposition within the graben. In the Plio-Pleistocene subsequent north-south compression, and resulting inversion of this East-West trending fault system, led to the current anticlinal structures.
2.2 Depositional environment
The stratigraphic column over the Tishrine field is summarized in Figure 2d. Most of the heavy oil production is from the Chilou (Oilgocene) and Jaddala (Eocene) formations. The Chilou formation can be further subdivided into Chilou-A and Chilou-B reservoirs, with a thin anhydrite layer separating the two.
The Chilou and Jaddala formations are deposited on a deeper outer shelf normal marine environment, grading to restricted subaqueous evaporitic setting. They are limestone and dolostone reservoirs with variable intergranular porosity. In both the Chilou and Jaddala, the reservoir quality was significantly improved by the creation and preservation of Type I and Type II open fractures.
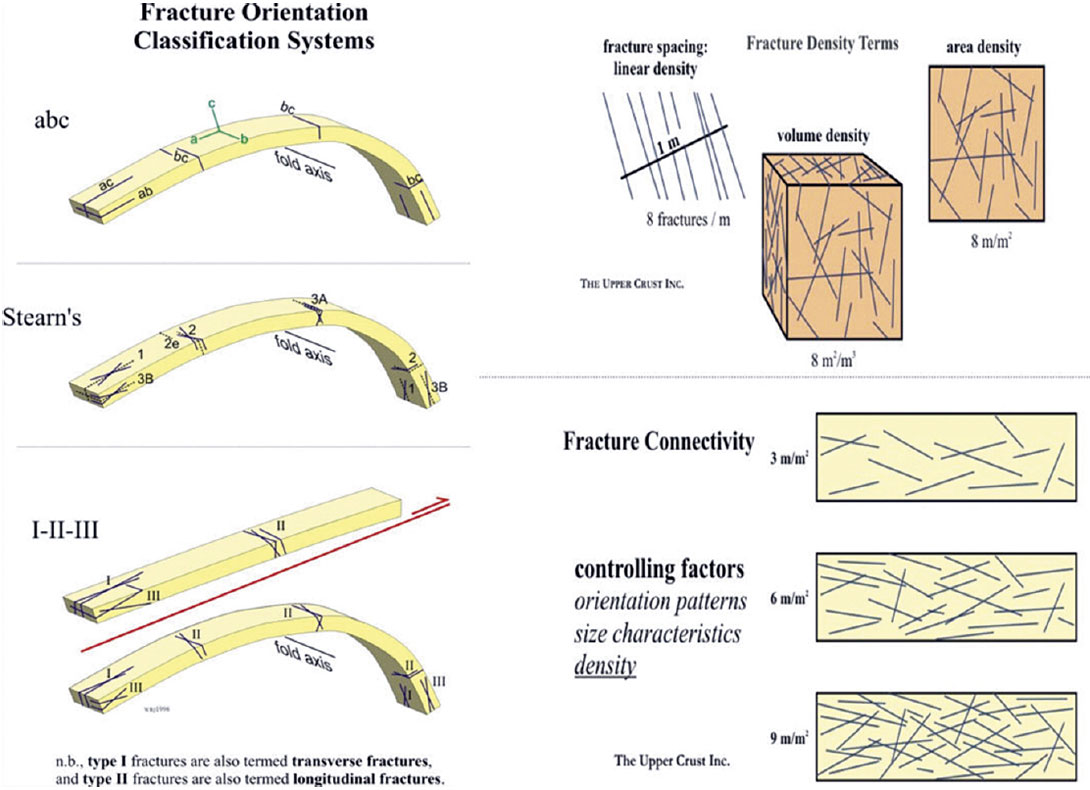
Figure 3 describes the fracture orientation and classification system used in this study. Type-I fractures are parallel to the direction of maximum stress, where as type-II fractures are perpendicular to the direction of maximum compression. In the context of the Tishrine field, the fracture density and the degree of fracture connectivity are the two primary controls on the reservoir quality.
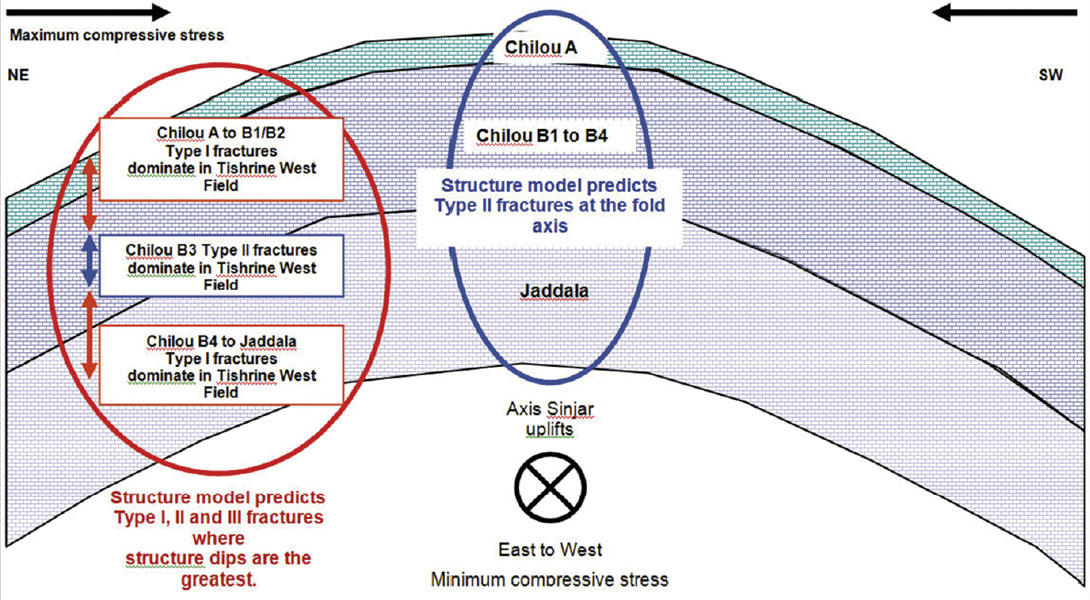
Extensive FMI data has been acquired over the Tishrine-West field and a fracture model has been established. Figure 4 illustrates the structural stress regimes and the relationship to the fracture patterns over the Tishrine anticline. The Tishrine anticline is a result of large fault-propagation fold that plunges along the east-west direction, implying a NE-SW orientation of maximum compressive strength. In the Chilou-A and B1/B2 units, as well as in Chilou-B4 and Jaddala, type-I fractures, with North-South orientation, are found to be dominant. Type-II fractures, with East-West orientation, are observed in the Chilou-B3 reservoir unit. Using this fracture model, along with seismic curvature attribute, a workflow to plan horizontal wells was developed. The workflow has been extremely successful, as demonstrated by higher production rates and significant addition to reserves.
3. Seismic database
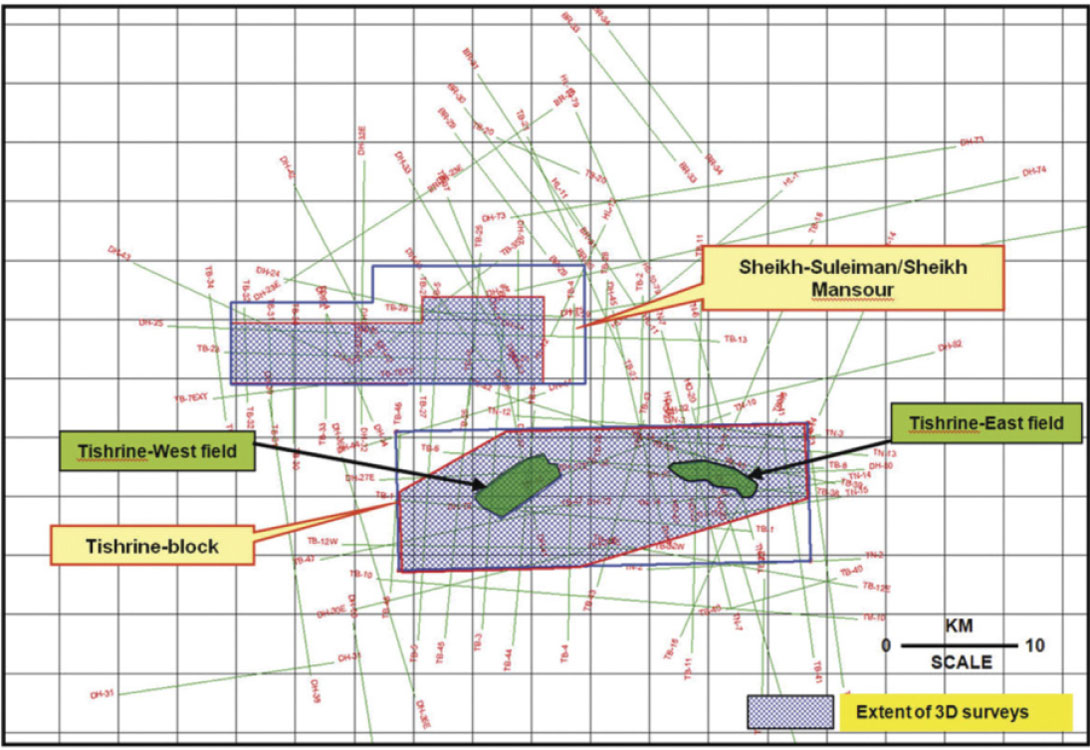
Approximately 1575 km of 2D seismic data was compiled over the Tishrine- West field area (Figure 5). The data was of various vintages and only paper sections were available. Using the 2D seismic, a preliminary structural interpretation was made, and was used in the design of the 3D seismic survey.
3D seismic data was acquired over a major portion of the Tishrine block during July-September, 2006 (Figure 5). The objectives of the 3D survey were: (1) to understand the structural setting of the Tishrine field; and (2) to position the appraisal and production wells in an optimum way. The data was post-stack time migrated and an FX noise attenuation was applied to improve the signal to noise ratio.
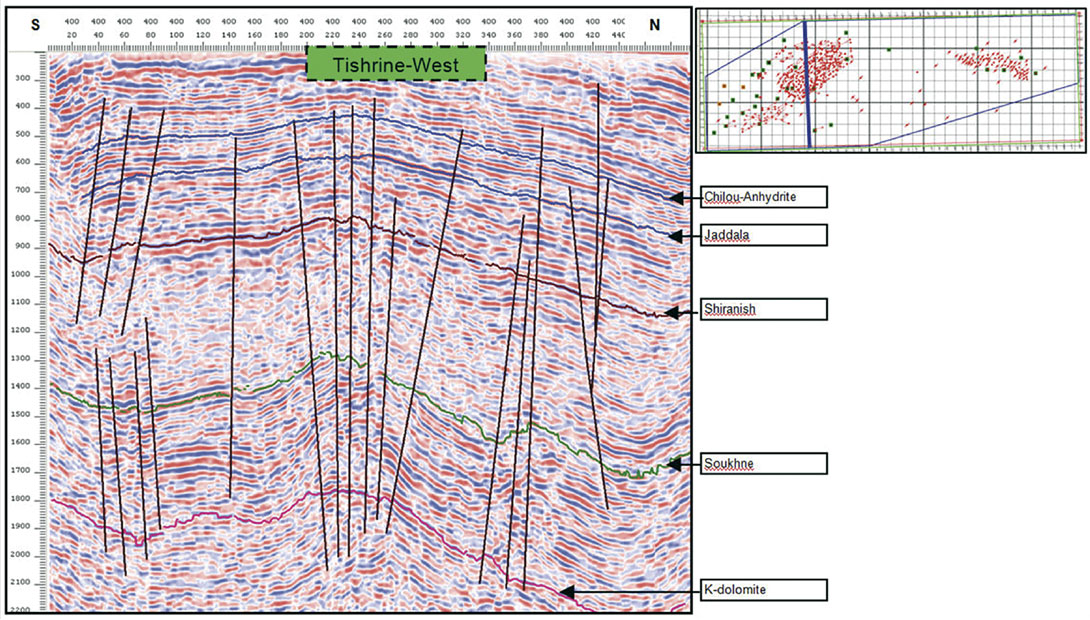
The three main horizons that were mapped using the 3D seismic were top of Chilou-Anhydrite, top of Jaddala and the top of Shiranish formations. Figure 6 shows the depth structure maps of the top of Chilou-Anhdrite and top of Jaddala. Both maps demonstrate similar structural features: the presence of East-West plunging anticline, which can also be viewed as three related “sub-structures”. It is evident that the Tishrine-West field is located at the flank of the anticline, and significant hydrocarbon potential exist updip.
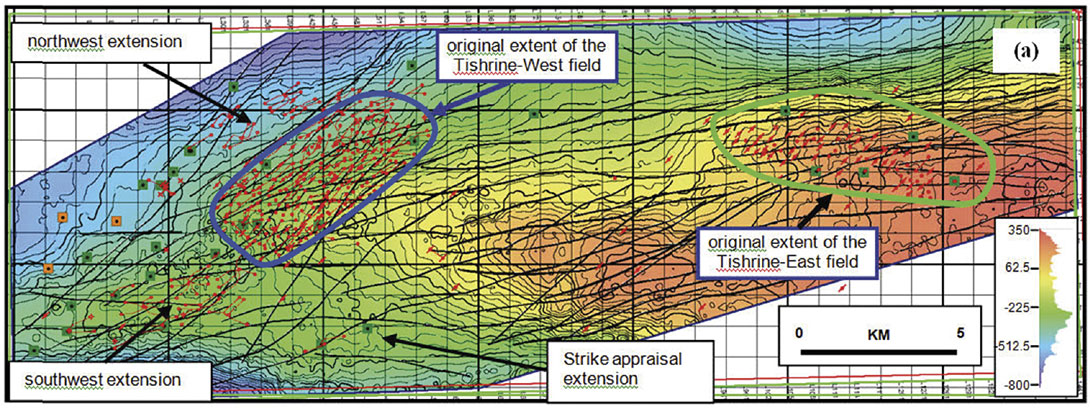
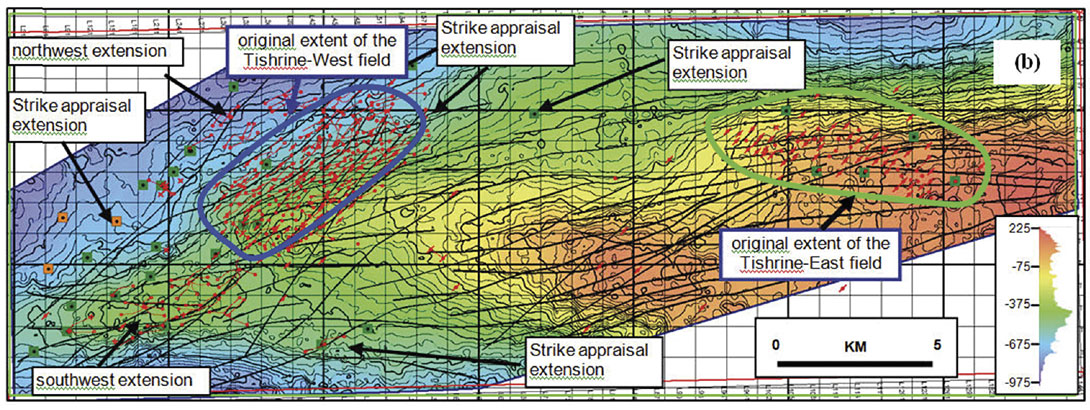
Figure 7 shows a North-South line through the Tishrine-West field. The faulting at the Chilou and Jaddala formations seems to be controlled by the older tectonics. The offsets of the faults are very low, and it is unlikely that they are acting as seal. The section between the Chilou and Jaddala horizons show some thinning as one moves updip, implying that the structural high existed to some degree during the time of deposition.
4. Curvature attributes
Computation of volumetric curvature attributes is a significant advancement in the field of attributes. Curvature computed from 3D seismic horizons have been used for prediction of fault and fractures for over of decade; some of these curvature measures have been shown to be correlated with open fractures measured on outcrops (Lisle, 1994) or through production data (Hart et al., 2002). Horizon-based curvature is limited not only by the interpreter’s ability to pick, but also the existence of horizons of interest at the appropriate level in 3D seismic data volumes. Horizon picking can be a challenging task in datasets contaminated with noise and where rock interfaces do not exhibit a consistent impedance contrast amenable to human interpretation. Very recently, volumetric computation of curvature has been introduced, which dispels the need for consistent horizons in the zone of interest (Al-Dossary and Marfurt, 2006). By first estimating the volumetric reflector dip and azimuth that represents the best single dip for each sample in the volume, followed by computation of curvature from adjacent measures of dip and azimuth, a full 3D volume of curvature values is produced. There are many curvature measures that can be computed, but the most-positive and most-negative curvature measures are the most useful in that they tend to be most easily related to geologic structures. Volumetric curvature attributes are valuable in mapping subtle flexures and folds associated with fractures in deformed strata. In addition to faults and fractures, stratigraphic features such as levees and bars and the faulting associated with diagenetic features such as karst collapse and hydrothermallyaltered dolomites also appear to be well-defined on curvature displays. Channels appear where differential compaction has taken place.
Volumetric estimation of curvature
Multispectral curvature estimates introduced by Bergbauer et al. (2003) and extended to volumetric calculations by Al Dossary and Marfurt (2006) can yield both long and short wavelength curvature images, allowing an interpreter to enhance geologic features having different scales. Tight (short-wavelength) curvature often delineates details within intense, highly localized fracture systems. Broad (long wavelength) curvature often enhances subtle flexures on the scale of 100-200 traces that are difficult to see in conventional seismic, but are often correlated to fracture zones that are below seismic resolution, as well as to collapse features and diagenetic alterations that result in broader bowls.
Al Dossary and Marfurt (2006) introduced a ‘fractional derivative’ approach for volume computation of multispectral estimates of curvature. They define the fractional derivative as

where the operator F denotes the Fourier transform, where u is an inline or crossline component of reflector dip, and where α is a fractional real number that typically ranges between 1 (giving the first derivative) and 0 (giving the Hilbert transform) of the dip. The nomenclature ‘fractional derivative’ was borrowed from Cooper and Cowans (2003); however, an astute mathematician will note that the i is not in the parentheses. In this manner we can interpret equation 1 as simply a low pass filter of the form kx(a-1) applied to a conventional first derivative. Given the spectral response, particularly when multiplied by the spectral response of the derivative operator, we will call the resulting images “short-wavelength” and “long-wavelength” curvature in the figures that follow.
The space domain operators corresponding to different values of α mentioned above are convolved with the previously computed dip components estimated at every sample and trace within the seismic volume. In additional the directional derivative is computed using a circular rather than linear window of traces, thereby avoiding a computational bias associated with the acquisition axes. Lower values of α decrease the contribution of the high wavenumbers, thereby shifting the bandwidth towards longer wavelength. Thus full 3D curvature attribute volumes are available for analysis at different scales, which helps extract meaningful and subtle information from seismic data.
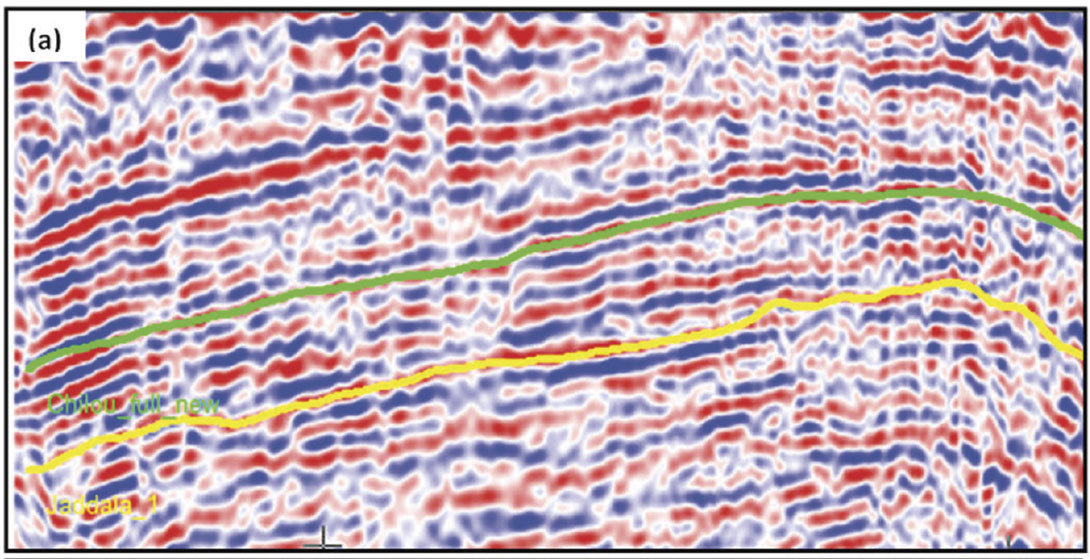
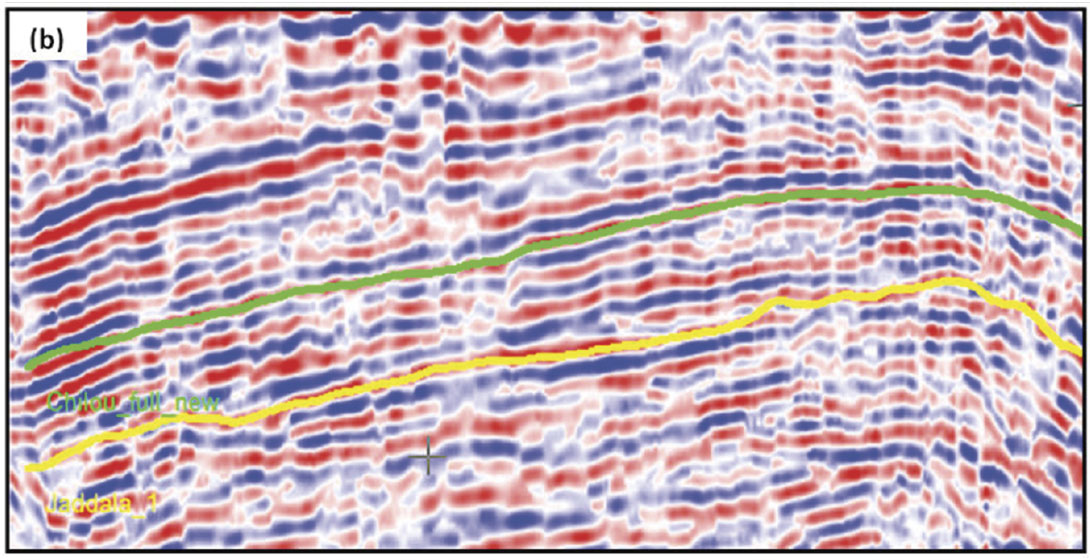
The quality of these seismic attributes is directly proportional to the quality of the input seismic data. In practice, even with careful acquisition, processing, and imaging, our data will still exhibit a certain level of noise. So it is advisable that the data going into an attribute computation is cleaned up. We made use of structure-oriented filtering (PCfiltering) for this purpose and getting results that exhibit reflections as more coherent with sharper features (Chopra and Marfurt (2008)). Figure 8 shows segments of a section before and after PC filtering. Notice the cleaner look as well as the sharper definition of the fracture- like features on the PC-filtered data as compared with the input.
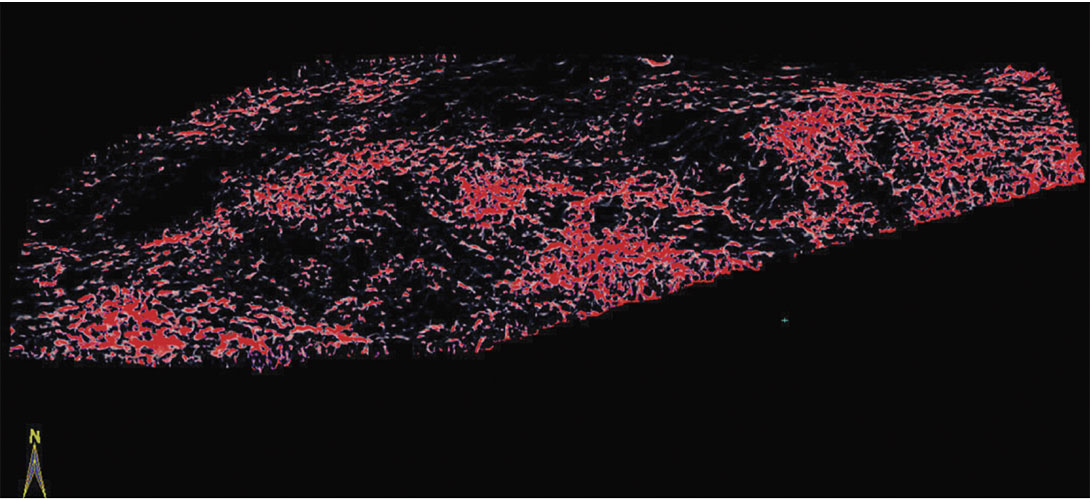
In Figure 9 we show the most-positive curvature horizon slice at Chilou level. Only the high values are displayed and the other values have been made transparent. Such a display shows the features of interest only, which happen to be fractures as represented by the clusters of red lineaments.
5. Calibrating curvature attribute with existing well results
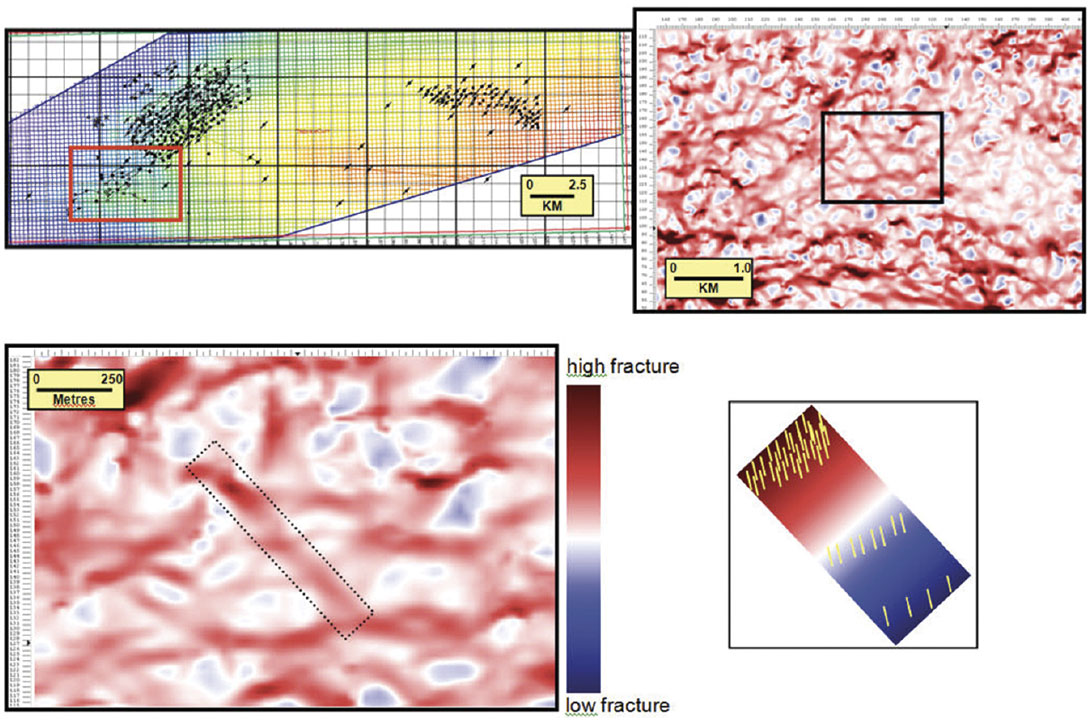
Extensive FMI data has been acquired over the Tishrine-West field. As described in the earlier section, type-I fractures with North-South orientation, are found to be dominant in Chilou-A, Chilou-B1, Chilou-B2, Chilou-B4 and Jaddala reservoir unit. Type-II fractures, with East-West orientation, are observed in the Chilou-B3 reservoir unit. Using this information, and the time slices based on maximum positive curvature, a model has been developed that forms the basis of horizontal well planning (Figure 10). According to this model, the amplitude on the time slices is a measure of fracture density. The time slices do not indicate the actual orientation of the individual fractures, but they do indicate the orientation of their spatial distribution. The fractures themselves have North-South or East- West orientations, depending whether they are Type-I or Type-II respectively. In our well planning, areas of high fracture density are targeted.
Before applying the curvature attribute for well planning, the curvature slices were compared to known well results. Six vertical wells and four horizontal wells were chosen for this calibration exercise. A few examples of the calibration exercise are described below.
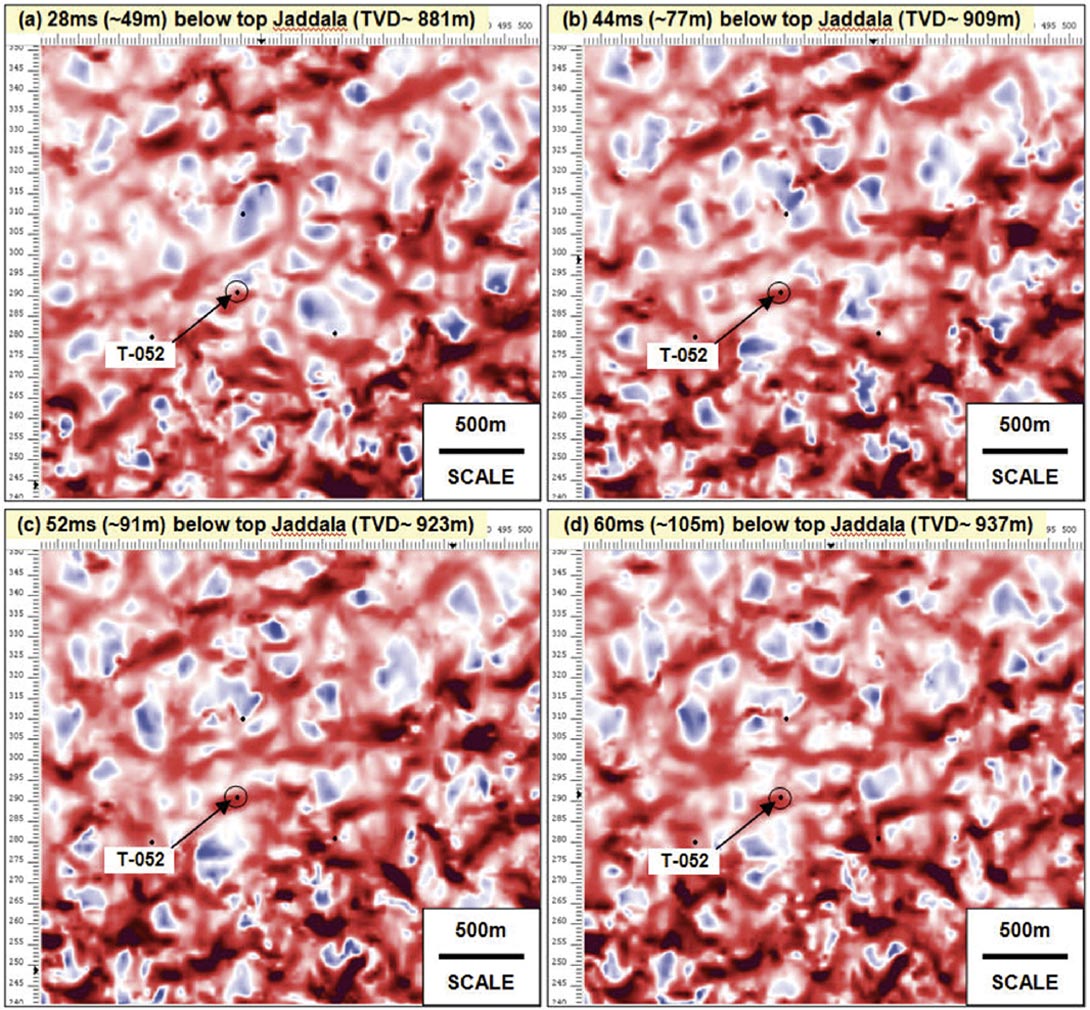
Figure 11 shows maximum positive curvature slices through the well T-052. This well has been on production with average daily production of around 145 bbls/day with cumulative production to date of over 1.0 mmbbls. The well was drilled into the Jaddala formation and there are 4 principal producing zones. The attribute slices (Figure 11) indicate that the well penetrated regions of high fracture density corresponding to these producing zones. Though no image logs were available, the excellent production figures as well as the observed fluid losses during drilling confirm the presence of fractures at these zones. Thus, a good agreement between the seismic attributes and well results was observed.
A similar exercise was performed with the well T-217. This well was primarily drilled for the purpose of water disposal, to the deeper Shiranish formation in the late Cretaceous. No fractures were encountered through the Jaddala, but significant fractures were observed on the image log through Chilou-B reservoir units (Figure 12). Figure 12 also shows a comparison between the image log and a few key curvature slices at this well location. The curvature slices could successfully predict the lack of fractures at the upper Jaddala, (Figures 12b and 12c) and the fracturing at upper Chilou-B3 (Figure 12e). However, the curvature attribute was unable to predict the high intensity fracturing at lower-mid Chilou-B3 (Figure 12d). Interestingly, a strong high amplitude feature is observed just south of the well T-217 at the lower-mid Chilou- B3 level. So it is possible that incorrect spatial positioning of the seismic could have resulted in this discrepancy between seismic attribute and well results at this level.
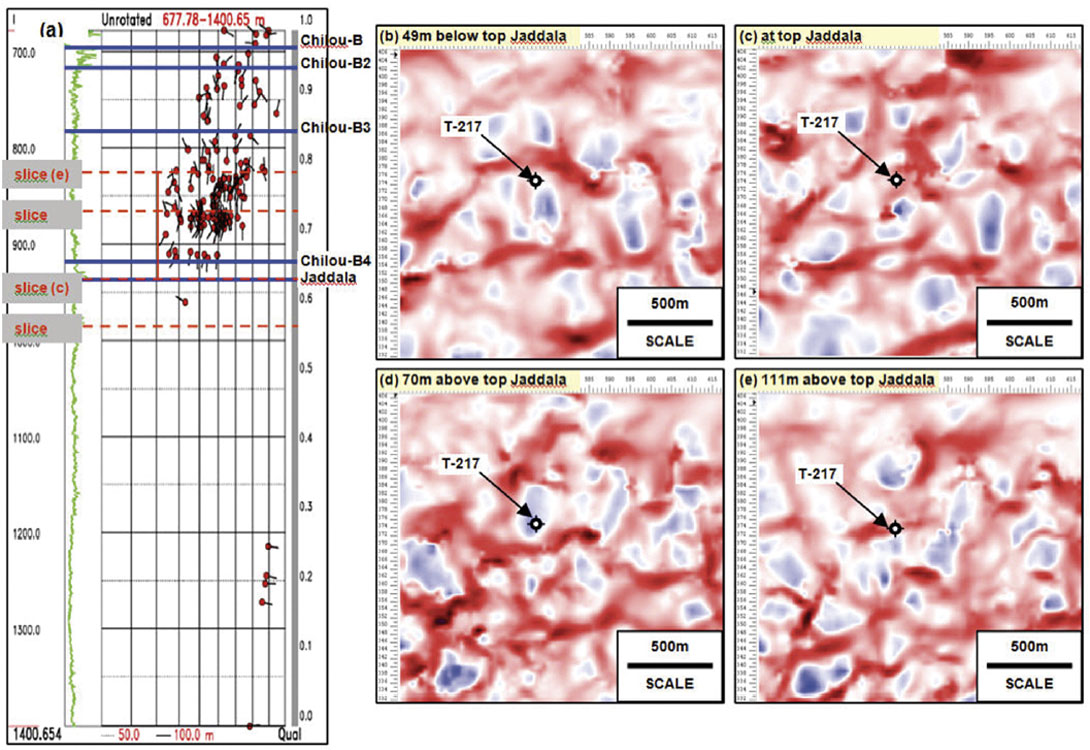
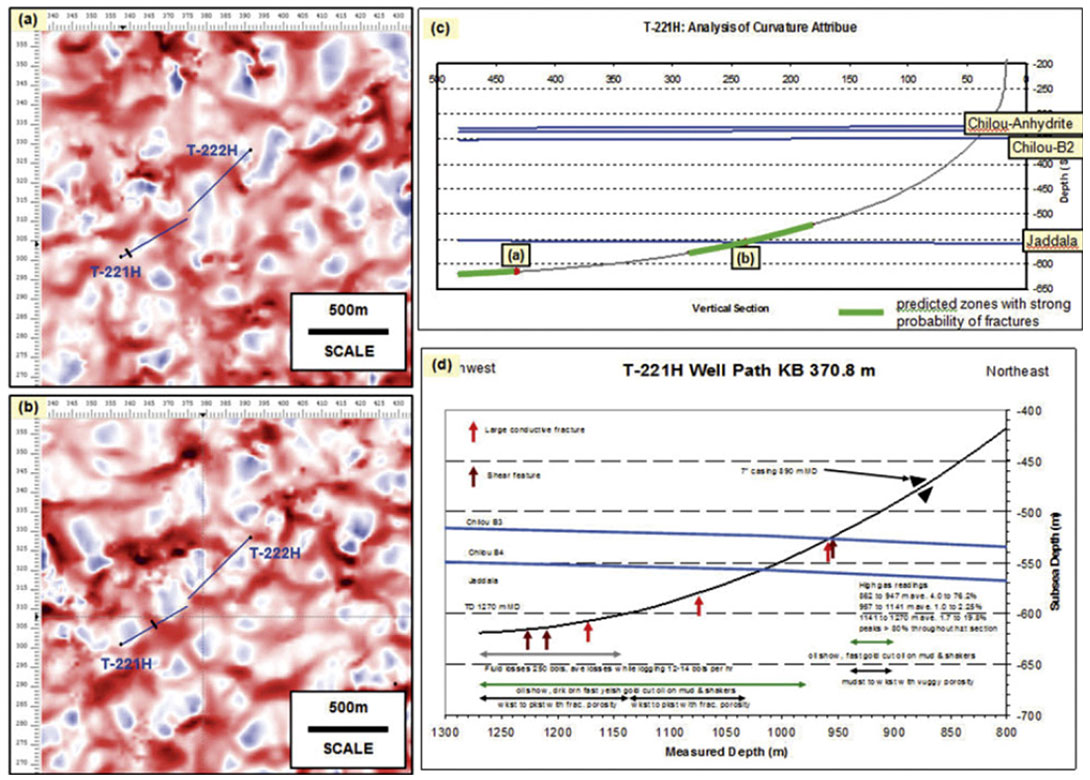
Figure 13 shows another calibration exercise over a horizontal well, T-221H. The analysis of the curvature slices predicts two main zones which have high probability of encountering fractures in the lower Chilou and the Jaddala (Figure 13c). The actual well results are shown in Figure 13d. Fractures were encountered at the Chilou-B4-Jaddala boundary as well as the at the Jaddala formation near the TD of the well. These results agree very well with those expected from the analysis of the curvature attributes.
The above calibration exercise suggests that there is a strong correlation between the anomalies observed on the curvature attribute volume and the presence of fractures in the subsurface. Thus, a well planning workflow was developed to plan the horizontal wells such that the wells encounter the highest density of fractures. This workflow is described in detail in the following section.
6. Well planning using curvature attribute
Curvature attributes were computed for the entire Tishrine 3D survey. Although, both most positive curvature and most negative curvature volumes were created, the former was predominantly used for well planning. Since most of the faults at the reservoir levels (Chilou and Jaddala) have low offsets, and the faults are near vertical at these formations, the error due to this approximation should be negligible.
To illustrate the well planning workflow, we have selected T-266H as an example (Figure 14). The first step is to identify the reservoir target and the general direction of the well. The reservoir target was identified based on the results of a nearby pilot (vertical) well, or the production characteristics of neghbouring wells. To identify the general direction of the well, the local structure was taken into account. The preference was to drill the horizontal well along strike, however, wells have been drilled successfully both along updip and downdip trajectories.
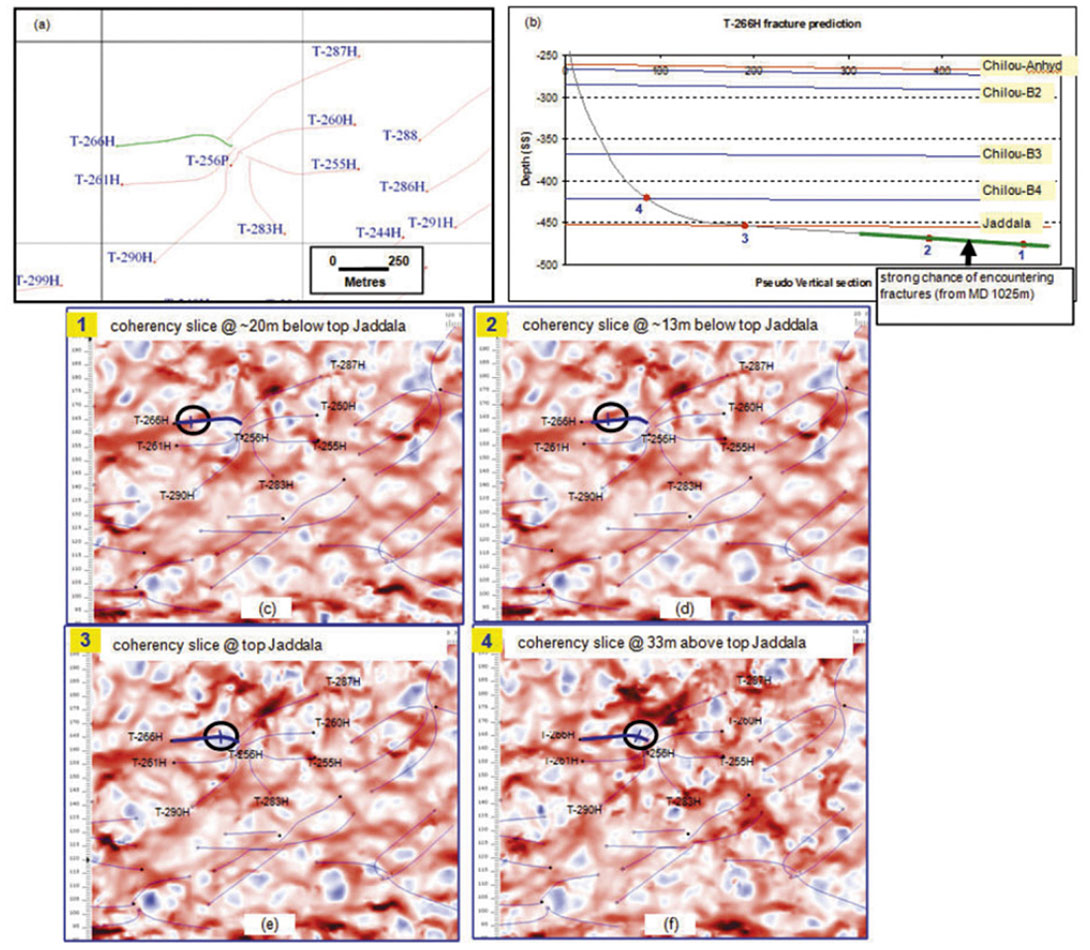
Once the general well trajectory and reservoir target had been identified, several specific target points were chosen based on the curvature slices and the depth structure maps. These points were used to come up with a preliminary well trajectory. This well plan was further refined by reviewing the drilling considerations. The refined well plan was imported in the seismic database and a fracture “prognosis” is created, based on the curvature slices. If the “prognosis” was satisfactory, the well plan was approved.
In this particular example (T-266H), the well encountered fluid losses (from 5 bbsl/hr to around 20 bbls/hr) during drilling as soon as it reached the horizontal section. The losses increased considerably, to over 70 bbls/hr, near the TD of the well. An examination of the time slices in Figure 14 indicates a very strong anomaly on the maximum positive curvature volume at the TD of this well. The well has been an excellent producer, averaging at 430 bbls/day with cumulative production of over 180,000 bbls till date.
7. Results
To date, 105 wells (horizontals and vertical pilots) were drilled based on the curvature attribute analysis. Out of these, 88 wells encountered fractures, indicating a success of 83.8%. Most of the wells that encountered fractures had fluid losses during drilling. In a few wells, though losses were not observed during drilling, subsequent FMI logs indicated presence of fractures. If only the horizontal wells are considered, out of a total of 87 wells, 75 encountered fractures; a success rate of 86.2%.
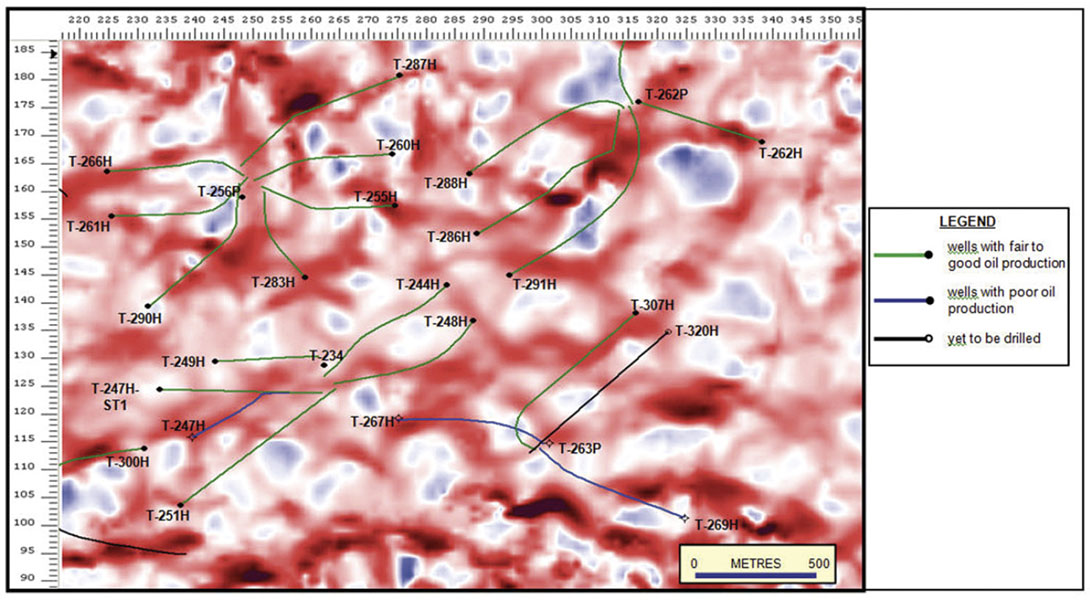
Of particular significance regarding the success of the curvature attribute interpretation are the drilling results over the south-west extension of the Tishrine field. Figure 15 shows a maximum positive curvature slice at 20m or 12 ms below the top of Jaddala, the primary reservoir interval in this part of the field. Out of the 26 wells drilled over this area, 23 encountered fractures, a success rate of 88.5%. If we consider only the 22 horizontal wells, 21 encountered fractures with losses while drilling; suggesting a success rate of over 95%. The production results over this southwest extension had a considerable impact over the growth in reserve estimates for the Tishrine-West field.
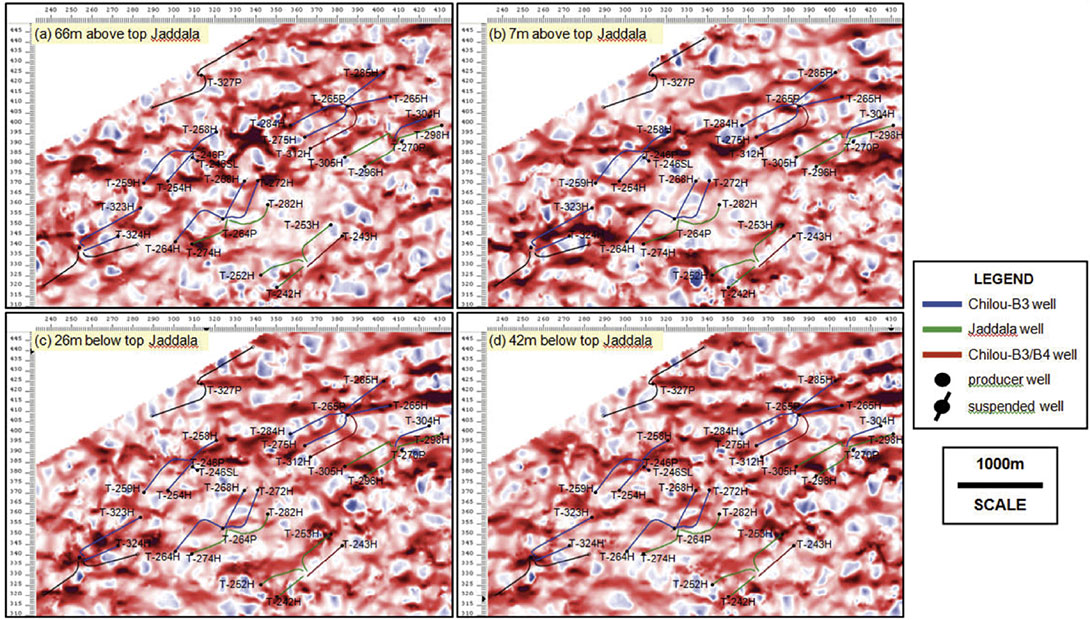
The curvature attribute interpretation was also used in the appraisal of North-West extension of the Tishrine-West field. Figure 16 shows the four horizon slices of the maximum positive curvature at the four main target reservoirs in this part of the field. Of the 30 wells drilled in this area (both horizontal and vertical), 21 encountered fractures or losses during drilling. If only the horizontal wells were considered, 19 out of the 26 wells encountered fractures, a success rate of 73%. A detailed examination of the curvature slices reveals that the attribute appears much noisier over the North-West area compared to that over the South-West.
8. Summary and Conclusions
The Tishrine 3D seismic survey had a tremendous impact on the value of the Tishrine block. Interpretation based on the 3D seismic data led to the drilling of key wells in the North-West and South-West part of the block. Encouraging results from these wells, and production from subsequent appraisal wells, significantly increased the reserves estimates for the field. The curvature attributes have been successfully applied to target areas of high fracture density and the production rates for recent wells, are substantially higher than those drilled prior to using the 3D seismic attributes.

Acknowledgements
We would like to thank the management of Tanganyika Oil, its parent company Sinopec International Petroleum Corporation (SIPC) and our partners, Syrian Petroleum Corporation (SPC), for support and permission to publish this work. We are also grateful to Dr. Essam Zaghloul, Mr. Randy Gill, Mr. Warren Schatz, Mr. Ahmed Rahuma and Mr. Antoun Al Khori for valuable discussion and input. The authors would also like to thank P-wave imaging for processing the 3D seismic data.
Related Reading


Join the Conversation
Interested in starting, or contributing to a conversation about an article or issue of the RECORDER? Join our CSEG LinkedIn Group.
Share This Article