The Saskatchewan potash industry is over 60 years old now and has survived and been profitable thanks in part to geophysics. The potash deposits in Saskatchewan are globally unique, in that they are very large, flat and relatively unaltered, which permits productive low-cost mining. However, water inflows are a serious threat to operations and are typically caused by proximal contact with several well-known kinds of geohazards. Seismic exploration has become the main method for detecting these geohazards. This paper reviews several well-known inflows that occurred at two mining operations in southeastern Saskatchewan and discusses the geohazards that were thought to cause them. The inflows occurred prior to the adoption of seismic by the industry as the “tool of choice” for mapping geohazards. While seismic is a good tool for detecting and mapping the geohazards, it is limited in its ability to fully quantify them. We show that other geophysical methods, such as refraction and EM, can offer further insights. Results from time-domain EM collected in a mine, combined with forward, full-space modeling of the EM response, are used to elucidate a well-known type of geohazard anomaly at the Nutrien Rocanville potash mine.
Introduction
A common hazard to potash mining is water inflows. Any uncontrolled ingress of water or undersaturated brine into a potash mine can cause tremendous damage by eroding pillars, thus reducing support for the overlying strata, leading to further breaking of the caprock and enhanced flow paths. Twelve of the thirteen underground conventional potash mines in Canada that have come into operation since the 1950’s have dealt with inflows at some time, but of those, three have been permanently closed due to severe flooding, one has been converted to a solution mine, and another four are managing ongoing inflows but continue to operate (Prugger, 2018).
Three well-known geohazards are common causal factors that are a ubiquitous threat to potash mining (after Gendzwill and Stead, 1992):
- Salt-collapses. Small and large salt collapse structures that can provide permeable conduits to overlying aquifers if they are intersected by a mine room or mining-induced fractures.
- Thin-back. Mining-induced or natural fractures through a “thin” caprock (known as the “back” or more locally, the “salt-back”) connect the mining horizon with overlying permeable aquifers, thus providing conductive fracture systems for brine to flow into the mine;
- Connate brine. These brine “pockets” within the host orebody can be intersected by mining operations. Typically, such brine pockets are fully saturated and finite in size but can be under high pressure and contain dangerous gases and so pose some threat to operations.
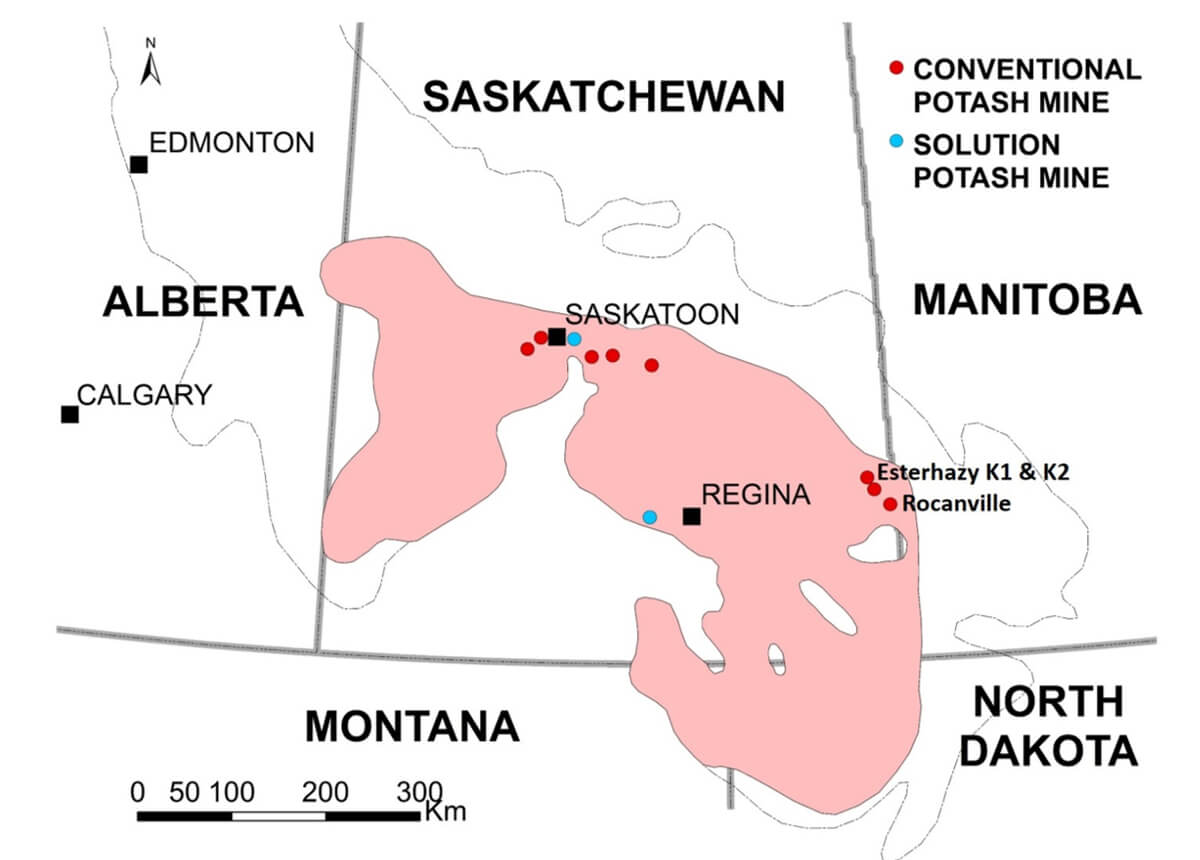
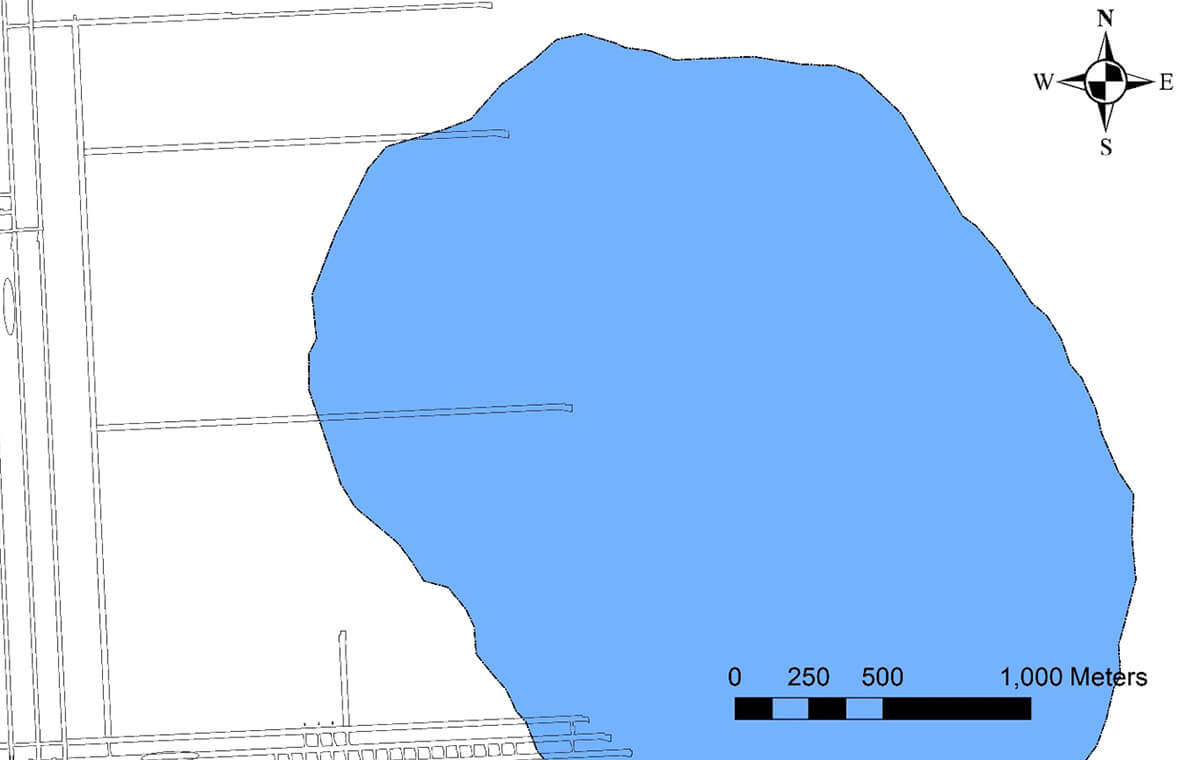
The risk of mining into collapses is effectively mitigated by routine use of 3D seismic. Connate brines are considered a “nuisance” by operations and are dealt with reactively when they are encountered. This paper will briefly discuss a case history of an encounter with a salt collapse at a potash mine but will focus mainly on the second geohazard and efforts to better quantify the potential severity which this hazard poses to the Rocanville potash mine in Saskatchewan, which is operated by Potash Corporation of Saskatchewan Inc., a subsidiary of Nutrien Ltd (Figure 1).
Saskatchewan Potash Geology
Much of southern Saskatchewan is underlain by the Prairie Evaporite Formation, a layered sequence of salts and anhydrite that contains one of the world’s largest deposits of potash. The potash is extracted from the predominantly sylvinite ore and has its main use as an ingredient in fertilizer. In the conventional potash mining belt of Saskatchewan (Figure 1), the 100 m to 200 m thick Prairie Evaporite Formation is overlain by approximately 500 m of Devonian carbonates, followed by 100 m of Cretaceous sandstone, and 400 m of Cretaceous shales and Pleistocene glacial tills to surface, and is underlain by Devonian carbonates (Fuzesy, 1982). A seismic section representing Saskatchewan’s stratigraphy is shown in Figure 2 (Funk et al., 2019).
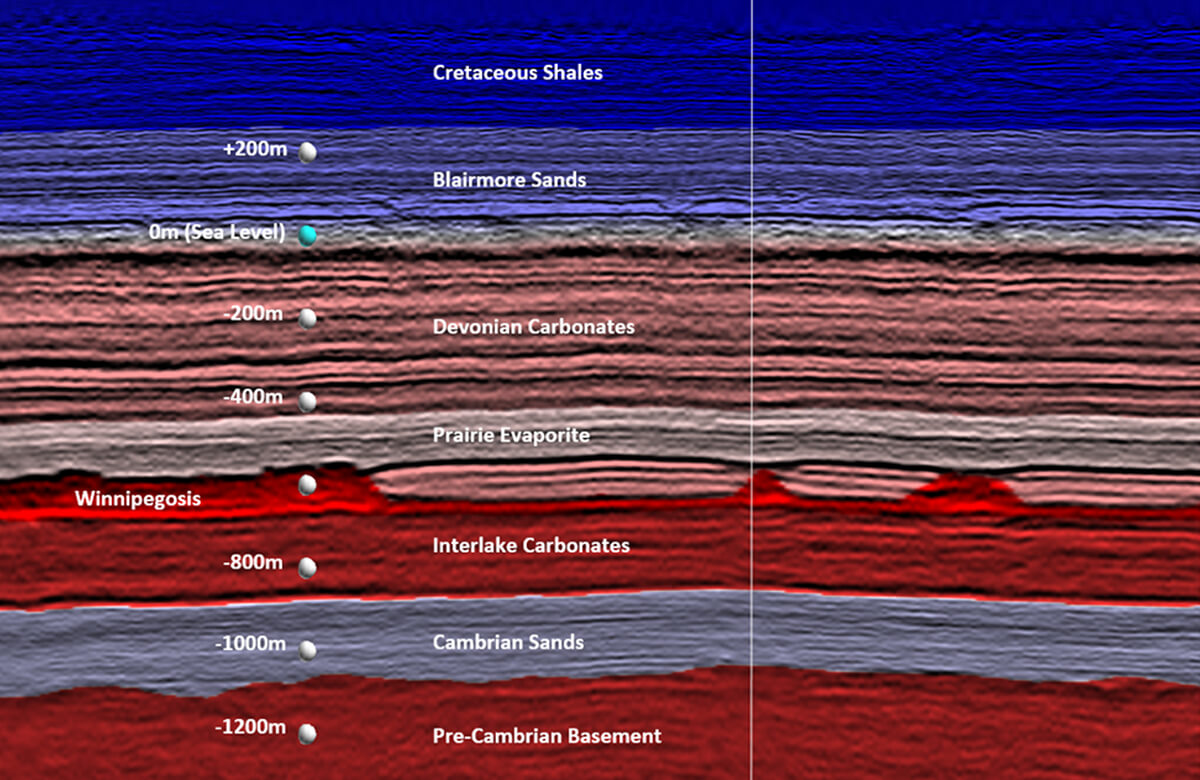
The formations of direct geological significance to potash mining in Saskatchewan are contained within the Elk Point Group. In descending stratigraphic order these include the Dawson Bay, Prairie Evaporite, Winnipegosis, and Ashern Formations. In the Rocanville area, the Dawson Bay Formation can be roughly subdivided into two parts: the Lower Dawson Bay being a non-fractured, competent, non water-bearing (“dry”) carbonate unit; and the Upper Dawson Bay being water-bearing (“wet”) carbonate unit (although pore-plugging with secondary halite does occur locally). The dry competent Lower Dawson Bay carbonate unit coupled with the relatively thick Prairie Evaporite salts that separate it from the potash level essentially form a physical inflow barrier or “thick-back” for potash mining. A “thin-back” geohazard occurs when the Lower Dawson Bay is not dry, thus providing a potential permeable connection to the wet Upper Dawson Bay. Below the Dawson Bay Formation is the Prairie Evaporite Formation which, in the southeastern part of Saskatchewan, contains three potash bearing members: Belle Plaine, Whitebear and Esterhazy. Of these, only the Esterhazy Member is economical by conventional mining methods in the Rocanville area. Underlying the Prairie Evaporite Formation is the Winnipegosis Formation, which in general can be grouped into an upper dolomitized reefal carbonate shoal member, and a lower dolomitized basinal micrite member. Below the Winnipegosis Formation is the Ashern Formation, an argillaceous dolomudstone (Glass, 1990).
Historic Inflows
In 1985, a significant inflow of brine was discovered at the Esterhazy K2 mine (now operated by Mosaic, Figure 3). Several geological factors have been cited by Van Sambeek (1993) as contributors to this inflow, but in general, it is believed that it was the result of localized weakness in Lower Dawson Bay Formation (thin-back geohazard scenario). This hypothesis is supported from results of in-mine upward-looking seismic refraction surveys that were used for determining both the thickness of the salt-back above the mine and the velocity of the Lower Dawson Bay Formation (Gendzwill and Unrau, 1996). The study identified a region of low seismic velocity which was thought to represent highly porous and/or fractured Lower Dawson Bay limestone. Additionally, a notable decrease in interval velocities measured from geophysical wireline logs through the Lower Dawson Bay was apparent in the inflow zone, and those velocities were also in good agreement with velocities computed from the refraction studies.
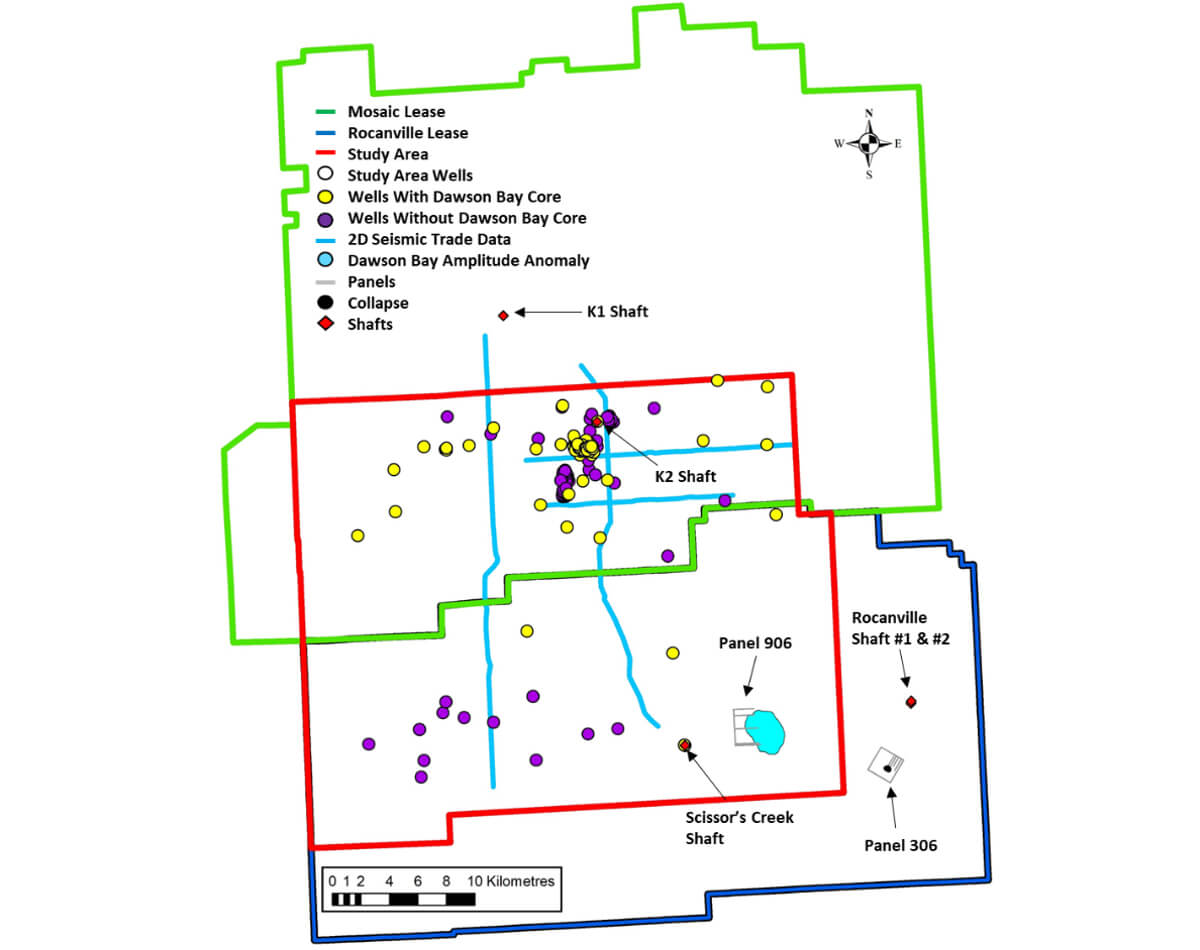
Just a year prior to the commencement of the K2 inflow, the Rocanville mine (Figure 3) also had a significant inflow (Prugger and Prugger, 1991). On November 11th, 1984, mining operations intersected a salt-collapse in a single entry mined in Panel 306. Within a week, brine started to flow at high rates from the mining face at the end of the room. Initial flow rates were 2,650 to 3,400 litres/minute with rates as high as 19,000 litres/minute, before eventually leveling out to about 7,600 litres/minute. Results from geochemical analysis of the brine clearly showed its origin was the Dawson Bay Formation. The placement of a series of concrete bulkheads in 1985 effectively stopped the inflow, and to this day the Rocanville mine has remained “dry”. Typically, inflows of this size can’t be stopped; however, it was fortunate that the area surrounding the salt-collapse was not mined at the time, and the ore zone was mostly salt (barren of potash) such that the brine did not dissolve the pillars surrounding the bulkheads.
To better understand the geohazard, several geophysical methods were conducted in the Panel 306 area, including: seismic tomography (Bostock, 1988), EM tomography (McGaughey and Stokarczyk, 1991), time domain EM, and upward-looking seismic refraction surveys. These surveys confirmed the presence of a collapse structure, the primary cause of the inflow. More work was done throughout the mine in the 1990’s and it was generally thought that the Dawson Bay was “normal” throughout the Rocanville area.
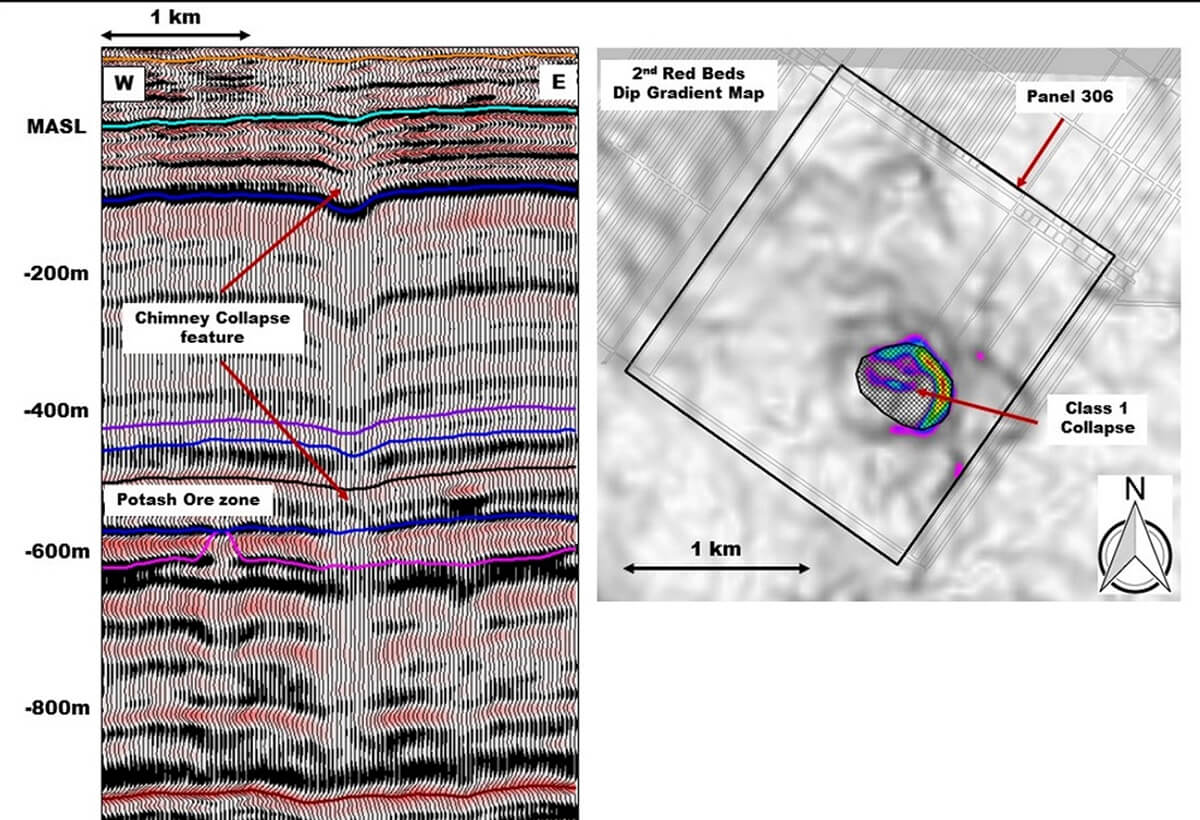
The potash industry in the 1980’s routinely used 2D seismic for mapping the stratigraphy and identifying geohazards. Unfortunately, in the Panel 306 area none of the 2D seismic directly imaged the collapse, although there were indications of in-mine anomalous geology in the area. A 3D program was completed in May of 1989 (5 years after the inflow), and the collapse structure was clearly imaged, having a cross-sectional area of about 17 hectares at mining level. In 2016, this area was seismically imaged again (Figure 4), and with the modern 3D seismic, a portion of the Dawson Bay in this panel was classified as “anomalous”. Back in 1989, this was not recognized. Further exploration at Rocanville in the 2000’s identified other isolated areas that have both collapses and anomalous Dawson Bay seismic signatures.
Quantifying Geohazards in the Dawson Bay Formation
Starting in 2008, 3D seismic was collected in preparation for a westward expansion of the Rocanville mine. Several low amplitude Dawson Bay anomalies were imaged by these surveys; one of the anomalies is shown in (Figure 5). These anomalies have some commonalities: they have sharp boundaries from the “normal” seismic signature and their amplitudes are both high and uniform. There was speculation that these anomalies were a potential geohazard. Unfortunately, none of these anomalies were sampled by drill holes on the Rocanville lease. It is not common to drill on potash leases because an abandoned drill hole can become a conduit to an aquifer. To avoid forming a connection to overlying aquifers, potash mines leave “pillars” around abandoned drill holes thus sterilizing ore in those areas. Fortunately, 2D seismic trade data was available that extends over known anomalies. Some of the lines intersected drill holes with core and wireline log suites, and several of the lines extended onto the Rocanville lease (Figure 3). The study area has 169 drill holes which intersect the Dawson Bay, and of those, 81 have core. Many of the drill holes are clustered around the area where the 1985 inflow at Esterhazy started. However, across the study area, there is still a reasonable distribution of drill holes for characterizing the regional Dawson Bay variations. Furthermore, 23 of these drill holes are proximate to the 2D seismic lines and have both density and sonic logs. These drill holes were used to gain further understanding of the nature of the Dawson Bay, and specifically to seek an explanation for the observed seismic anomalies. The core and wireline logs were analyzed, and synthetic seismograms were created to model the various geological scenarios.
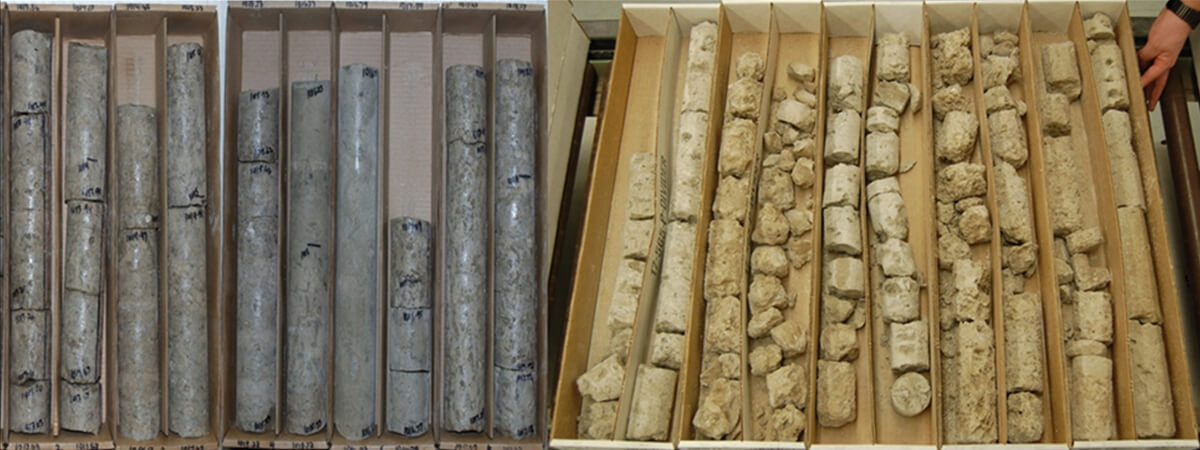
Core from 13 drill holes was available for detailed core-logging. Some drill cores exhibited characteristics atypical of a “normal” Dawson Bay. These unusual features were often found primarily within the upper portion of the Lower Dawson Bay and included a pervasive (or in some cases discreetly banded) corroded and/or pitted carbonate texture coupled with zones of enhanced vuggy macro porosity. Larger irregular vugs were often observed to contain a soft, white chalky carbonate material, and networks of randomly orientated, very fine, open, hairline micro-fractures with poor core recoveries. The term “abnormal” Dawson Bay was often used to describe these cores (Figure 6).
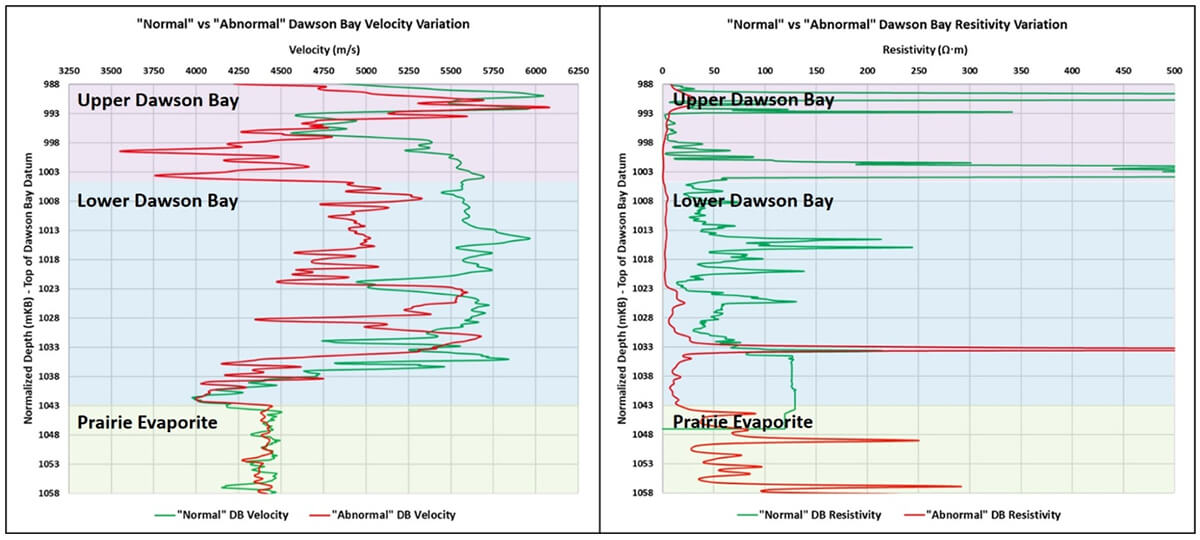
In total, core from 7 of the 13 drill holes reviewed were classified as “abnormal”. Petrographic analysis confirmed that secondary (i.e., possibly solution enhanced) porosity was the dominant porosity type, and often resulted in isolated macropores. In addition, whole Core CT scans of the abnormal Dawson Bay showed that abnormal textures represent zones of micro-fracturing resulting in enhanced secondary porosity. Geophysical wireline logs were also reviewed to compare geophysical rock properties between a “normal” and “abnormal” Dawson Bay. Sonic log comparisons showed an average decrease in acoustic velocities of about 600 m/s across the transition from Lower to Upper Dawson Bay where the Dawson Bay was categorized as “abnormal”. The “abnormal” drill holes also showed a lower resistivity compared to normal drill holes through the Dawson Bay (Figure 7).
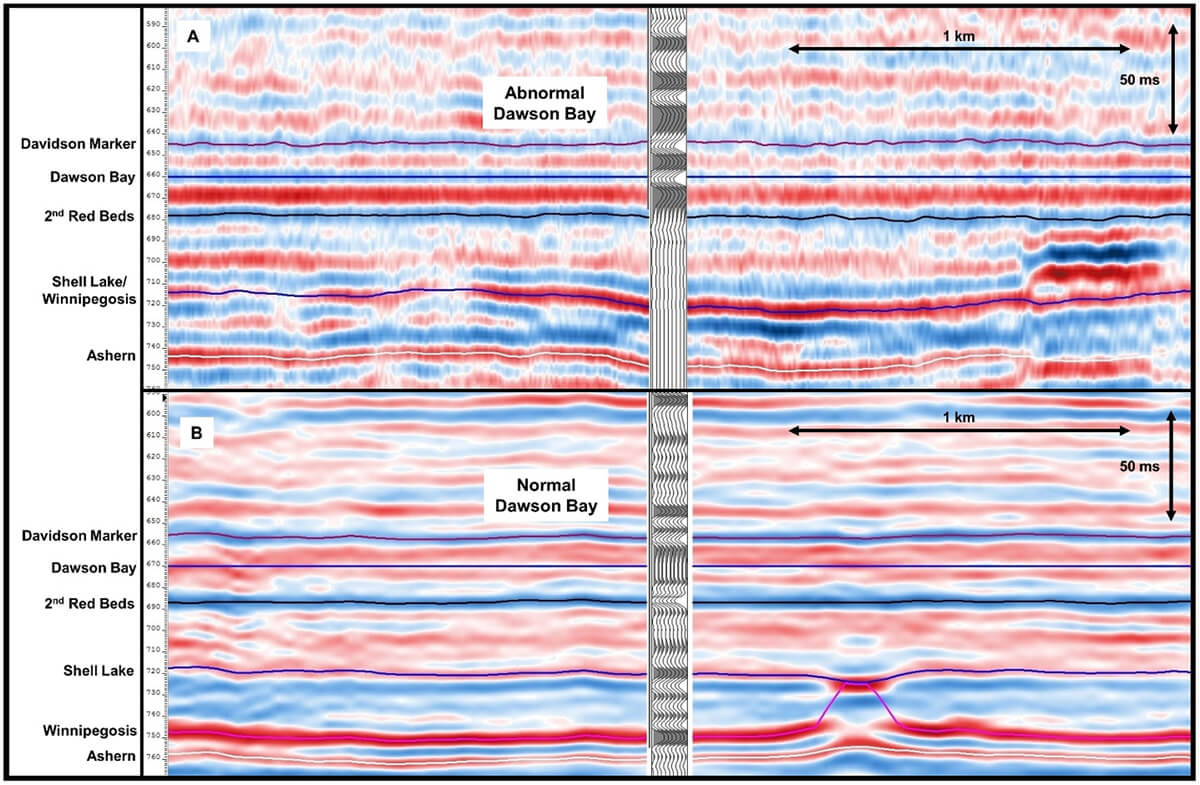
To tie the drill hole data back to the available seismic, synthetic seismograms were created for drill holes situated near four pertinent 2D seismic lines within the study area. The synthetic seismograms were then used to compare whether the drill holes categorized with an “abnormal” Dawson Bay matched the anomalies mapped by seismic, and if so, how closely. The seismic signature for abnormal Dawson Bay is consistently marked by a strong trough at the top of the Dawson Bay horizon followed by an immediate strong peak. Figure 8 shows a 2D seismic section which overlies abnormal Dawson Bay and an arbitrary seismic section taken from the 2015 Rocanville 3D merged seismic volume which overlies normal Dawson Bay. In general, for synthetics generated from both anomalous and normal Dawson Bay drill holes, the associated Dawson Bay signature matches the actual seismic response well. The only exceptions to this were ties with some of the older 2D seismic lines where data quality was poor; these cases were treated as outliers.
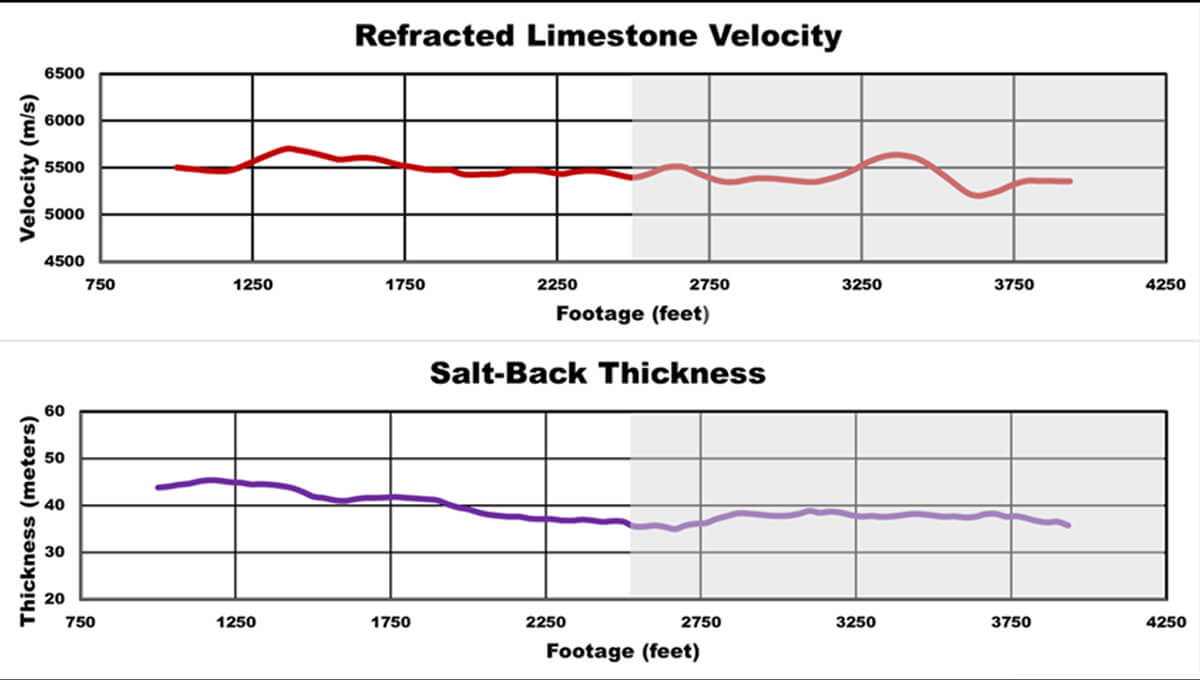
In November of 2016, refraction surveys were completed at the Rocanville mine in two mine entries that terminate under a Dawson Bay anomaly in Panel 906 (Figure 5). The results from one of the surveys are shown in Figure 9. While a decrease in both velocity and salt-back thickness (the Prairie Evaporite salt between the roof and Dawson Bay Formation) are observed under the anomaly, the differences are very subtle and considered to be within the realm of normal. These results are less pronounced than the findings from the refraction surveys carried out at the inflow zone in the K2 mine discussed earlier (Gendzwill and Unrau, 1996), but in general are consistent with findings from previous refraction surveys at Rocanville. It was observed in both drill hole core and in the geophysical wireline logs that there is a spectrum to the “severity” of these anomalies, which may explain why anomalous velocities were not observed in the refraction survey. In other words, the zone of enhanced porosity in the upper portion of the Lower Dawson Bay was a classic “hidden layer” and the refracted energy traveled through the base of the Lower Dawson Bay where the velocities are considered “normal”.
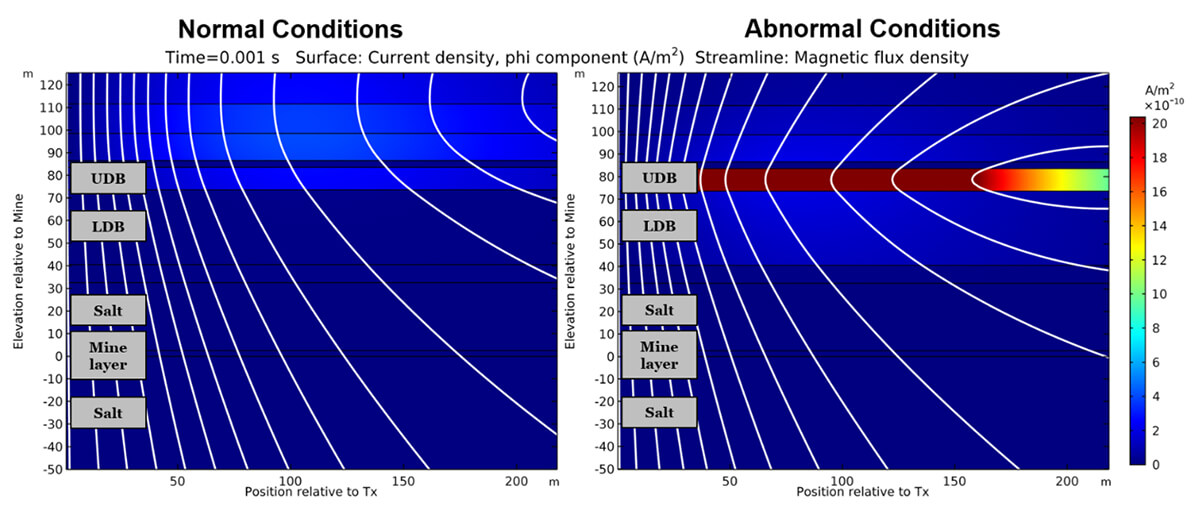
In addition to the anomalous velocities observed through abnormal Dawson Bay zones, resistivity was also observed to be significantly lower in these zones. As such, EM is another method that can be used in mines to map areas of lower electrical impedance. However, it is challenging to collect EM in mines due to the abundance of highly conductive metallic infrastructure and the confined spaces Even after those limitations are dealt with, however, there is also the issue of full-space signals being produced from lithology both above and below the transmitter. Modern computer EM modelling can do much to mitigate this challenge, enabling us to not only fully integrate the full-space environment into our forward models, but also map the contributing current diffusion as it propagates in the model space (Figure 10). The examples shown here are PDE-based numerical models produced by a finite element multiphysics simulator (COMSOL Multiphysics) of a normal Dawson Bay environment being compared with an abnormal conductor within the Dawson Bay. In the latter case we can see that the current has diffused a shorter distance in the conductive material near the mine layer and maintained a higher intensity than in the normal conditions. Of course, already existing EM challenges, such as equivalency, still exist; however, integration with other geophysical methods combined with a drill hole-developed geological model can allow for effective EM mapping and modelling in full-space environments.
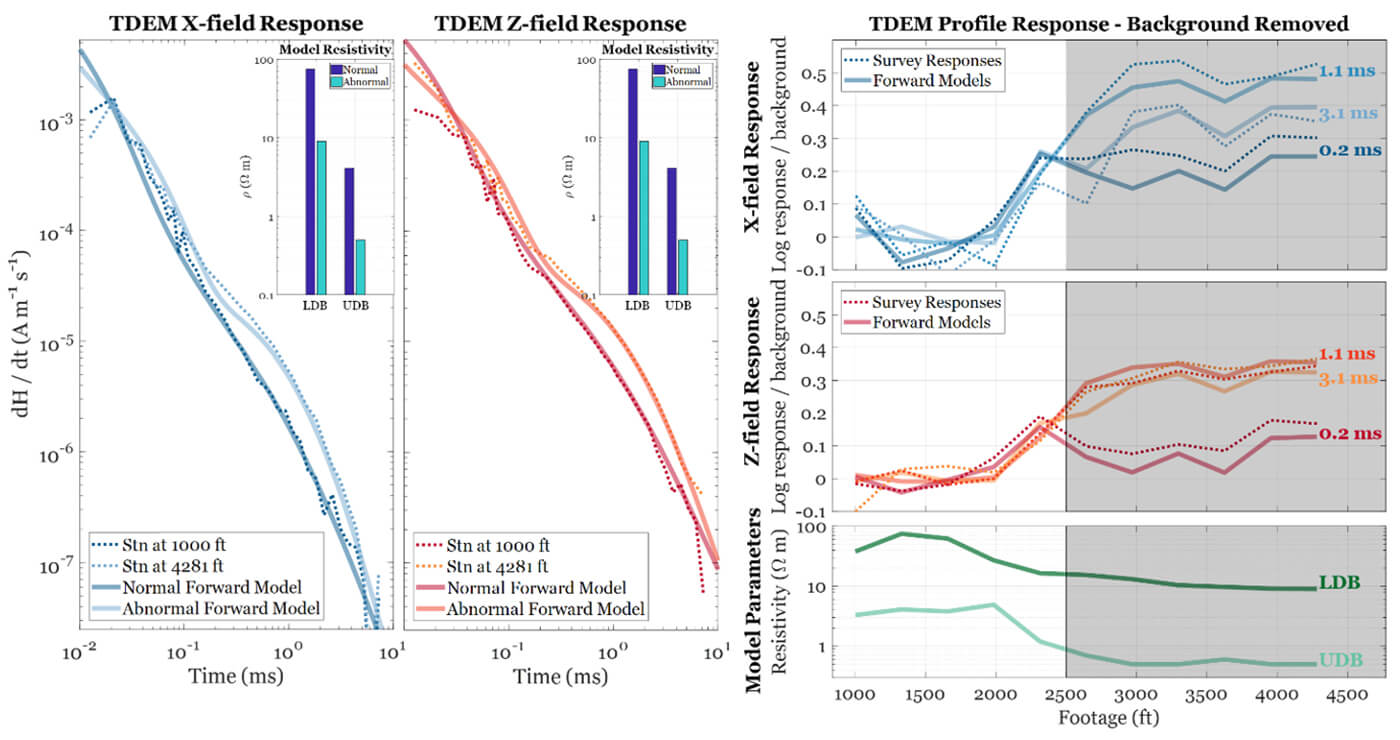
In September 2017, a time-domain EM (TDEM) survey was performed in two mine panels stretching under the known Dawson Bay Anomaly at the Rocanville mine in Panel 906 (Figure 3). The equipment used for this survey included a Geonics TEM-57 Mk2 transmitter operating at 30Hz, as well as a GDD NordicEM24 digital receiver. The survey was performed in the out-of-loop style. Several transmitter–receiver separations were measured. The survey picked up a large and repeatable conductive signature inside the abnormal area on both lines. Figure 11 examines the north line profile (same room as the upward-looking refraction survey, Figure 9) at 40 m Tx-Rx separation. The abnormal area demonstrated a slower decay rate response than the normal area. Through a series of inversions, it was determined that the bulk of the slower decaying signal can be assigned to resistivity decreases in the top portion of the Lower Dawson Bay and base of the Upper Dawson Bay. The decreases were roughly by an order of magnitude for both layers in the models, showing that EM based methods are well-suited for this application because of the large contrasts in known resistivities.
Conclusion
Geophysics has played a major role in both investigating and quantifying geohazards to potash mining in Saskatchewan. Seismic exploration has become the standard tool for detection of geohazards prior to the advancement of mining into new areas. Without seismic, and specifically 3D seismic, it is possible that each of the conventional mines in Saskatchewan would have encountered significant water inflows as a result of mining into undetected geohazards. While seismic has become a “standard” imaging tool in the industry, this paper has shown that other geophysical methods can also make valuable contributions to advancing our understanding of the geology and geohazards. The application of both TDEM and refraction provided an additional level of resolution into a well-known geohazard. Historically, TDEM has not seen widespread use in the industry due to instrumentation limitations and challenges concerning forward-modeling of the EM responses in a full space. With modern EM instrumentation and modeling software, this is no longer a challenge, and TDEM has provided new insights into a thin-back geohazard. As a result of this work, Rocanville operations has decided to cease mining under Dawson Bay anomalies until further investigations quantify the severity of these anomalies and associated risk to mining.

Acknowledgements
We would like to thank the executive management at Nutrien for their support of this work. We would also like to recognize Prof. Sam Butler for his guidance and insights concerns COMSOL Multiphysics and its application towards forward-modeling of EM responses in a full-space. The contribution by Todd LeBlanc was supported in part by a research grant from Mitacs. Finally, we would like to acknowledge Tanner Soroka and Jodi Derkach for their critical review of this paper.
Related Reading


Join the Conversation
Interested in starting, or contributing to a conversation about an article or issue of the RECORDER? Join our CSEG LinkedIn Group.
Share This Article