Abstract
As mines are operating at ever-greater depths, cutting-edge, economically viable technologies must be developed to help explore for, and accurately locate, potentially mineralized bodies. A promising way to meet the challenges of exploring for mineral resources at great depth, and reduce the environmental impact of exploitation, is to take advantage of existing mining installations and tailings facilities to conduct underground-based geophysical surveys. The University of Quebec in Abitibi-Témiscamingue, the Cégep de l’Abitibi-Témiscamingue, and their industry partners Abitibi Géophysique Inc. and Agnico Eagle Mines Ltd., have designed and performed a series of innovative geophysical exploration experiments at a depth of 3 km below surface. Results of 3D modeling, field-testing, and an underground survey at the LaRonde Penna mine indicate that this technique greatly improves the chances of detecting mineralized zones that would probably not be detected from surface surveys. The knowledge gained from this unique experiment has proven invaluable for furthering deep geophysical exploration and development.
Introduction
Canadian mining history began with major discoveries that started in the 17th century (Cranstone, 2002): coal (1672) followed by iron ore (1737), gold (1823) and copper (1846). Since then, major mining camps containing gold, silver, zinc, lead, copper, molybdenum, nickel, petroleum and industrial minerals (e.g. iron, chromium, lithium etc.) have provided significant wealth, particularly through job creation and industrial infrastructures in Canada. The mining industry has therefore always been considered a prime creator of socio-economic benefits in the long-term for Canada’s resource-based economy. It is however, globally, becoming more difficult to find ore deposits, especially in well- explored areas where near-surface deposits have already been discovered through conventional exploration methods. Therefore, the industry must explore more deeply in mature mining districts such as the Abitibi greenstone belt, or else explore in frontier areas and remote areas (e.g., northern Quebec), increasing the risks (and costs) of discovering new resources. In addition, protection of the natural environment requires improving technologies and developing new methodologies to optimize sustainable and responsible exploration for, and exploitation of, energy and minerals. The challenges that this poses in terms of resource valuation, exploration and exploitation cost, and decision-making for new discoveries, illustrate the need for innovation in exploration approaches and methods.
Geophysical methods can be used to investigate the Earth’s interior and detect potential mineral resources, using passive or active sources. In past decades, geophysical data acquisition in the mining sector has been conducted exclusively from the surface or else from very shallow depths (i.e. along drill holes, on the ground, over water, or from the air). Due to limited space and difficult access to tunnels, underground geophysical surveys are still relatively rare.
The LaRonde Penna mine is located in the Abitibi-Témiscamingue region of northwestern Quebec, midway between the Rouyn-Noranda and Val-d’Or mining towns, along the Trans-Canada highway. The mine has been owned and operated, since 1999, by Agnico Eagle Mines Ltd. and is part of a larger mining complex referred to as the LaRonde complex that covers a large part of the Doyon-Bousquet-LaRonde mining camp, where a number of mines have been active since the 1940s. LaRonde Penna is one of the ten deepest mines in the world, and currently operates, from underground tunnels, a polymetallic deposit (gold-, silver-, copper-, zinc- and lead-bearing massive, semi-massive and vein sulphides) to a depth exceeding 3000 meters. The exploitation of this large tonnage deposit (>70 million tonnes) at such depths represents a major success in engineering (geological and mining) and technological development. Many challenges are associated with mining at such great depths, which include the discovery and delineation of new reserves, as well as dealing with complex ground conditions (bedrock stability). With currently available geophysical methods, it is difficult and expensive to detect ore bodies that are hidden at more than 3 km below surface. Thanks to the financial support of the Fonds de Recherche du Québec - Nature et Technologies (FRQNT) and its Partnership Program on Sustainable Development of the Mining Sector, the Université du Québec en Abitibi-Témiscamingue, Abitibi Géophysique, and Agnico Eagle Mines Ltd’s LaRonde Division have jointly designed and carried out a series of pioneering tests for very deep geophysical exploration at the LaRonde Penna mine.
Methodology development
For underground geophysical exploration, three main issues must be considered, since they are especially critical in deep mining conditions:
- First, emitting an electric or electromagnetic field in deep mining tunnels, with the potential presence of explosives and detonators in the nearby environment, raises major safety concerns, and all risks must be completely eliminated.
- Metallic mine installations for rock support can potentially impact geophysical measurements and affect the results.
- Performing geophysical measurements in an active mine can interfere with production operations, which must be avoided to make the technique appealing for an industry that is increasingly pressured to optimize production.
Solving these issues necessitates a specific strategy of development and implementation. The first step is to clearly state the benefits of conducting a survey in a mine environment and to demonstrate the gain in conducting the surveys in the immediate area of interest despite limited underground space. The second step is to properly quantify the potential impact of underground mine infrastructures on geophysical surveys so that interpretations are not biased. Finally, once feasibility is proven and accepted by industry collaborators, the next step is to adapt the approach and setup to the underground conditions.
Safety
The first step of this research project was to validate safety procedures, and evaluate the possible impacts of metallic rock support materials on the electrical and electromagnetic surveys. Previous experience dating to 2013 by industry partner, Abitibi Geophysique, demonstrated that in-mine electrical surveys can be successfully conducted, both safely and without incident. For the LaRonde Penna underground study, extra care was taken for safety considerations. Firstly, the electromagnetic survey was located far from any detonators and conducted outside the blasting period. Furthermore, to respect all mine regulations and guidelines, the proposed geophysical survey had to imperatively avoid interfering with the operation of all production subsystems (power system, hauling, loading, and transportation of workforce and supplies). Cooperation with mine staff and preparation for the underground survey went successfully, with excellent communication between the electrical, geotechnical, and geological departments of the LaRonde Penna mine. Everyone was provided information on the experiment to be conducted, on the instruments to be used, the size and weight of equipment, and the maximum allowable current and frequency range of the emitted electromagnetic fields. This mutual collaboration through a pre-established protocol led to a successful underground test.
Impact of underground infrastructures
In order to improve the stability and to maintain the load bearing capacity of rock near to the boundaries of an underground excavation, shotcrete, mesh and steel sets are widely used in underground mining tunnels (Hoek and Wood, 1987). Since the electromagnetic method observes the response of the conductors which results from the coupling with the emitted electromagnetic field, all the non-geological responses will have to be eliminated as noise, to identify the true response of mineralization. Obviously, metal supports are conductors; however, there is no field study to show their impact to an electromagnetic survey. 3D modeling can help us learn about the behaviour of the electromagnetic field in an underground whole-space (conventionally, it is measured and simulated in a half-space, i.e., in above ground applications). Unfortunately, the 3D code that we used to calculate the primary electromagnetic field does not take into account the resistivity of the surrounding materials (mine infrastructures); consequently, the simulated primary electromagnetic field forms a sphere around the transmitter in the tunnel. However, according to the modeling of the secondary electromagnetic field (induction), there should be no induced current flow across the tunnel; this is an indirect indication that the metal objects are not electrically connected with the ground, i.e. if there is no current injected directly into them (see section below).
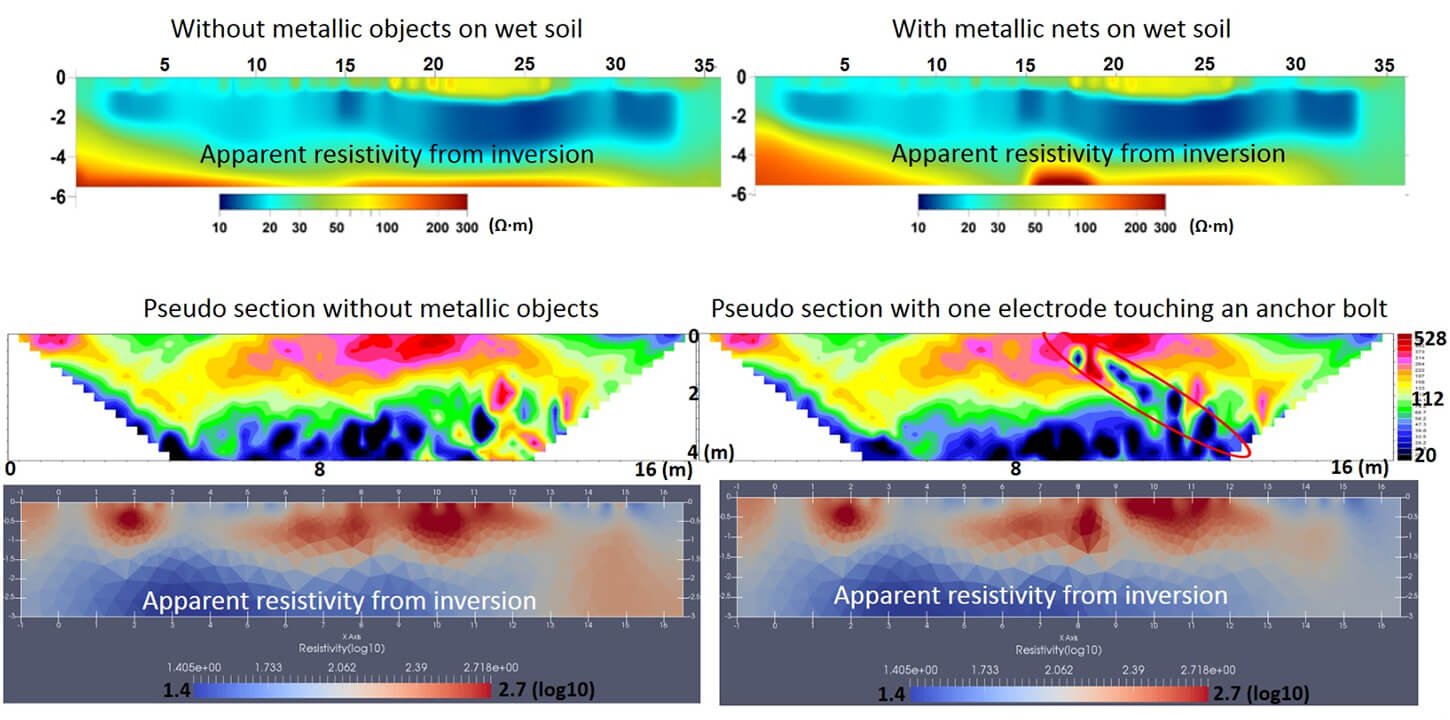
Regarding the DC electric field for the resistivity measurement, from the field observation and modeling results (Foudil-Bey and Cheng, 2019), it seems that the metallic objects’ effects are negligible, as long as the measuring electrodes do not touch them directly. In a series of field tests, two metal nets were laid on the ground or against walls, and anchor bolts were planted in the ground up to 10 cm to 20 cm deep. We found that the contact and soil type between the metal objects and the ground both played an important role. Wet soil can slightly disturb the resistivity distribution (top of Fig.1). Inversion was performed using the Res3Dinv inversion code (Loke, 2014) for this test. The second test was carried out on a volcanic rock outcrop. The results show that if the anchor bolt was used as a measuring electrode, the disturbance was clearly visible in the resistivity distribution (middle and bottom panels on Fig.1). The 3D inversion was done using the BERT (Boundless Electrical Resistivity Tomography) code of Thomas Gunther & Carsten Rucker (2019). The advantage of BERT is that the inversion can incorporate a structural geological model, therefore, is more representative of the geology. The topography variation is also considered.
Identification of noise in an active and deep mine
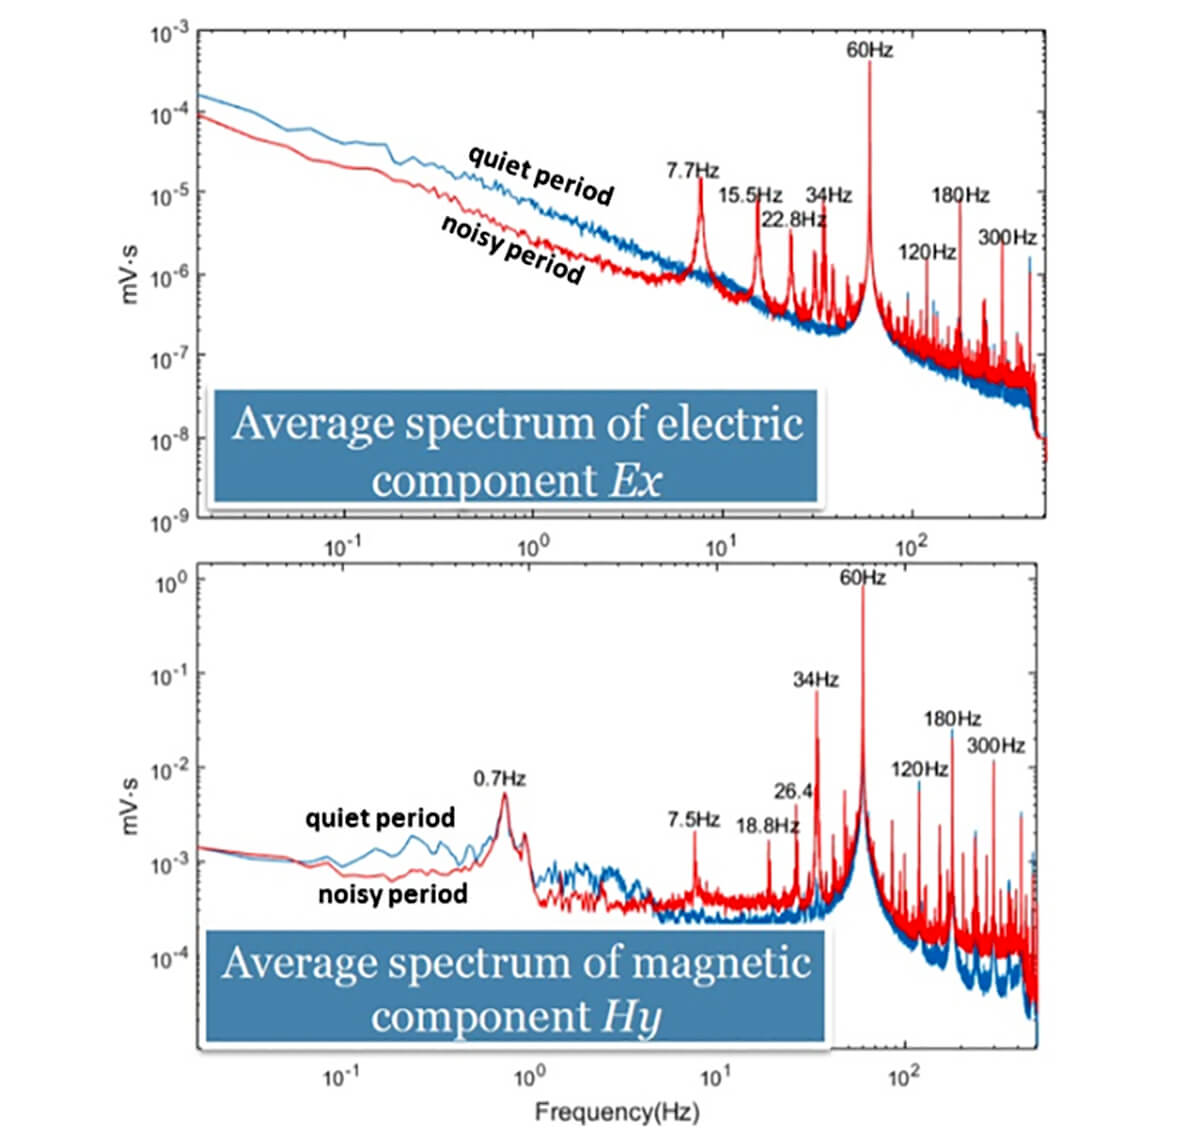
The electromagnetic signal of economic ore bodies is often very weak compared to signal from the conductive host rock and from EM noise from human activity. In addition, noise sources for EM measurements in a deep mine are typically poorly known and not easily determined. We recorded electromagnetic signals in mine tunnels at 3 km depth (Fig. 2) using five ZenTM High-Res EM receivers (Zonge International, Tucson, AZ) for 22 hours, placed at selected locations (Table 1). The receivers are broadband, multi-channel and multi-function digital receivers. The frequency range is DC – 1024 Hz. According to the analysis in the time and frequency domains, apart from the very high frequencies produced from communication cables that were not recorded, low frequency signals and 60 Hz harmonics were the major sources of noise for the underground electromagnetic measurements. The average spectrum was computed based on 60 segments of one-minute length data, randomly selected from both quiet and noisy periods. The source of those low frequencies could be: 1) Schumann resonances (7.83 Hz), likely signals from machine activity; 2) signals resulting from the coupling between machine vibration and electromagnetic fields, but decreasing rapidly with distance; and 3) signals generated by 60 Hz power lines, and related harmonics.

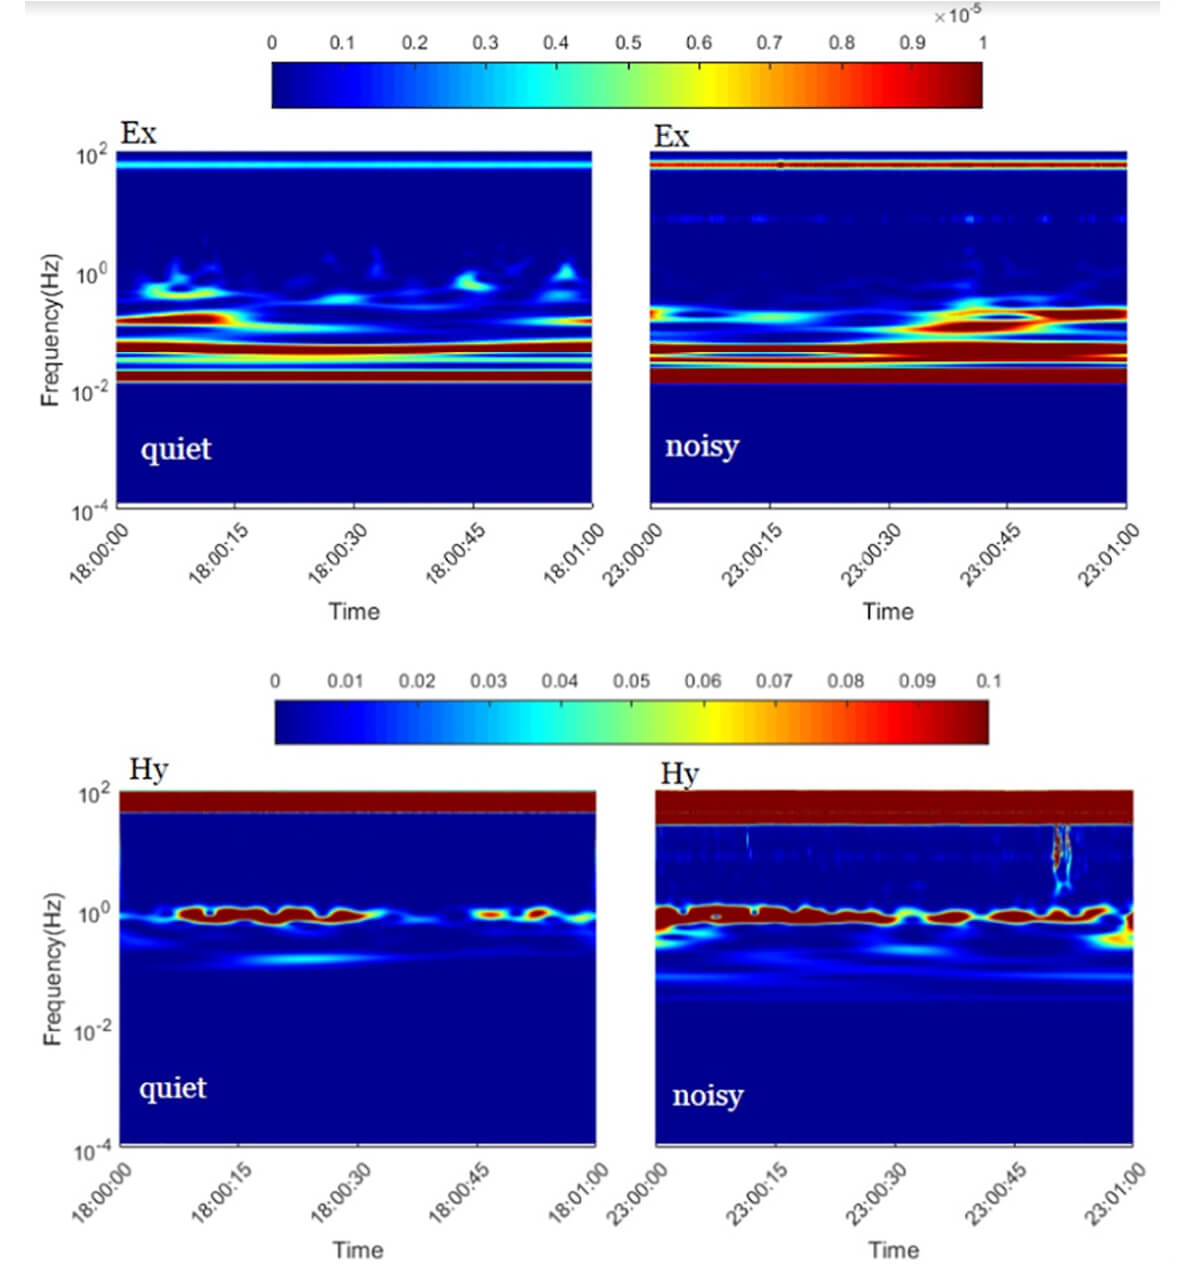
The time-frequency analysis, based on the continuous wavelet transform, indicated when the signal with a specific frequency happened (Fig. 3). Due to the limited power of our computer and time constraints, only one-minute length data was chosen from both quiet and noisy periods. The quiet period (from 18:00:00 to 18:01:00) and the noisy period (from 23:00:00 to 23:01:00) were determined by variations in the amount of current drawn from the mine’s power supply, also confirmed by the mine conveyor’s work schedule. When the conveyor was not working (quiet period), there were events that were discontinuous in time in addition to the 60 Hz event. This may have been because of the passing vehicles and other equipment used to load and unload the mined rock. When the conveyor was working (noisy period), additional features of the signal in time-frequency representation arose. For example, in Figures 3b and 3d an event of 50 Hz is present, that does not exist in Figure 3a and 3c.
Denoising
Motion-induced noise, due to wind, the rotation of coils in the air, and lightning storms (sferics) are common noise sources for airborne electromagnetic surveys. Human activities and infrastructures also impact ground electromagnetic measurements. Some of this noise may be filtered through rocks at depth, while others add to the noise list for underground electromagnetic measurements. Based on the transient nature of an electromagnetic field, a new strategy of denoising was developed at UQAT with Abitibi Géophysique for borehole electromagnetic raw data processing (Dai et al., 2019). Indeed, the methodology is applicable to all kinds of electromagnetic raw data.
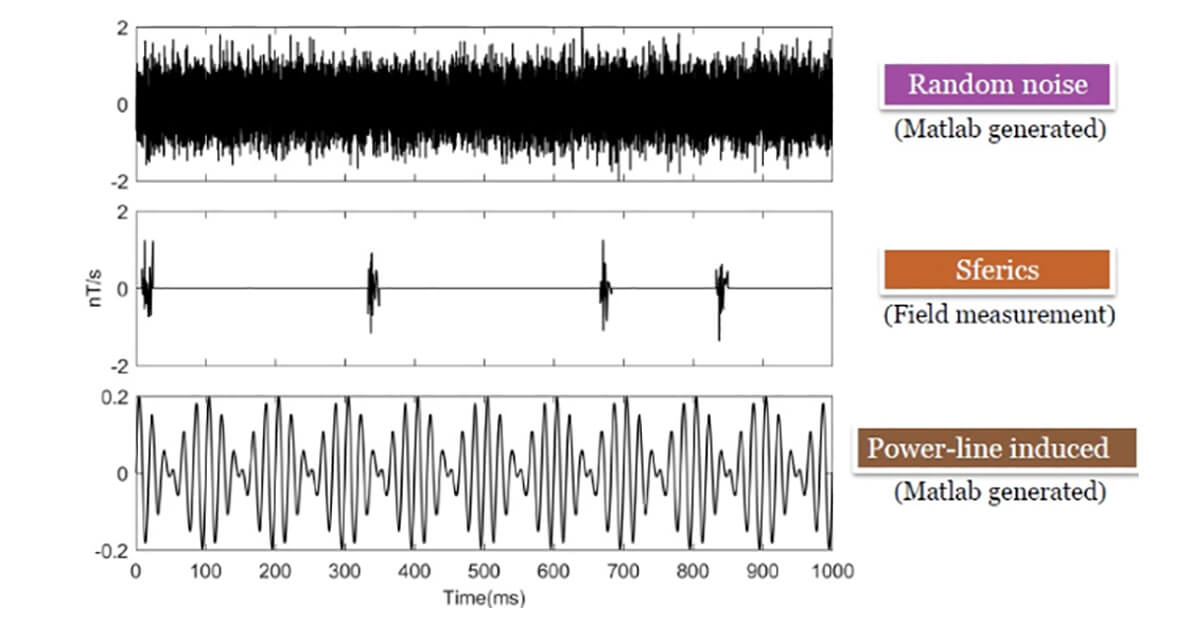
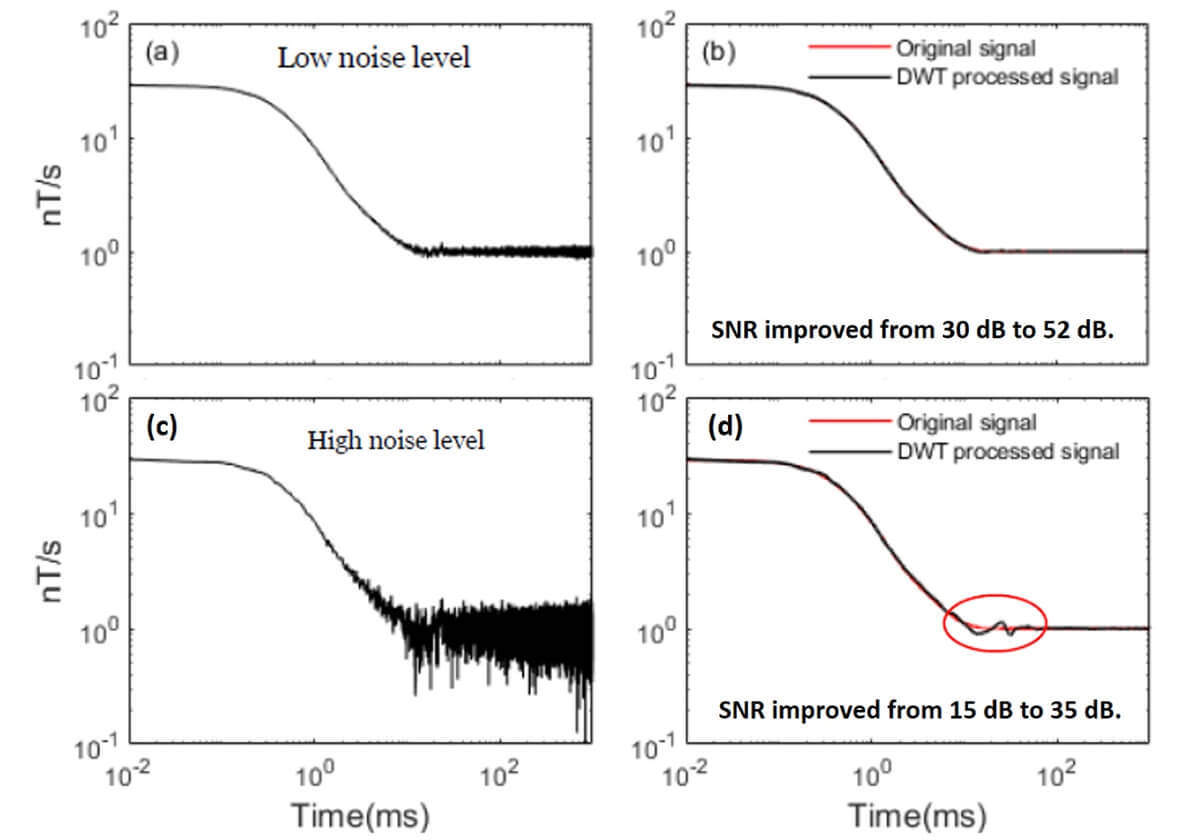
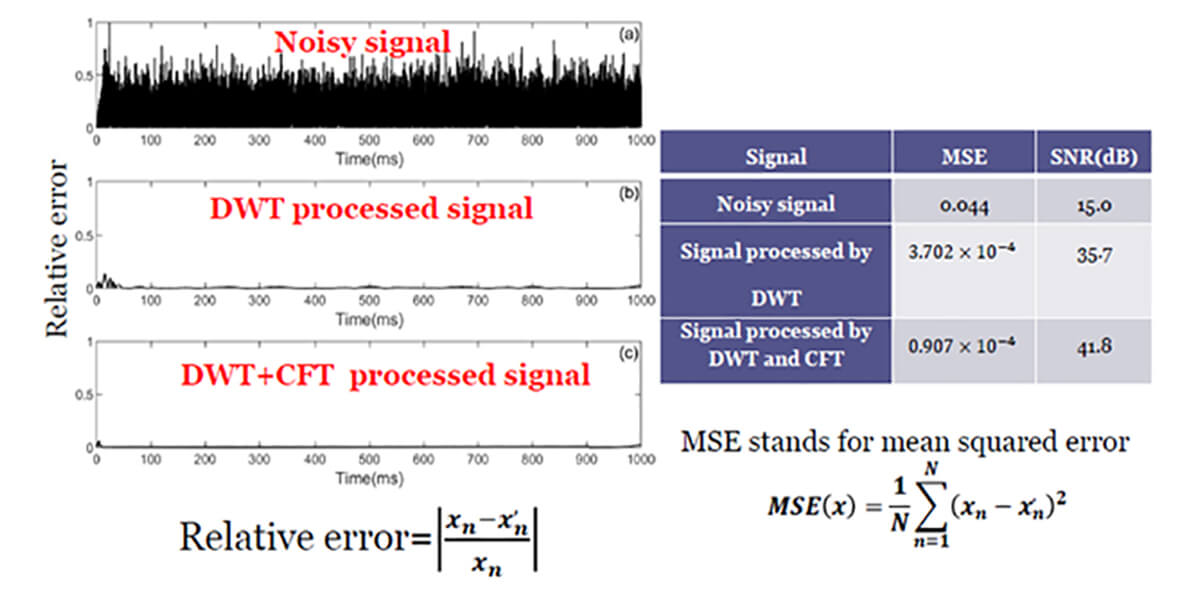
Three types of noise were first added into a time series signal (Fig.4). Then, the discrete wavelet transform (DWT) was applied to filter the raw data (Fig.5). The filtering results show that the efficiency of the DWT depends upon the noise level. For heavily noise-contaminated signals, some residual perturbation still remained in the processed raw data (Fig.5b). Since the measurement was repeated many times at each survey point in a borehole electromagnetic survey for reducing random noise, and since the structural geology does not change during the recording, the correlation analysis helped separate the geological signal from random noise. Therefore, non-correlated signals repeated at the same measurement point indicated the noise position in the time series. Finally, a curve fitting (CFT) method was applied to all repeated measurements at the same point to remove the residual noise (Fig.6).
The LaRonde Penna mine underground electromagnetic survey
The LaRonde Penna deposit consists of massive and semi-massive, gold-rich base metal sulphide lenses. The deposit also includes zones of sulphide veins and disseminations. The ore lenses can contain a very low percentage of sulphides up to 100% sulphides. Pyrite (iron sulphide) is the dominant sulphide, although sphalerite (zinc-iron sulphide) is locally abundant. Chalcopyrite (copper-iron sulphide) is common. Pyrrhotite (iron sulphide) is also present locally, as well as galena (lead sulphide). Gold is generally associated with the pyrite and chalcopyrite, and a suite of trace metallic metals such as tellurides. This type of deposit is known as a gold-rich volcanogenic massive sulphide (VMS). Many similar deposits exist in Quebec, Ontario, Manitoba, New Brunswick, Newfoundland-and-Labrador, British Columbia, and elsewhere in the world (Galley et al., 2007). The deposit is located in an area strongly modified by tectonism 2.7 billion years ago. These tectonic events caused the host succession to tilt towards the south, with subsequent major flattening due to north-south compression. As a result, the various polymetallic massive sulphide lenses that define the deposit are generally quasi-vertical, dipping very steeply towards the south and oriented east-west (Mercier-Langevin et al., 2007). The tilting and flattening of the ore lenses explain the relatively large vertical extent of the ore zones, from near-surface to more than 3000 m below surface. The recognized mineral potential surrounding the LaRonde mine also explains the interest in developing innovative methods to explore, at lower cost, the area around and beneath known deposits.
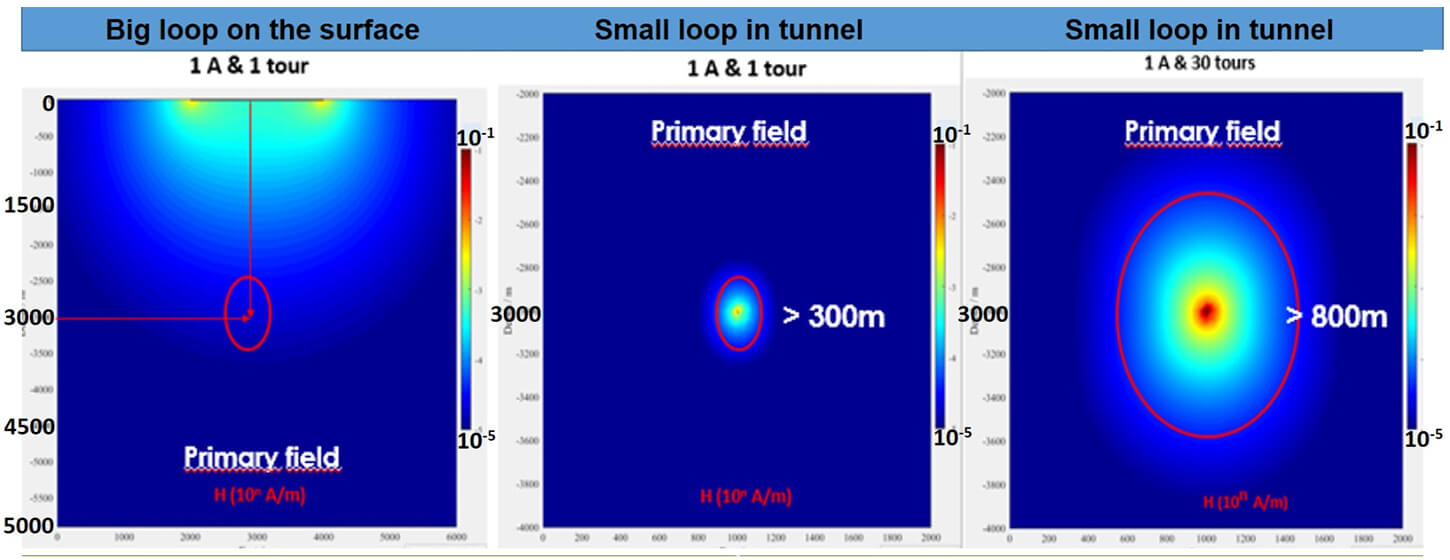
A series of 3D modeling experiments showed the effectiveness of underground measurements in comparison with measurements on the surface. Figure 7 demonstrates that the intensity of the electromagnetic field at 3 km below surface generated by a small transmitter loop (5 m x 300 m), is stronger than that of a large loop (2 km x 2 km) on the surface. For a given current (1 Ampere), increasing the number of turns of the transmitter loop amplifies the electromagnetic field (Fig.7).
A deep geophysical survey in a tunnel located at 3 km below surface was conducted in the LaRonde Penna mine from June 10 to 14, 2019. Figure 8 shows the site selected for the experiment. Two boreholes were selected: LR-290-093 and LR-290-097 (Fig.9a). Both passed between Zone 6 (north) and Zone 19/20 zone (south). The underground survey began with a "dummy probe", which was an inexpensive piece of pipe with a size similar to the geophysical probe. The primary purpose of using this probe was to make sure the hole was free of debris. (If it became blocked or damaged, the losses would be minor.) In mineral exploration, the drilling of long holes often starts with a larger diameter drill pipe, for example "NQ-sized" drilling (75.7 mm in diameter); this allows drilling to continue by inserting smaller diameter drill pipe (e.g. "BQ-sized" (60.0 mm in diameter) in the event that the initial drillstem gets stuck in a fault or poor quality rock. This was the case with drill hole LR-290-093. The geophysical probe was too large to pass through the transition between NQ-sized and BQ-sized sections, therefore, the measurements were stopped at 390 m along drill hole LR-290-093. However, measurements were successful in drill hole LR-290-097 down to 770 m from collar (Fig.9b).
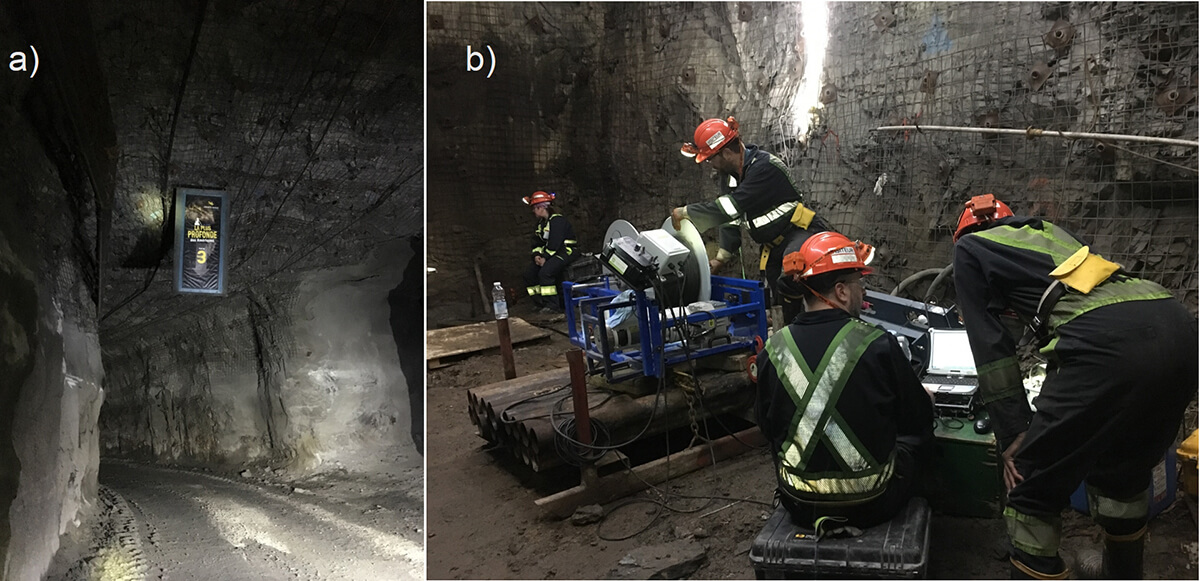
b) Field team is recording the electromagnetic signals in the borehole from tunnels.
A 6-turn loop (6 m wide by 260 m long) was installed with a real resistance of 12.1 Ohm.m along the gallery. This configuration was favourable for the coupling between the primary electromagnetic field and the horizontal conductors either above or below the gallery. According to the results, the response of known mineralized zones (zone 6 and zone 19/20) was visible (Fig.9b). The signal of zone 19/20 at a depth of 700 - 780 m along drill hole LR-290-097, which is equivalent to a depth of 3.7 km to 3.78 km below surface, confirmed the advantage of underground measurement for deep exploration. This zone would have probably been impossible to detect in a ground survey, due to the reduction of field strength with increasing distance from transmitter.
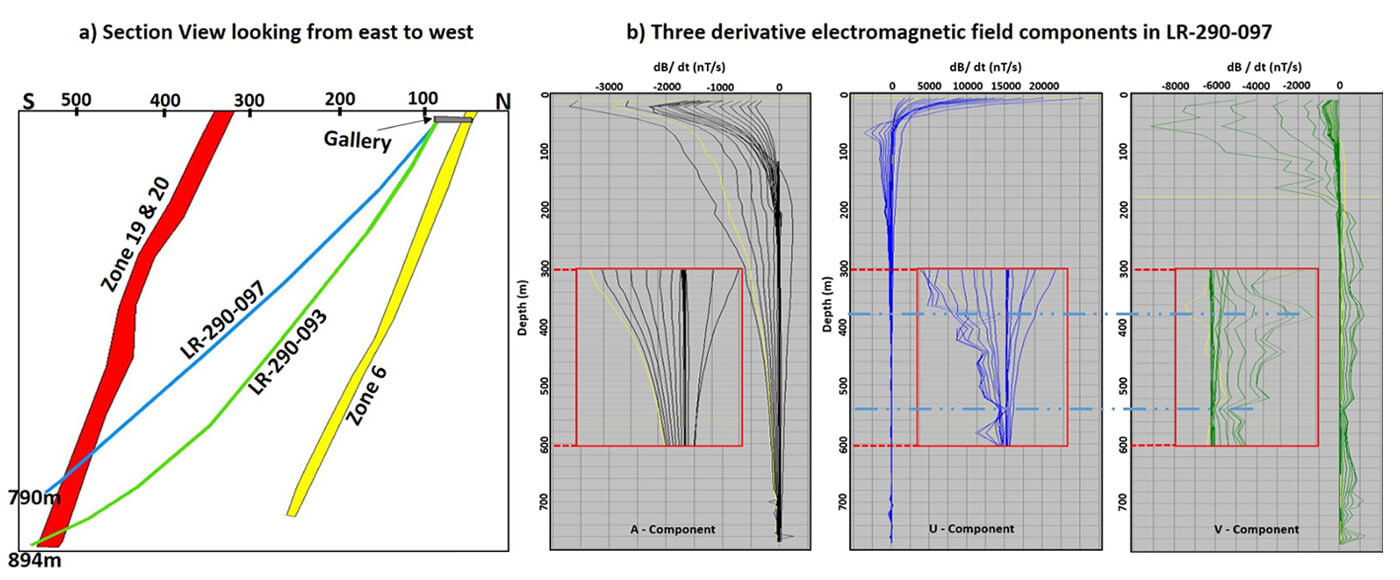
Some new electromagnetic anomalies were also detected in this survey (depth 380 m and 540 m along drill hole LR-290-097). The lack of response in the axial component informs us that these anomalies were probably not intercepted by drilling (i.e., off-hole bodies). 3D modeling of conductors with the same orientation and dip as the known mineralized lenses did not explain the observed anomalies, leading to the conclusion that the anomalies are generated by other off-hole sources. Advanced modeling is underway to determine the position of these new sources in relation to drilling.
Discussion and Conclusion
Borehole geophysics can detect targets that lie beyond the existing mine walls and also past current drilling depths. By gaining access underground and combining information from geophysical measurements obtained at the surface, in boreholes and in underground galleries, the space of investigation is increased in all three dimensions. The experiments described in this geophysical study are unique. Key lessons include the following:
- Numerical modeling and surface field tests are necessary to prove the feasibility and design of the geophysical measurement scenarios before conducting underground surveys. However, we must be aware that theory does not always represent reality. As the example in Figure 7 shows, the required number of turns of transmitter wires was 30, which is far greater than the amount of materials that can be transported underground; also, the amount of work required has to be efficient for the installation of the measurement system in terms of time.
- Compact (small) and easily transportable (light) systems are necessary for efficient geophysical exploration deep underground. Easy to build, differently shaped and orientated transmission loops will also greatly improve the feasibility of underground-based surveys.
- A new atomic low-power clock would be superior to the crystals and GPS currently being used for synchronization between the transmitter and the receiver. An easily controlled winch, to move the sensor down and up the hole more efficiently, would really help to reduce survey time and therefore have less impact on the normal mine operations.

Acknowledgements
This work was funded by the Fond de Recherche Nature et Technologies du Québec (FRQNT), and industry partners Abitibi Géophysique and the LaRonde Division of Agnico Eagle Mines Ltd. We sincerely thank all the personnel in the geological, geotechnical and service groups of the LaRonde Penna mine, and the Abitibi Géophysique field team. Thanks to J. Legault for the invitation to prepare this contribution and for his and his editors’ (Oliver Kuhn and Ruth Peach) review of earlier versions.
Related Reading


Join the Conversation
Interested in starting, or contributing to a conversation about an article or issue of the RECORDER? Join our CSEG LinkedIn Group.
Share This Article