Summary
The discrimination of fluid content and lithology in a reservoir is an important characterization that has a bearing on reservoir development and its management. For the unconventional reservoirs, such as shale gas formations, besides other favorable considerations that are expected of them, it is vital that reservoir zones are brittle. Brittle zones frac better and fracing of shale gas reservoirs is required for their production. Amongst the different physical parameters that characterize the rocks, Young’s modulus (Ε) is a measure of their brittleness. Attempts are usually made to determine this physical constant from well log data, but such measurements are localized over a small area. For studying lateral variation of brittleness in an area, 3D seismic data needs to be used. Computation of Young’s modulus from seismic data requires the availability of density (ρ). The computation of density in turn requires long offset data, which is usually not available. In this study, we propose a new attribute (Ε ρ) in the form of a product of Young’s modulus and density. For a brittle rock, both Young’s modulus and density are expected to be high, and so the Ε ρ attribute would exhibit a high value and serve as a brittleness indicator. As well, we demonstrate the usefulness of this new attribute for lithofluid detection, when it is used in conjunction with the product of bulk modulus and density.
Introduction
The determination of lithology and fluid content distribution in a reservoir is a desirable objective for its characterization and subsequent management. Physical properties such as porosity and permeability make it possible to evaluate a hydrocarbon reservoir. However, the properties that have a direct impact on the relevant elastic constants are bulk modulus, shear modulus, and Young’s modulus, amongst others. Bulk modulus (κ) is a measure of a material’s resistance to change in volume and is known as incompressibility. It is treated as a porosity indicator. Shear modulus (μ) is measure of rigidity of a rock or resistance to deformation taken in a shear direction and is treated as a lithology indicator. Further, Young’s modulus (Ε), also known as stiffness modulus is a measure of the stiffness of the material of the rock. Historically, on the basis of these physical properties, geoscientists have attempted to delineate the fluid and lithology content of a reservoir. An estimation of the physical properties described above requires P- impedance (Ip), S-impedance (Is) and density. For computing these prerequisites, prestack inversion of surface seismic data is usually performed. Although, extraction of density from seismic data needs far-offset information, it is also true that the quality and amplitude fidelity deteriorate significantly at large angles of incidence. So, the computation of density is considered an arduous task.
In the absence of density, efforts have been made for characterization of a reservoir in terms of lithology and fluid content. For this purpose, Ip and Is are used for litho-fluid discrimination as Ip is sensitive to fluid, whereas Is is not. Goodway et al (1997) proposed the determination of rock physics parameters such as Lame’s constants (λ and μ) from Ip and Is and demonstrated that as λ (sensitive to pore fluid) and μ (sensitive to the rigidity of the rock matrix) may be difficult to isolate from seismic data, λρ and μρ, where ρ is density, can be easily determined from Ip and Is. Besides, these attributes show better discrimination of lithology and fluids in the λρ – μρ crossplot space. Russell et al (2003) proposed the use of the more generalized fluid term (ρf), instead of just the λρ attribute. Likewise, Katahara (2001) investigated the application of κρ attribute using well data, for enhancing the detection of fluid. More recently, Dabagh et al (2011) have shown a comparison of κρ and λρ, and that κρ comes out as a superior attribute for fluid detection.
The stiffness of a rock is an important property, especially important for shale gas reservoirs where fracing is employed for stimulation. Stiffer shales frac much better than ductile ones and enhance the permeability of those zones. Young’s modulus can characterize such stiffer pockets in shales and accordingly Santoso et al (1995) and Banik et al (2010) demonstrated the determination of Young’s modulus from seismic data by way of inversion. One limitation of Santoso et al (1995) approach is the requirement of density which as stated above is difficult to derive from seismic data, unless long offset information is available. Banik et al (2010) alleviate the requirement for density by using the correlation of Is or Ip and Young’s modulus from log data, and using that relationship for computation of Young’s modulus.
Considering the importance of a lithology indicator as well as an attribute that could yield information on the brittleness of a reservoir, we propose a new attribute, Ερ, which is the product of Young’s modulus and density. While Ερ accentuates lithology detection in terms of brittleness, κρ, intensifies fluid detection. Ερ facilitates a new domain, wherein fluidlithology discrimination can be achieved in a significant way.
Methodology
Young’s modulus (Ε) is the measure of stiffness of a rock and can be defined in terms of bulk modulus (κ) as
Ε = 3κ (1 − 2σ)
where σ is the Poisson’s ratio and can be written in terms of P-wave velocity and S-wave velocity as follows:

Substitution of this equation into the first one yields

If we multiply both sides of the above equation by density and use the relationships Ip = ρvp and Is = ρvs , the above equation can be written as

Thus, once we compute Ip and Is using seismic inversion this attribute can be derived directly. Further, above equation can be written as
Ερ = μρ * α
where

If α turns out to be a positive number then it can be concluded that Ερ is a scaled version of μρ and would enhance lithological information. To this end we consider the following two cases.
Case 1: Brine sand
For brine sand, it is known that

Using this it can be shown that

Case 2: Gas sand
For the gas sand case, typically,

and so in this case Ερ can be computed as

We thus conclude from these two cases that whether hydrocarbon is present in a formation or not, Ερ is a scaled version of μρ, and so intensifies lithologic information. For a brittle rock, Young’s modulus would be high and density would be high too, therefore the product of Young’s modulus and density would be high as well and would accentuate the brittleness of the rock.
Examples
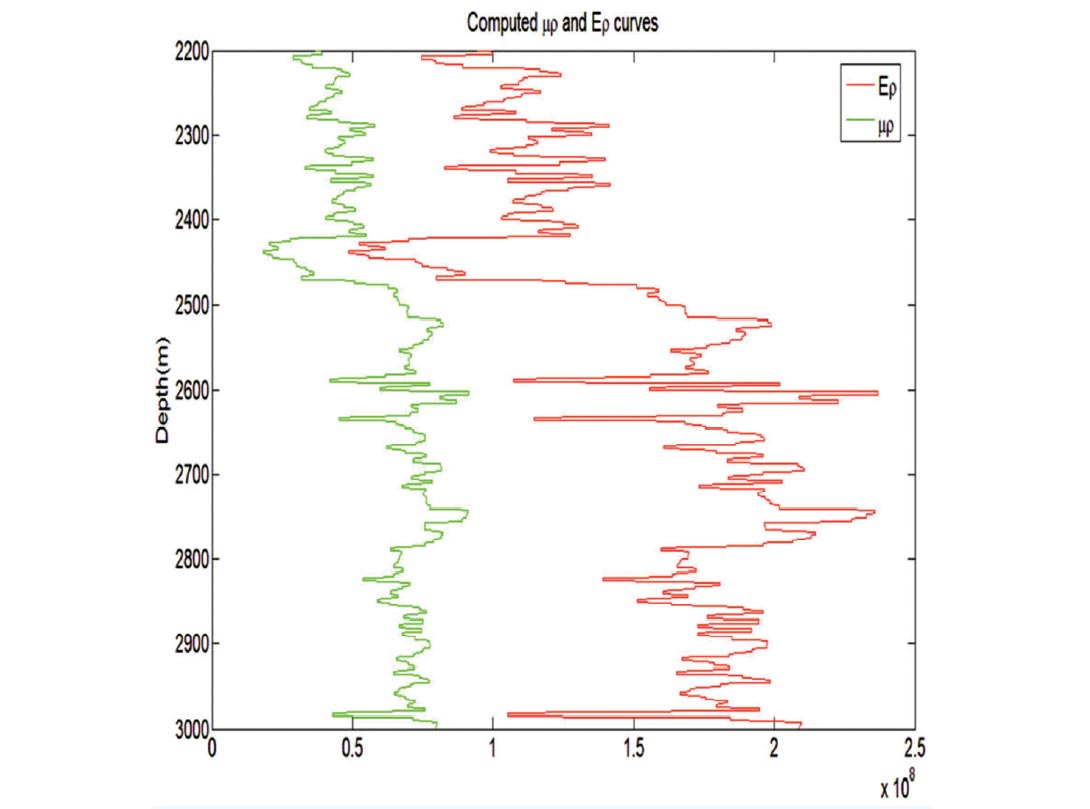
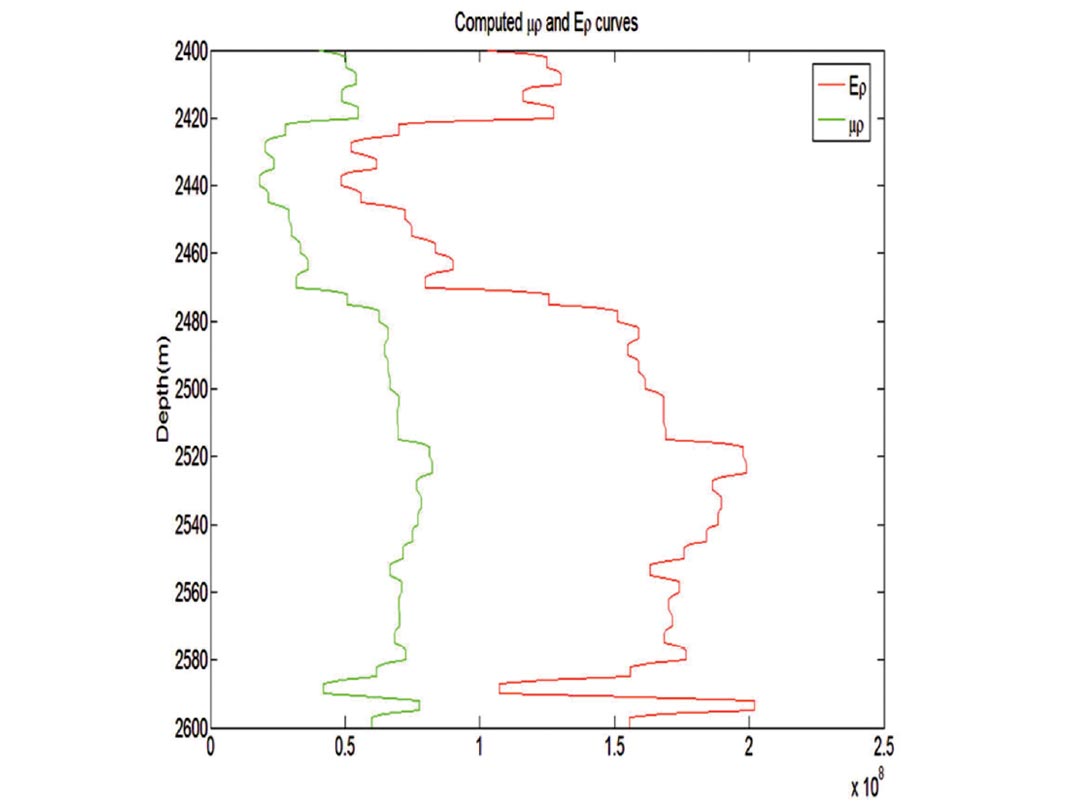
We have discussed above the advantage of Ερ for fluid-lithology detection and also its implication for fracing brittle formations. We now demonstrate the computation of Ερ from well log and seismic data, and show its practical importance. In Figure 1, we show a comparison of the μρ and Ερ curves for a well in northern Alberta. Notice, the Ερ curve emphasizes the variation corresponding to lithology change more than in the Ερ curve. For ease in interpretation, we segment the input log curves and the results shown in Figure 2 stand out nice and clear.
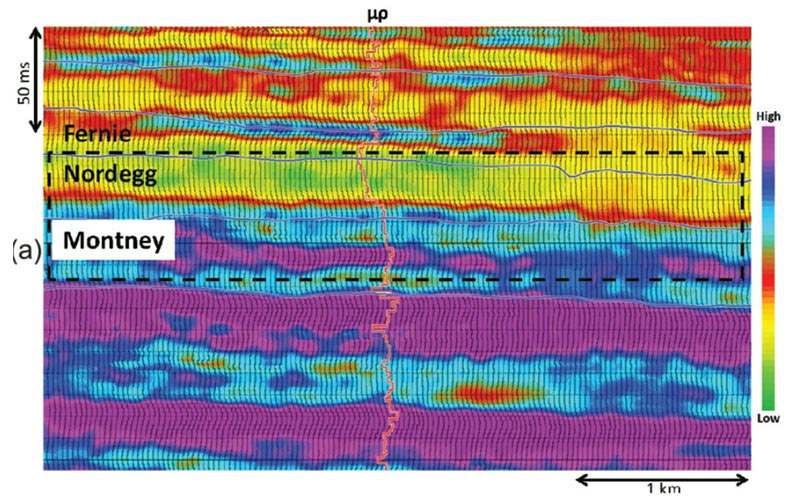
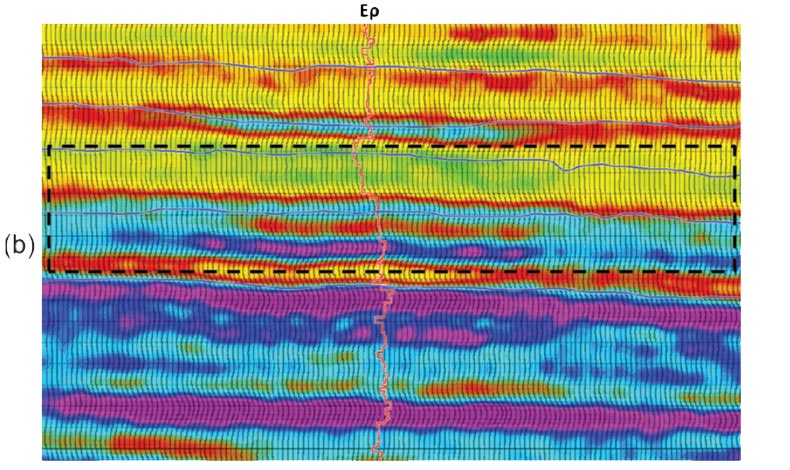
For implementation of this analysis on seismic data, we considered a gas-impregnated Nordegg member of the Jurassic Fernie formation of the Western Canadian Sedimentary Basin. The Nordegg member of the Fernie formation varies throughout the WCSB. It consists of predominantly brownish, greyish and black shale’s. These “shale’s” vary from siliceous rich cherts and dolomites to carbonate rich shale. Due to the complex geology of the reservoir in the Nordegg, differentiating the lithology and fluid content is a challenge. The Nordegg – Montney interface is a regional unconformity which seperates the Jurassic and Triassic strata in the area. The Montney formation is composed of fine grained siltstone grading to fine grained sandstones, with limited shale content. There is a diagenetic dolomitic overprinting on the siltstones and sandstones. In local areas of the Montney there is a coquina facies made up of bivalves.
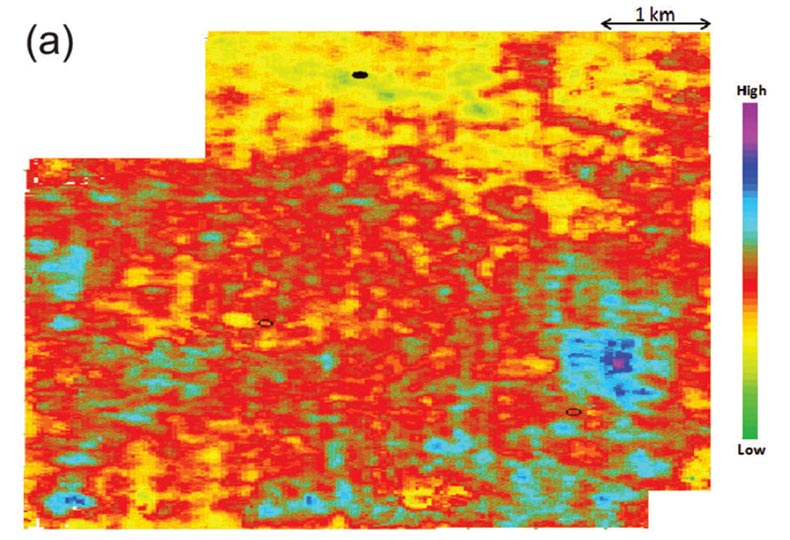
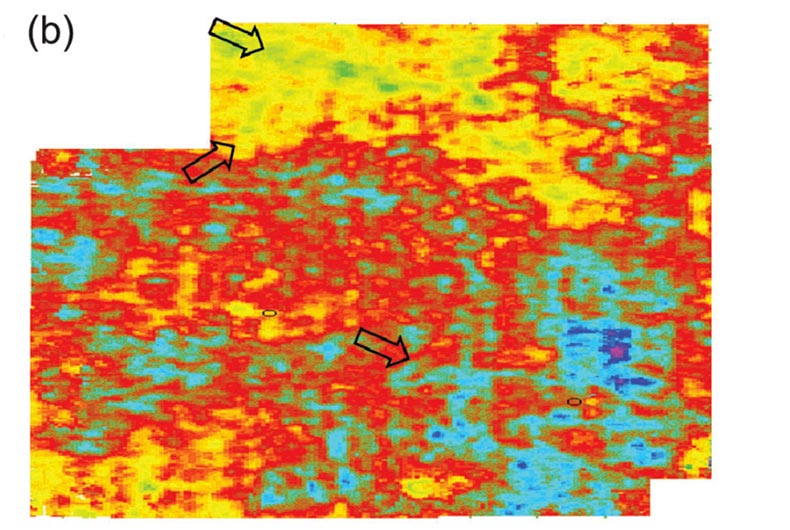
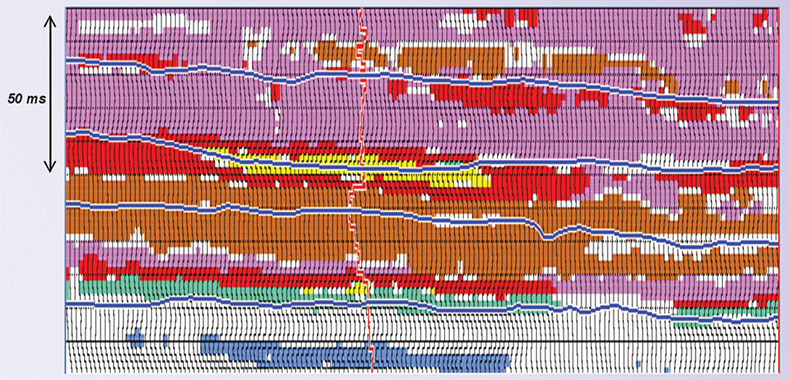
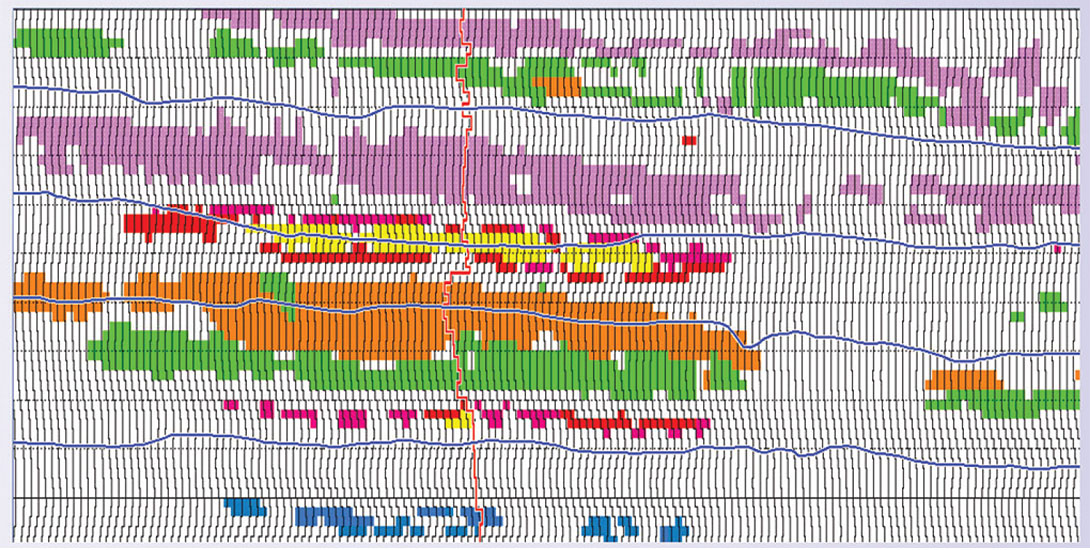
Thus, as the first step, simultaneous impedance inversion was run on the pre-conditioned 3D seismic data to obtain P-impedance and S-impedance volumes. Next, these impedance volumes were transformed into μρ and Ερ volumes as discussed above. In Figures 3 a and b, we show segments of vertical sections from the μρ and Ερ volumes respectively. Apparently, we notice Ερ has a higher level of detail than the μρ attribute. The upper parts of the figures exhibit lower values of the attributes as they correspond to the sandstone presence, whereas the higher values are seen in the lower part, verifying the availability of dolomitic siltstone in this zone. The time slices of μρ and Ερ attributes taken for the Monteny formation are illustrated in Figures 4a and b, respectively, the arrows indicating the points where very noticeable information on lithology is clearly seen on the section.
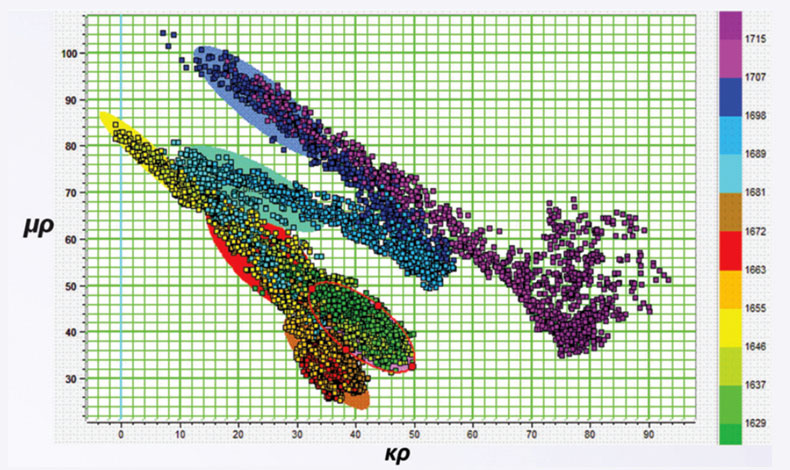
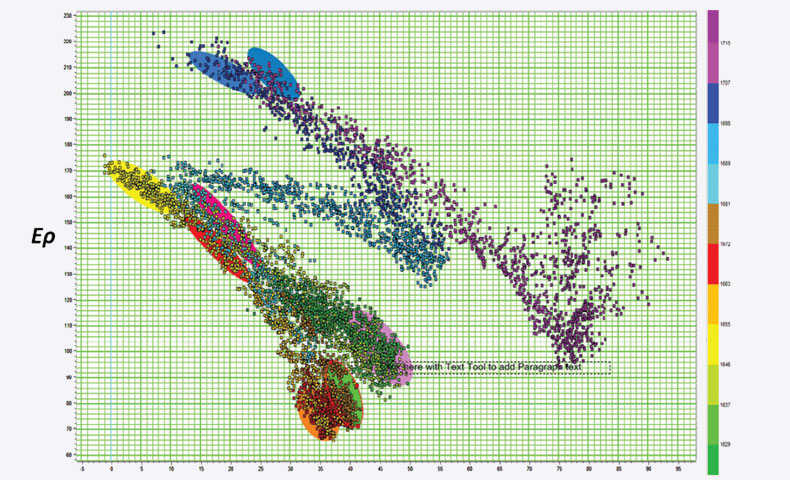
Figures 3 and 4 have illustrated the application of Ερ attribute as lithology indicator. Next, we illustrate the application of Ερ attribute as a significant litho-fluid discriminator. In Figure 5 we illustrate the crossplots of κρ – μρ and κρ – Ερ.
We notice the main trends for the different clusters (in the κρ – μρ and κρ – Ερ domains), are more or less the same, however, the separation of the different clusters is much more in the κρ – Ερ crossplot space than in the κρ – μρ space. We back project the different clusters onto the seismic sections in Figure 6 and notice that κρ – Ερ reveals more accurate lithologic information. Upper and lower parts of Nordegg formation are seen holding distinctive characteristic in κρ – Ερ domain while they are indistinguishable in κρ – μρ domain. Similar distinct can be seen for Fernie and Monteny formations.
Conclusions
We have proposed a new attribute (Ερ) in the form of a product of Young’s modulus and density, which is a good lithology indicator. We describe it as a scaled version of the μρ attribute and illustrate that it intensifies the variation in lithology. This attribute can be derived seismically and have shown that we can determine the brittleness of a formation with it. Clusters in κρ – Ερ crossplot space corresponding to the litho-fluids are seen to be discriminated better than between similar clusters in the κρ – μρ space.

Acknowledgements
We thank Athabasca Oil Corporation for giving us the necessary permission for presentation of the results shown in this study. We also thank Arcis Seismic Solutions for permission to present this work.
Related Reading


Join the Conversation
Interested in starting, or contributing to a conversation about an article or issue of the RECORDER? Join our CSEG LinkedIn Group.
Share This Article