Summary
Seismic attributes are a powerful aid to seismic interpretation. They allow the geoscientist to interpret faults and channels, recognize the depositional environment, and unravel the structural deformation history more rapidly. By combining information from adjacent seismic samples and traces using a physical model (such as dip and azimuth, waveform similarity, or frequency content), seismic attributes often organize features into displays that provide enhanced images for either a human interpreter or for modern geostatistical or neural-network computer analysis. While attributes are sensitive to lateral changes in geology, they are also sensitive to lateral changes in noise. Seismic data are usually contaminated by both random and coherent noise, even when the data have been migrated reasonably well and are multiple free. Certain types of noise can be addressed by the interpreter through careful structure-oriented filtering or poststack footprint suppression. While seismic attributes are particularly effective at extracting subtle features from relatively noise-free data, if the data are contaminated with multiples or are poorly focused and imaged due to poor statics or inaccurate velocities, the data may need to go back to the processing team to alleviate those problems.
Another common problem with seismic data is their relatively low bandwidth. Significant efforts are made during processing to enhance the frequency content of the data as much as possible to provide a spectral response that is consistent with the acquisition parameters. Since they are often unfamiliar with the targets of interest, the processors can be either too aggressive or too conservative in their filtering. In contrast, the interpreters will have a better understanding of the geology, the play concept, access to any well data, and therefore be better able to keep or reject alternative filter products that are consistent or inconsistent with the interpretation hypothesis. In this talk I discuss alternative means of suppressing random noise on our migrated seismic images, and then address acquisition footprint, which may appear to be random in the temporal domain but is highly correlated to the acquisition geometry in the spatial domain. After passing the data through the cleaning phase, I evaluate alternative methods for frequency enhancement of the input seismic data. Next I illustrate the impact of attributes such as coherence and curvature on data volumes from Alberta, Canada. I conclude with a summary of frequency-enhancement methods based on these and other case study examples.
Introduction – Alternative noise-suppression workflows
Suppression of random noise: Mean, alpha-trimmed mean, and median filters are commonly used during processing to suppress random noise. A more desirable application would be a dipsteered mean or median filter, which has the effect of enhancing laterally continuous events by reducing randomly distributed noise without suppressing details in the reflection events consistent with the structure. The filter picks up samples within the chosen aperture along the local dip and azimuth and replaces the amplitude of the central sample position with the median value of the amplitudes. The median filter can also be applied iteratively, reducing random noise at each successive iteration, but will not significantly increase the high frequency geological component of the surface (Chopra and Marfurt, 2008). Dipsteered mean filters work well on prestack data in which discontinuities appear as smooth diffractions, but will smear faults and stratigraphic edges on migrated data. Dip-steered median and alpha-trimmed mean filters work somewhat better but will still smear faults. Hoecker and Fehmers (2002) address this problem through an “anisotropic diffusion” smoothing algorithm. The anisotropic part is so named because the smoothing takes place parallel to the reflector, while no smoothing takes place perpendicular to the reflector. The diffusion part of the name implies that the filter is applied iteratively, much as an interpreter would apply iterative smoothing to a time structure map. Most important, no smoothing takes place if a discontinuity is detected, thereby preserving the appearance of major faults and stratigraphic edges. Luo et al. (2002) proposed a competing method that uses a multiwindow (Kuwahara) filter to address the same problem. Both approaches use a mean or median filter applied to data values that fall within a spatial analysis window with a thickness of one sample. Marfurt (2006) describes a multiwindow (Kuwahara) principal component filter that uses a small volume of data samples to compute the waveform that best represents the seismic data in the spatial analysis window. Seismic processors may be more familiar with the principal component filter as equivalent to the Kohonen-Loeve (or simply KL) filter commonly used to model and remove multiples on NMO-corrected gathers using the multiple velocity. Examples of the application of structure-oriented filtering on seismic data have been shown in Chopra and Marfurt, (2007, 2008), wherein improved event focusing and reduced background noise levels after structure-oriented filtering are clearly evident.
Suppression of acquisition footprint: Acquisition footprint is defined as any amplitude or phase anomaly closely correlated to the surface acquisition geometry rather than to the subsurface geology. Spatially periodic changes in total fold, azimuths, and offsets give rise to spatial periodicity in enhancement of seismic signal and rejection of seismic noise. Attributes exacerbate these periodic changes, giving rise to artifacts. Gulunay (2006) and others have shown that kx-ky filters can be very effective in reducing acquisition footprint on time slices for regularly sampled surveys, since a footprint due to fold, offset, and azimuth tends to be organized vertically, while that due to aliased migration artifacts is steeply dipping, in a kx-ky-ω or 3D running-window. Radon filters may provide some additional artifact suppression leverage. For more irregular acquisition design, the noise estimated using kx-ky or kxky- ω filters can be followed by an adaptive filter.
Enhancing the frequency bandwidth of seismic data
There are a number of methods that are used during processing to enhance the frequency content of the input seismic data. Here we mention a few commonly used processes followed by some relatively newer ones that help the interpreter to extract meaningful information from the seismic data.
Deconvolution: Different conventional procedures are adopted to compensate for frequency attenuation. A common practice has been to use a two- or three-window statistical deconvolution to correct for the dynamic loss of high frequencies. This involves choosing two or three time windows for the deconvolution, each with its own parameters, keeping the time-variant nature of the embedded source wavelet in mind. These windows are usually designed to overlap in order to avoid artifacts. However, there are problems with this approach: the filters must be derived from smaller windows, which are less likely to meet the statistical assumptions, and these windowed zones often exhibit phase distortions at the point of overlap.
Time-variant spectral whitening: The other method is to use timevariant spectral whitening (TVSW). This method involves passing the input data through a number of narrow band-pass filters and determining the decay rates for each frequency band. The inverse of these decay functions for each frequency band is applied and the results are summed. In this way, the amplitude spectrum for the output data is whitened in a time-variant way. The number of filter bands, the width of each band and the overall bandwidth of application are the different parameters that are used and adjusted for an optimized result (Yilmaz 2001). In this method, the high-frequency noise is usually amplified and so a band-pass filter must be applied to the resulting data. Since it is a trace-by-trace process, TVSW is not appropriate for AVO applications.
Inverse Q-filtering: If we had an analytic form for an attenuation function, it would then be easy to compensate for its effects. Thus, in practice, attempts are first made to estimate a Q-model for the subsurface. Inverse Q-filtering is then carried out, removing the time-variant wavelet effects of absorption and broadening the effective seismic bandwidth by correcting the loss of high-frequency signal as well as compensating for dispersion effects that rotate each spectral component by a different amount. These attempts have met with a varying degree of success, depending on the assumptions used in the particular approach and how well they are met in practice.
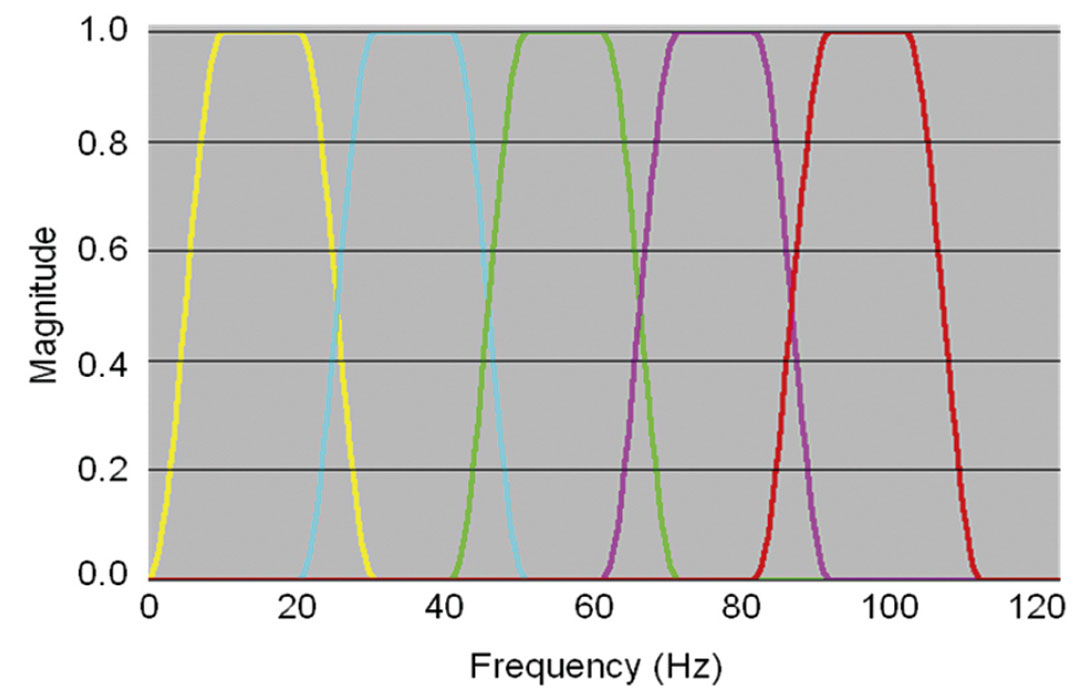
Frequency split structurally oriented filtering: Helmore (2009) introduced frequency split structurally oriented filtering (Figure 1) wherein the input seismic data is divided into a number of frequency bands, followed by running structurally oriented filters separately to each of the bands and then recombining the results. This procedure reduces noise in selected frequency bands and results in higher signal-to-noise ratio as well as enhanced resolution. Structurally oriented filters do not suffer from windowing artifacts and are precisely adapted to the local dip (Helmore, 2009).
Spectral decomposition-based inversion for seismic reflectivity: Thinbed spectral inversion (Chopra et al., 2006) is a process that removes the time-variant wavelet from the seismic data and extracts the reflectivity to image thicknesses far below seismic resolution using a matching pursuit implementation of sparse spike inversion. In addition to enhanced images of thin reservoirs, these frequency-enhanced reflectivity images have proven very useful in mapping subtle onlaps and offlaps, thereby facilitating the mapping of parasequences and the direction of sediment transport.
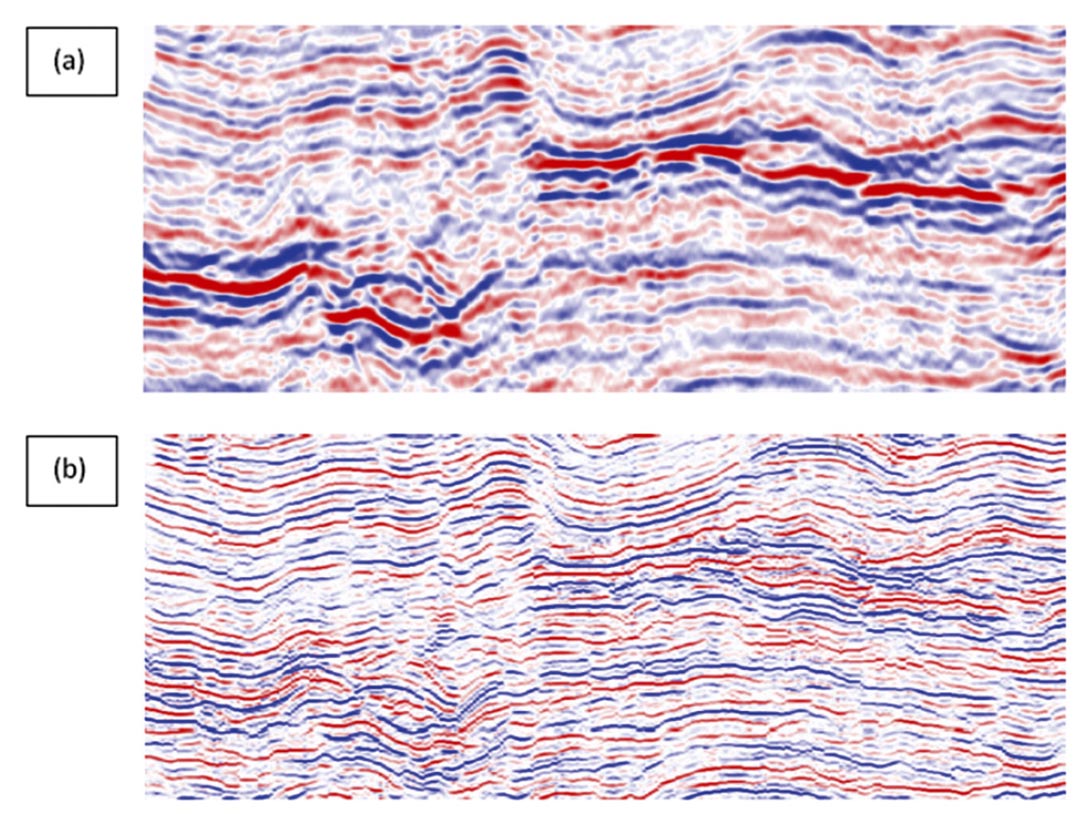
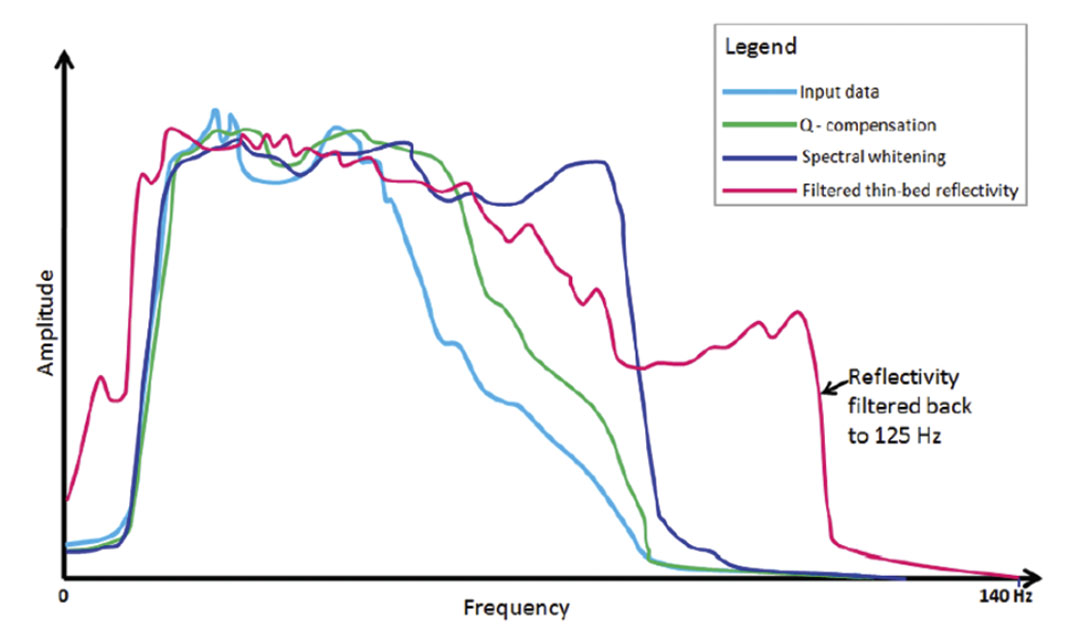
Figure 2a compares a segment of a 5–80 Hz seismic section from Alberta and its thin-bed reflectivity inversion (Figure 2b). Notice the increased detail in terms of extra cycles. It is convenient for an interpreter to convolve the derived reflectivity volume with a 5-120 Hz bandpass wavelet that would yield a high frequency volume. In addition to facilitating detailed interpretation, these ‘filtered’ volumes can serve as input for generating high-bandwidth attribute volumes. In Figure 3 we show the amplitude spectra for the same data volume subjected to the different methods discussed above. Notice that the high-frequency volume generated from thin-bed reflectivity inversion serves to show the highest frequency enhancement. Depending on the quality of the data as well as the access to one of the methods discussed above, the data needs to be frequency-enhanced before the attributes can be computed effectively.
Attribute computation on preconditioned data
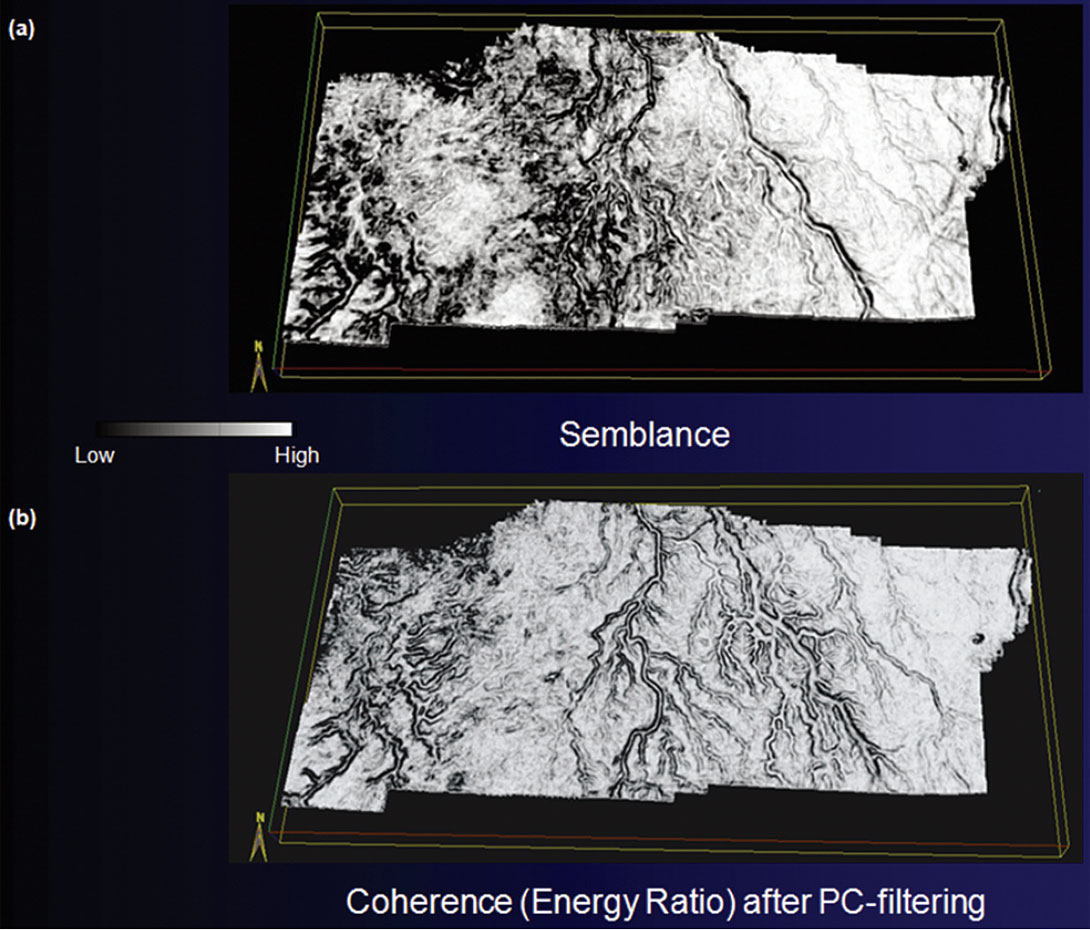
We now show examples of attributes computed on conventional prestack time-migrated data volumes before and after noise suppression and frequency bandwidth enhancement. Figure 4 shows a comparison between a conventional semblance horizon slice from northeast British Columbia, Canada and the equivalent slice from the dip-steered energy-ratio coherence volume run on principal-component filtered data, using similar lateral and temporal attribute analysis parameters. Notice the clear definition of the main channel, running almost north-south, as well as the branching channels on the west side of the image.
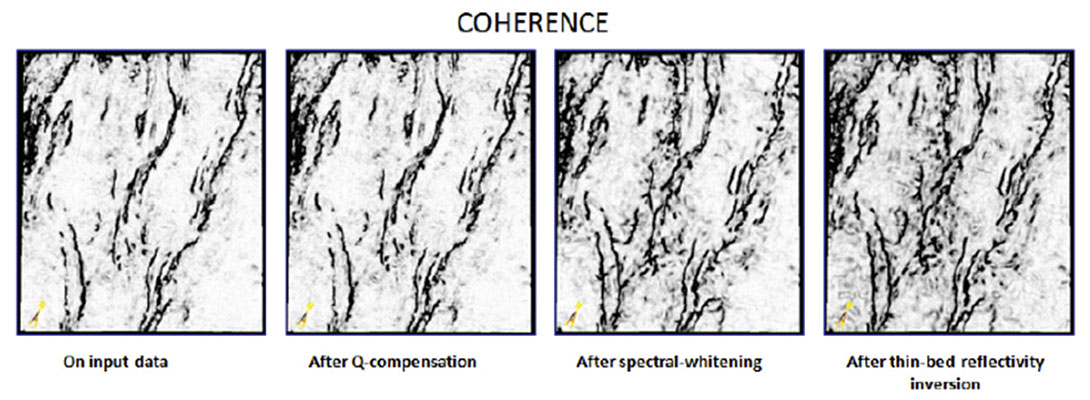
In Figure 5 we show stratal slices through attributes computed from both the original and frequency-enhanced data. Note that the improved frequency resolution does not significantly change the long-wavelength curvature. In contrast, the impact on coherence is significant, where we note increased lateral resolution of the channel system.
Conclusions
By these examples I hope to show that computation of attributes is more than a process that involves pressing some buttons on a workstation. Rather, I recommend careful examination of the input seismic data in terms of frequency content as well as signal-to-noise ratio or any other noise contaminating the data.
Structure-oriented filtering can sharpen edges of both structural and stratigraphic features of interest. Frequency enhancement techniques including Q-compensation, spectral whitening, frequency-split structure-oriented filtering and thin-bed reflectivity inversion (in that order) can significantly resulting attribute images. Needless to mention, all these methods may not be available to an interpreter. However, this exercise serves to bring out the information that should be borne in mind while making choices for methods of frequency enhancement. Ideally, all of these tools should be in the hands of the interpreter to allow him or her to make choices appropriate to the geological hypothesis that they wish to evaluate.

Acknowledgements
I wish to thank the CSEG for bestowing the honor of selecting me as Distinguished Lecturer for 2010-2011, which has given me the opportunity to travel to 15 different Universities and Associations and interact with researchers and practitioners, which otherwise would not have been possible. I also wish to thank Kurt Marfurt, my long-time good friend and co-author of several papers and two books, for his association and inspiration, which has stood me in good stead in our journey to explore and learn more about seismic attributes. Finally, I would like to thank Arcis Corporation, the company that I work for, for giving me a free hand to make time from my work responsibilities for the DL trips.
Related Reading


Join the Conversation
Interested in starting, or contributing to a conversation about an article or issue of the RECORDER? Join our CSEG LinkedIn Group.
Share This Article