Abstract
In 2010, Petrobakken Energy acquired several companies with resource play potential in the Cardium formation in West Central Alberta. After the first year of encouraging results the company set out to further evaluate these properties in 2011 and drilled an additional 120 wells into the Cardium. Multistage hydraulic fracture stimulations (“fracs”) from horizontal wellbores were employed to evaluate these properties with varying results. After reviewing several months of production profiles, several questions were being asked. Why were the results so variable? Was it because of the geology, the reservoir pressure, or the frac style, and what technologies should we utilize to maximize our frac efficiencies and well productivity. Microseismic was acquired in eight separate projects to answer some of these questions. This paper will present a case history of the Cardium Microseismic project including the local geological setting of the Cardium and examples of the recorded Microseismic events from West Pembina, East Pembina and Garrington. The resultant economic impact of multi-stage hydraulic fracing in the Cardium in West Central Alberta will be supported by the Microseismic project observations and post frac well production.
Introduction and Project Area
The Cardium Microseismic data objectives were to observe and analyze the effectiveness of our Cardium completion programs by:
- Recording the Microseismic events post hydraulic frac.
- Providing recommendations that would create a more capitally efficient completion program.
- Confirm the success of all frac stages in the treatment well.
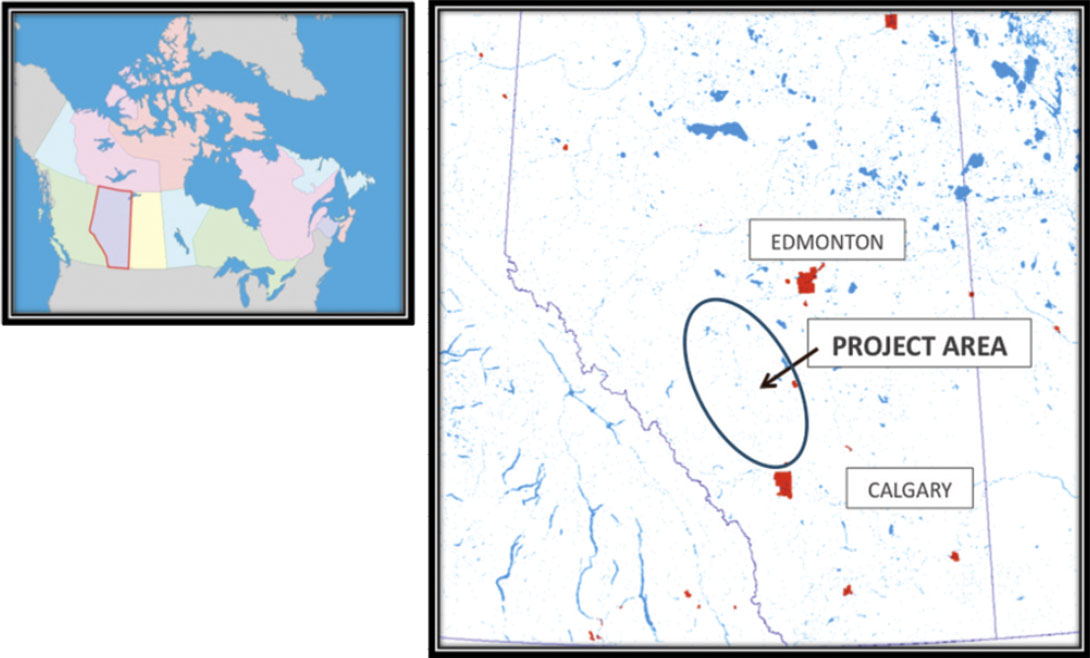
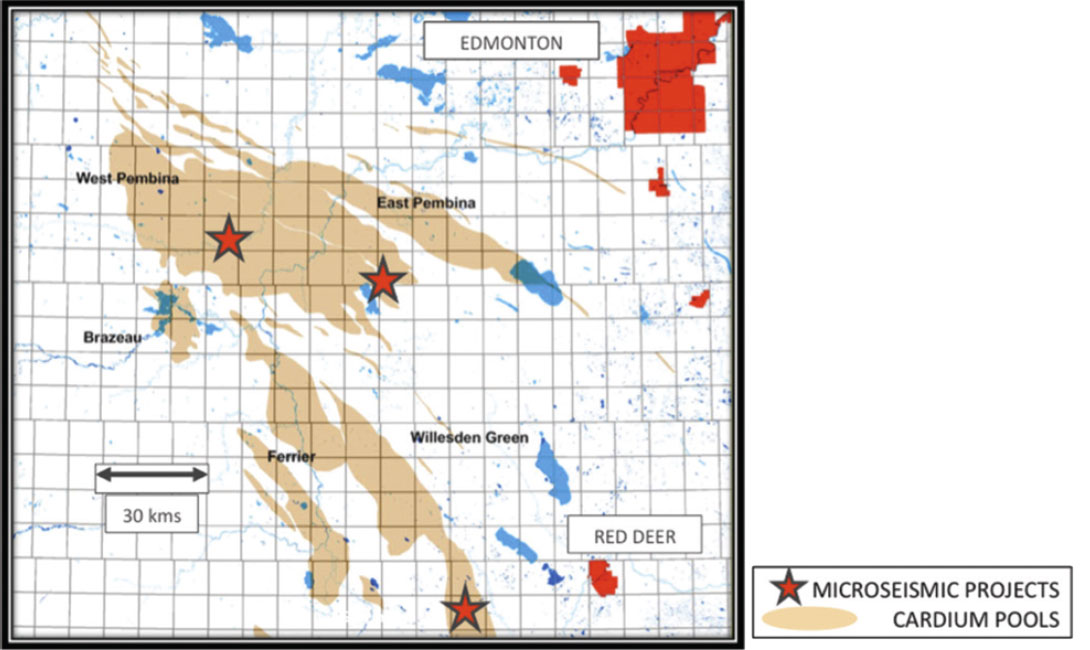
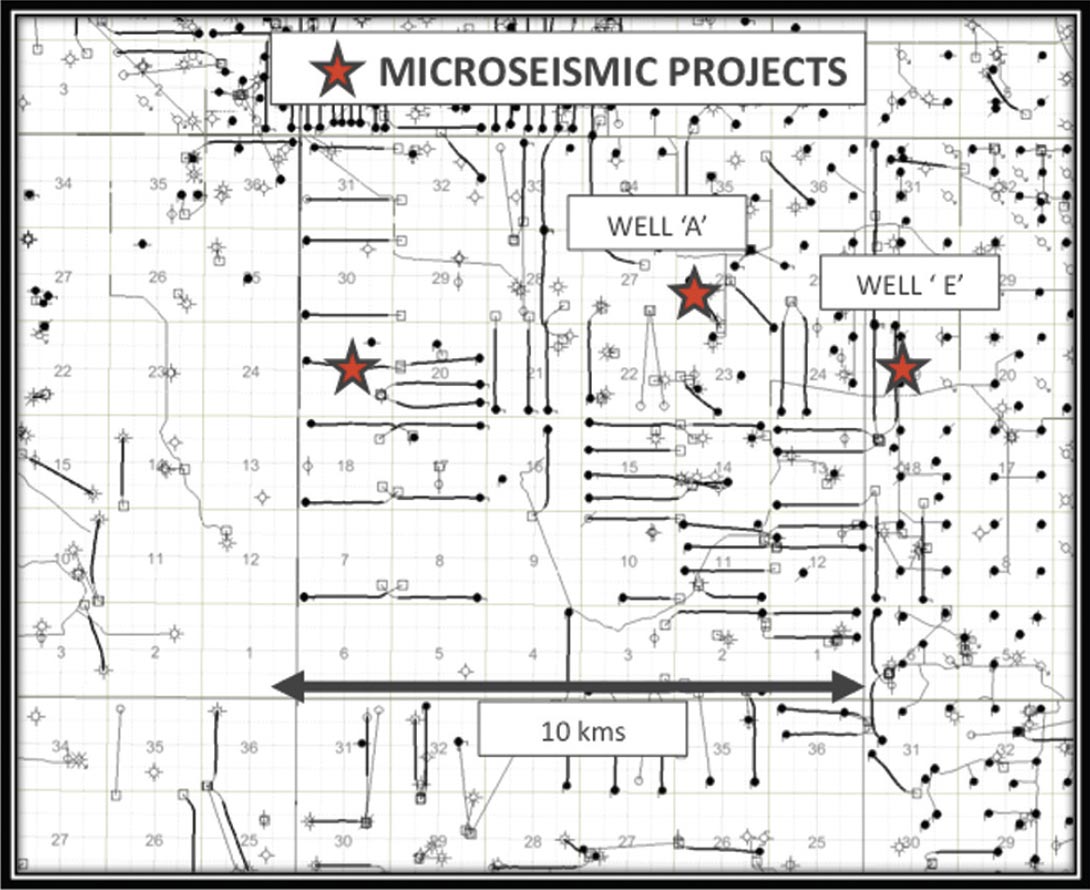
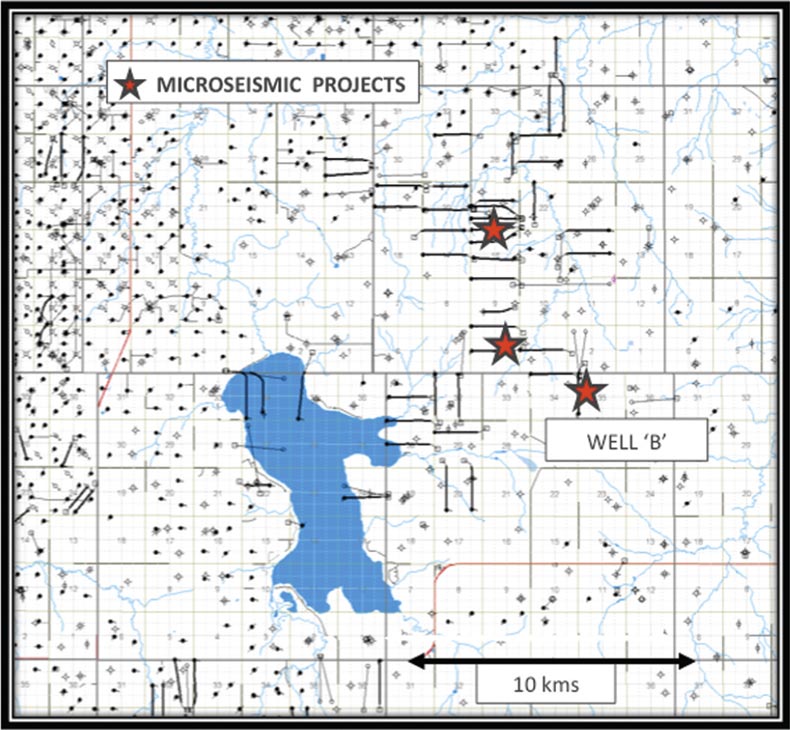
Eight Microseismic projects were recorded on PetroBakken’s Cardium lands that lie from just north of the City of Calgary up to the “halo” flanks of the East and West Pembina Cardium pools starting 80 kms SW of the City of Edmonton in Alberta, Canada. (Figures 1. and 2.)
Cardium Geology
The Pembina oil field was first discovered in 1953 by Mobil Oil, and currently consists of 20 individual pools that have produced over 1.1 billion bbls from an original oil in place (OOIP) of 7.46 billion bbls. (Alberta Geological Society “AGS” Website).
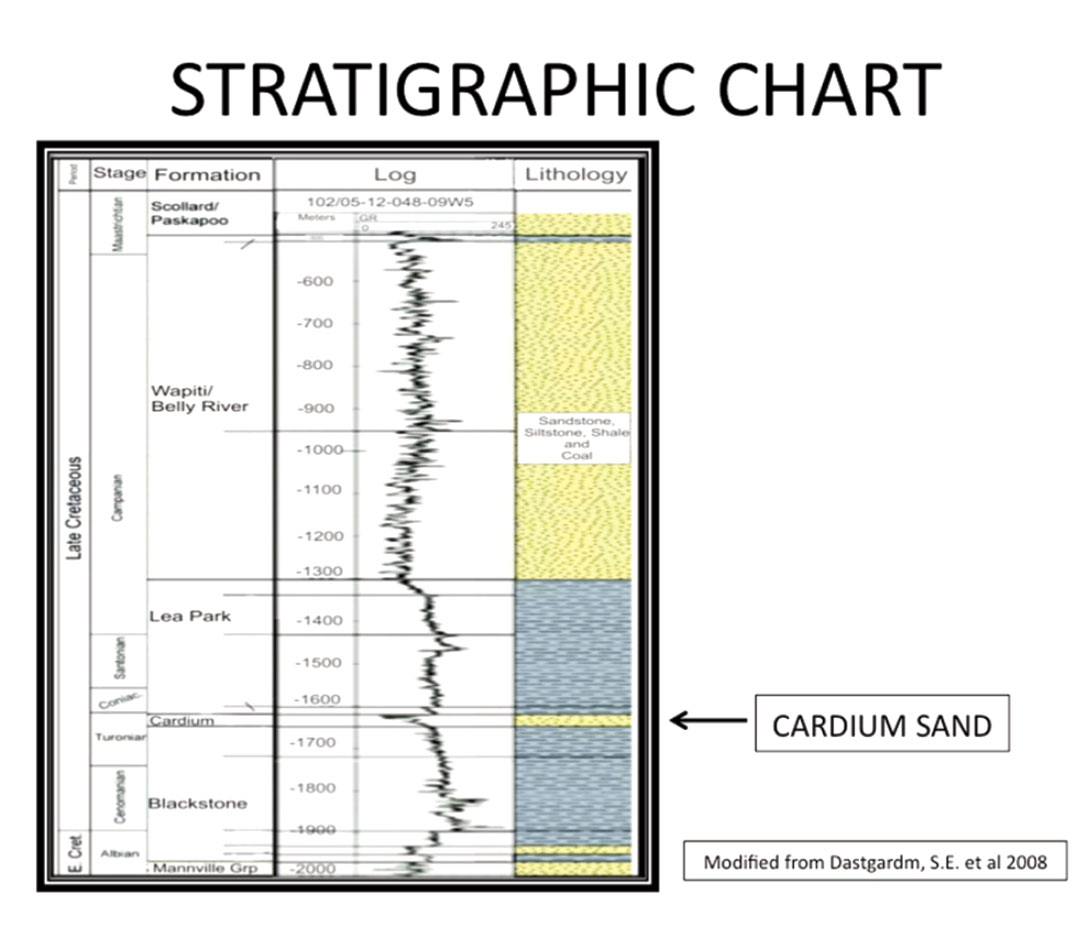
The Cardium formation is a late Cretaceous, Turorian, marine clastic that overlies the mudstones of the Blackstone formation and includes repeated and stacked successions of silty mudstones through siltstones to very fine to fine grained sandstones, (Keith, 1991). These units are unconformably overlain by chert-pebble conglomerates which in turn are overlain by the marine mudstones of the Colorado (Wapiabi) (Figure 3).
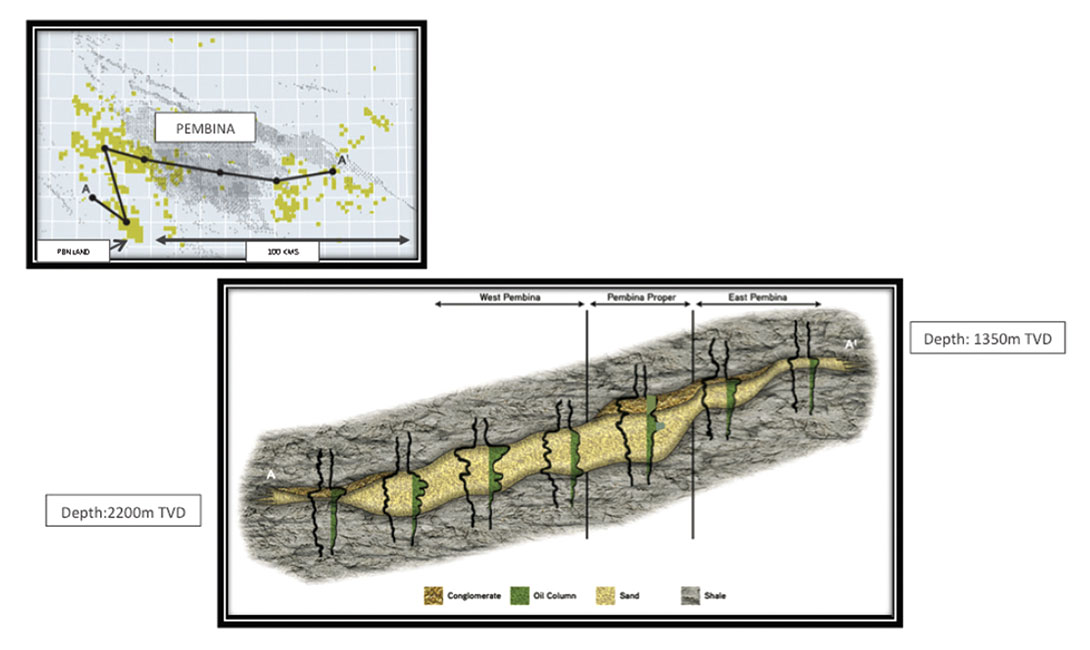
The thicker, highly permeable and porous conventional reservoirs have been exploited since the 50’s through the Pembina area. The current focus on the tight oil Cardium play is on the margins or “halos” of these conventional fields where the gross reservoir is up to twelve meters thick with a net sandstone thickness varying between three to seven meters. The variability of these marine clastics is shown in the 140 km long geological schematic shown in Figure 4 that trends from the Brazeau area through West Pembina, and Pembina proper to the East Pembina pools. This figure illustrates the coarsening upward cycles of the Cardium formation and the local extent of the capping conglomerates.
The measured reservoir pressure over the study area varies from a depleted pressure of 7 mPa to virgin pressures of over 22 mPa. The maximum stress direction, based on published literature and wellbore calipers, was estimated to be perpendicular to the Rocky Mountains or towards the NE.
Microseismic Acquisition and Methodology
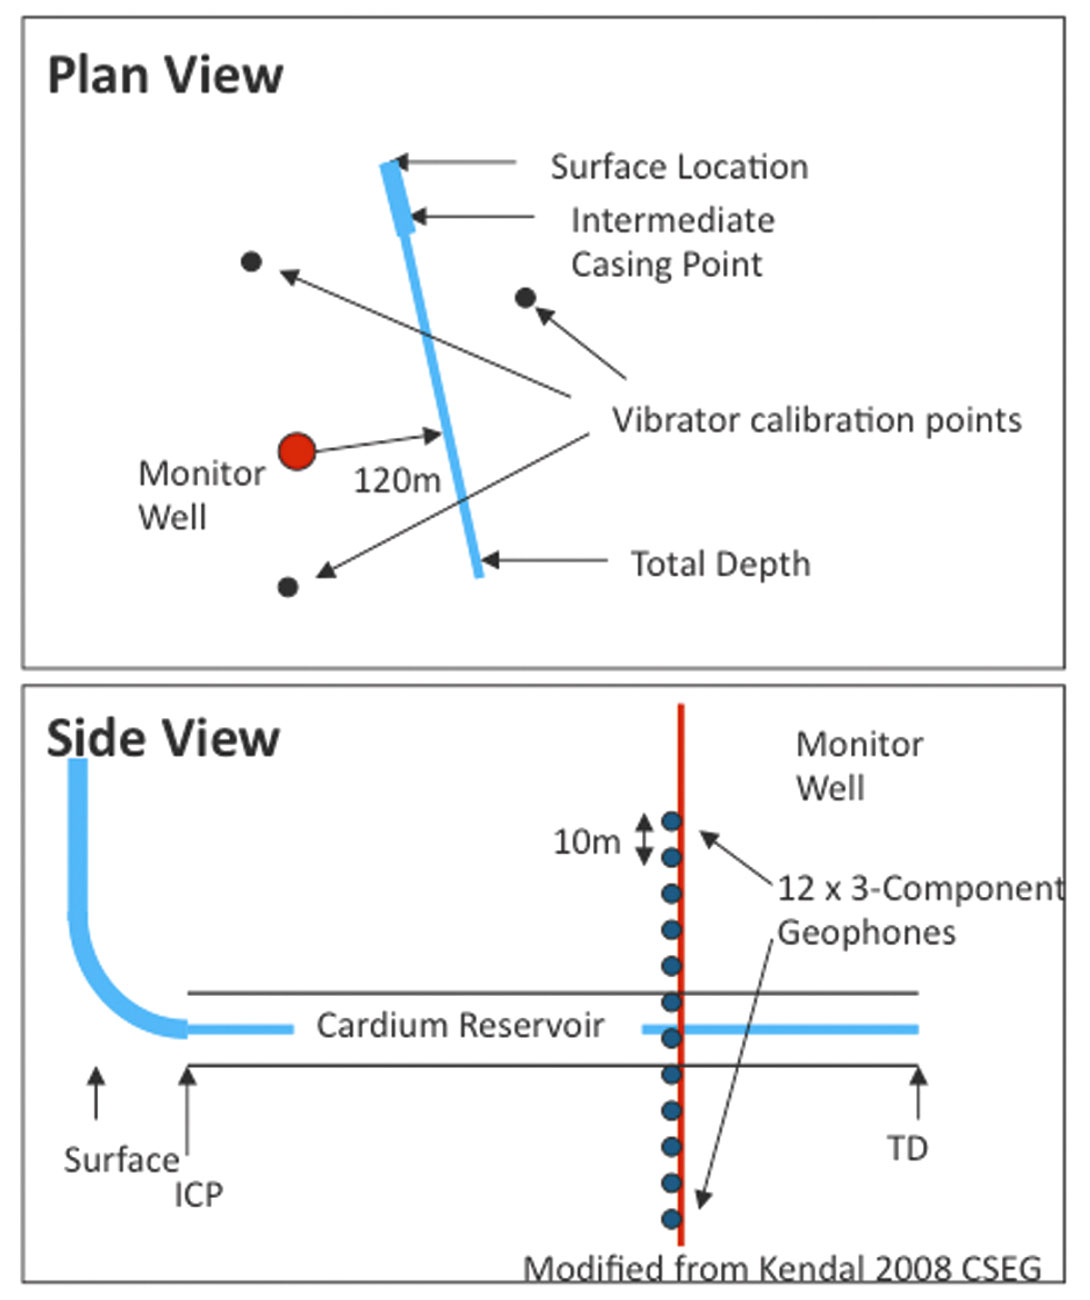
The typical Microseismic acquisition layout is shown in Figure 5. The treatment well path is shown in thick blue with the horizontal “lateral” section shown as a thinner blue line.
The vertical monitor well is shown in red and is about 120 m away from the treatment well.
In order to properly orientate the twelve 3-component geophones or Microseismic sensors, several Vibroseis calibration points were acquired. In addition to the Vibroseis and density data, Vp and Vs information is calculated through the acquisition of Sonic and Dipole sonic logs. This data is used to determine the velocity field for the treatment well and when combined with the frac port location details, provides an accurate methodology to locate the Microseismic events with confidence.
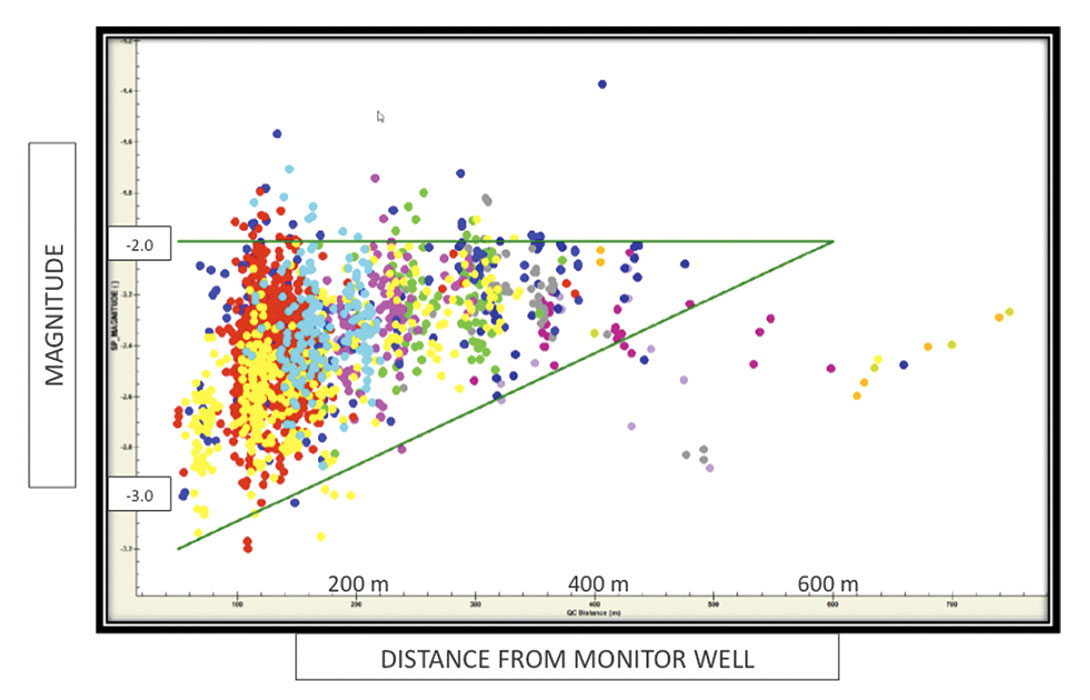
The magnitude of the events recorded in these Microseismic projects were typically very low energy ranging from a maximum of -1.4 to - 3.2 . (Figure 6.) As the study grew, it became obvious that even though micro seismic events were recorded beyond 800 m, the more reliable events and event patterns were recorded within 525 m from the monitor well.
The velocity model for a typical Microseismic project is shown in Figure 7. This model is run from the surface to below the Cardium zone, where possible, through the use of offsetting sonic and dipole logs or the monitor well itself. The logs show that there is an increase in Vp and Vs as well as Density at the top of the Cardium zone as well as the Cardium sand. Having the geophone sensor array lie above and below the Cardium provided superior events imaging results due to the clarity of direct arrivals from the treatment well.

Microseismic Projects
Eight Microseismic programs were recorded from 2009 – 2011 that consisted of gelled oil, slick water and gelled foam fracs. The treatment wells were typically monitored using a single downhole monitor well with the exception of the last project which had two downhole monitor wells. Dipole Sonics were typically acquired in each monitor well and velocity fields were adjusted for event history matching. Surface Vibrators were used for the Microseismic sensor positioning.
West Pembina
Three treatment wells were monitored in the West Pembina (as shown in Figure 8).
There were three different frac types/styles as well as facies changes in the geology. These differences in the West Pembina Cardium geology can be observed by comparing logs from the main “vertical” and “halo” reservoirs as shown in Figure 9a where, based on a porosity cut off of 6%, the Vertical well at 100/01-31-49-11W5 shows four stacked cycles with 8.3 m of pay with an average porosity of 11%. Whereas the Halo well at 100/09-24-49-12W5 on the left shows three thinner cycles with 5.3 m pay and an average porosity of 9.5%.
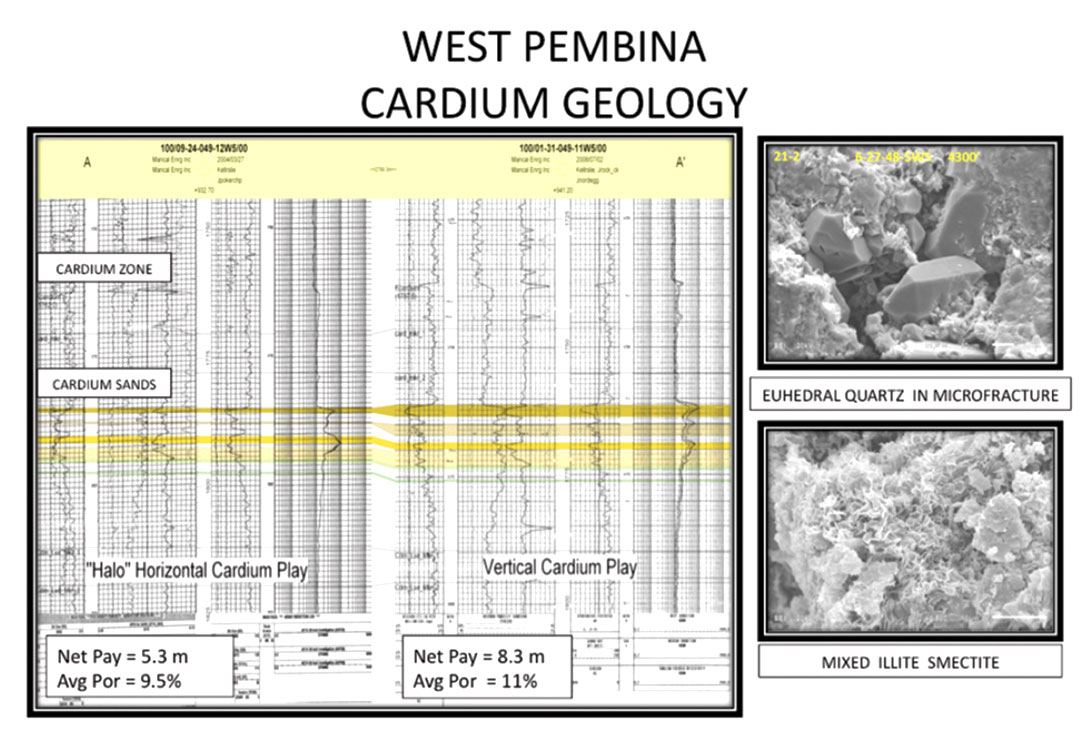
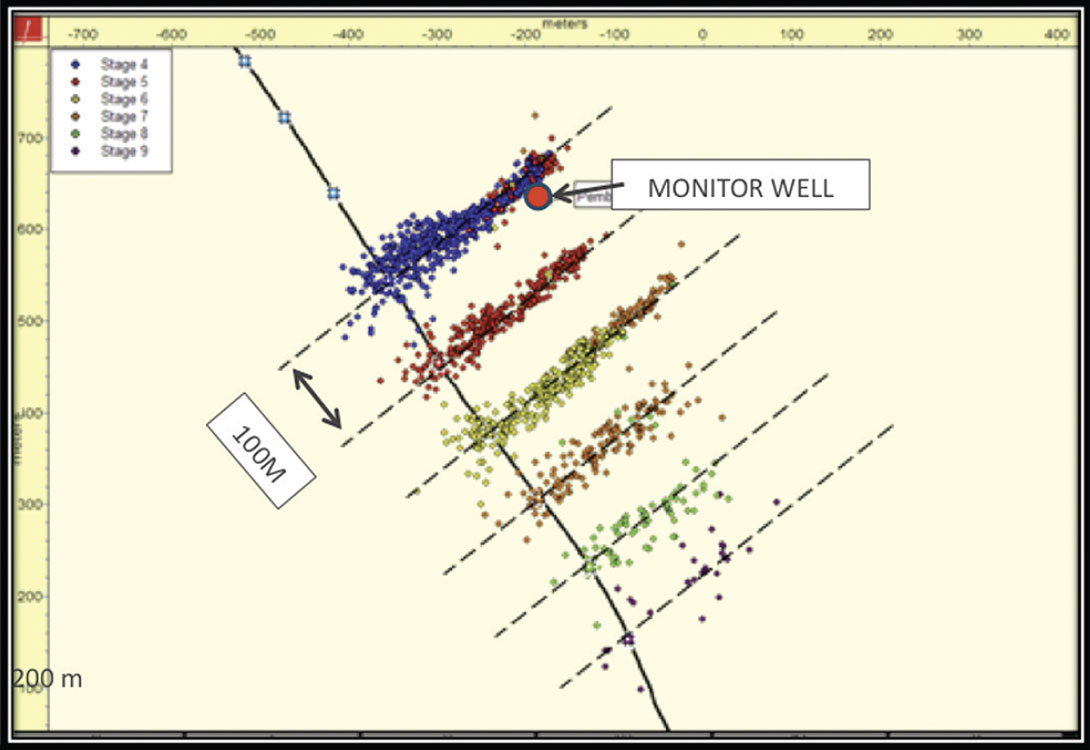
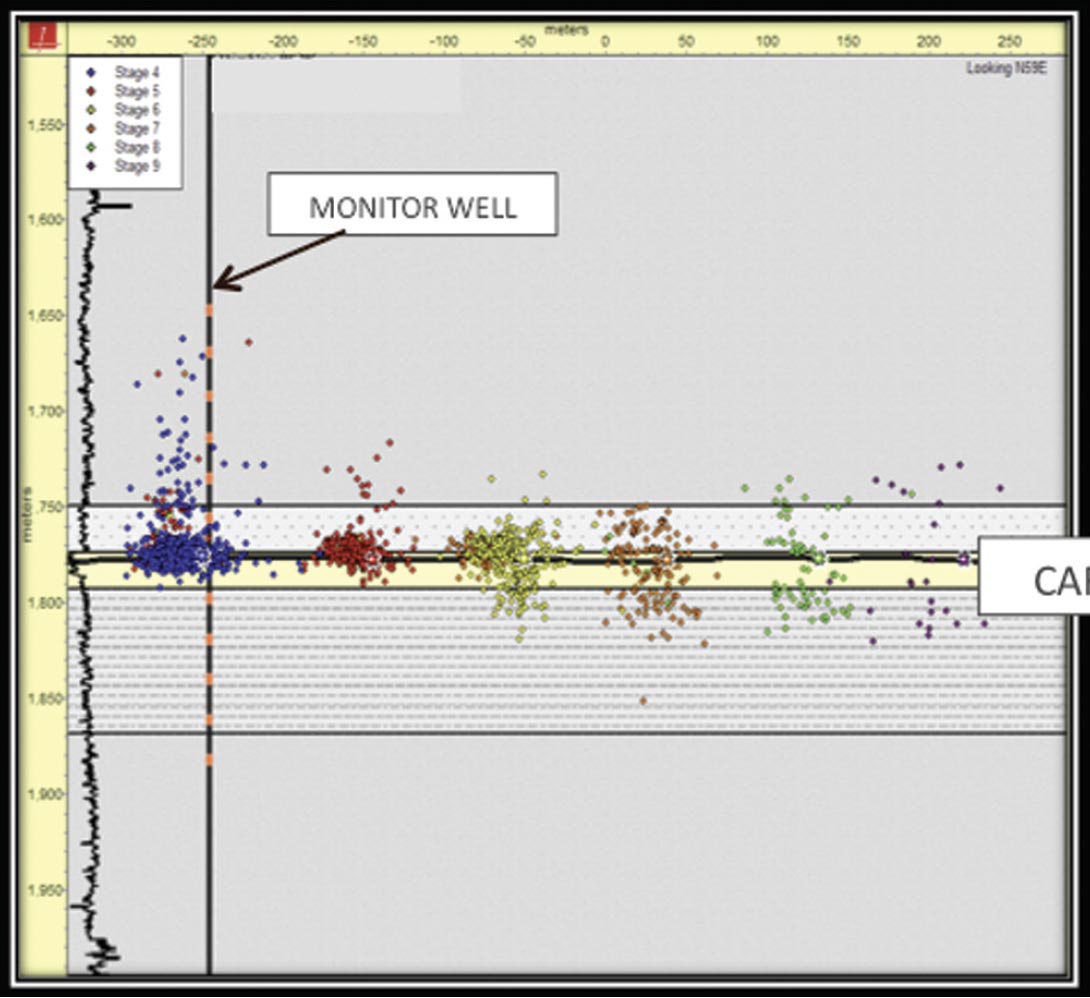
Two interesting lithology characteristics that impact the Cardium reservoir production can be observed on SEM. Euhedral quartz crystals, Figure 9b, are found in open fractures which when connected through a fracture network enhances production in the Cardium zone. The variable percentage of mixed clays such as smectite and illite, Figure 9c, reduces the effective deliverability of our wells due to being sensitive to water damage. The Well A treatment consisted of nine 30 – 40 tonne Gelled Oil fracs injected at 3.5 m3/min. The ports were 100 m apart within a cemented liner. Figure 10 shows the areal extent of the Microseismic events breaking along planar wings with a strong consistent NE-SW azimuth with a half width of 270 m to the NE and 50 m to the SW. It was also noted that because of the continuous recording, later time events were observed as the frac wings continued to grow when the subsequent frac was initiated. Figure 11 illustrates the stages in Transverse view showing frac heights of 40 m +/- above and below the Cardium zone. The degree of departure increases away from the monitor well and is related to inaccuracies in the velocity field. Both Figures show significant un-stimulated reservoir between ports which resulted in the company reducing the distance between frac ports in subsequent treatments.

Well A’s production is shown in Figure 12. It shows an initial production IP30 of 142 bbls/day with a one year cumulative production of just over 25000 bbls. This well is considered economic for the Cardium play.
East Pembina
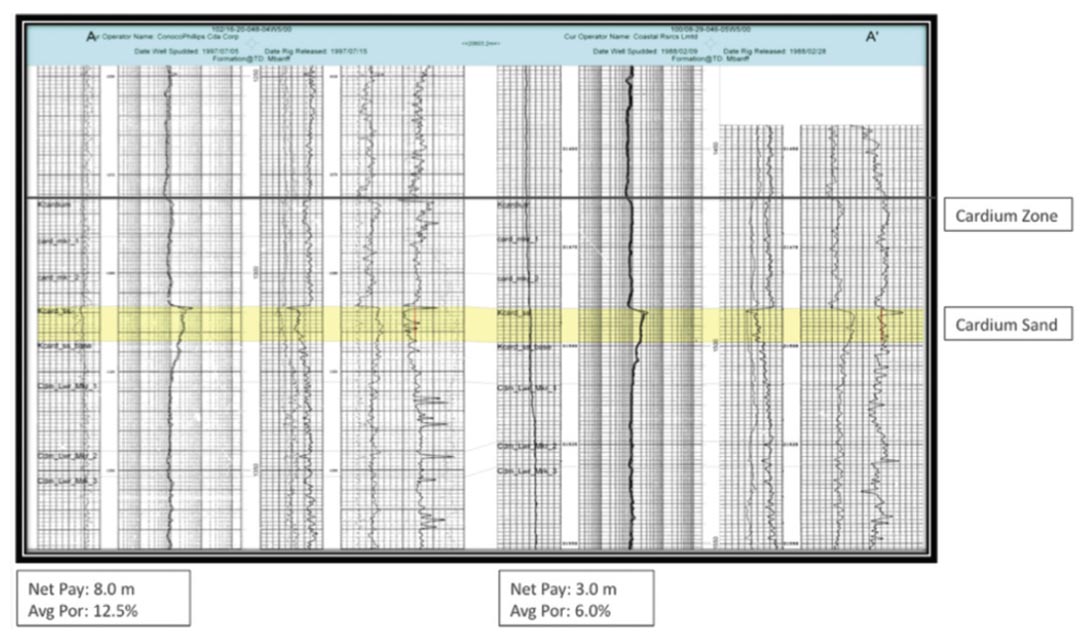
Three treatment wells were also monitored in the East Pembina area, Figure 13. In parts of this area the Cardium zone has a significantly reduced net sand reservoir that is illustrated in Figure 14. The well on the left, 102/16-20-48-04W5, is a vertical Cardium well from within the East Pembina Cardium oil pool, that has produced over 144,000 bbls in its 50 year life. It has a Net Pay of 8.0 m with an average porosity of 12.5%. In contrast, at 100/08-29-46-05W5, near where the Well B well was drilled, the net pay is 3.0 m with an average porosity of 6%.
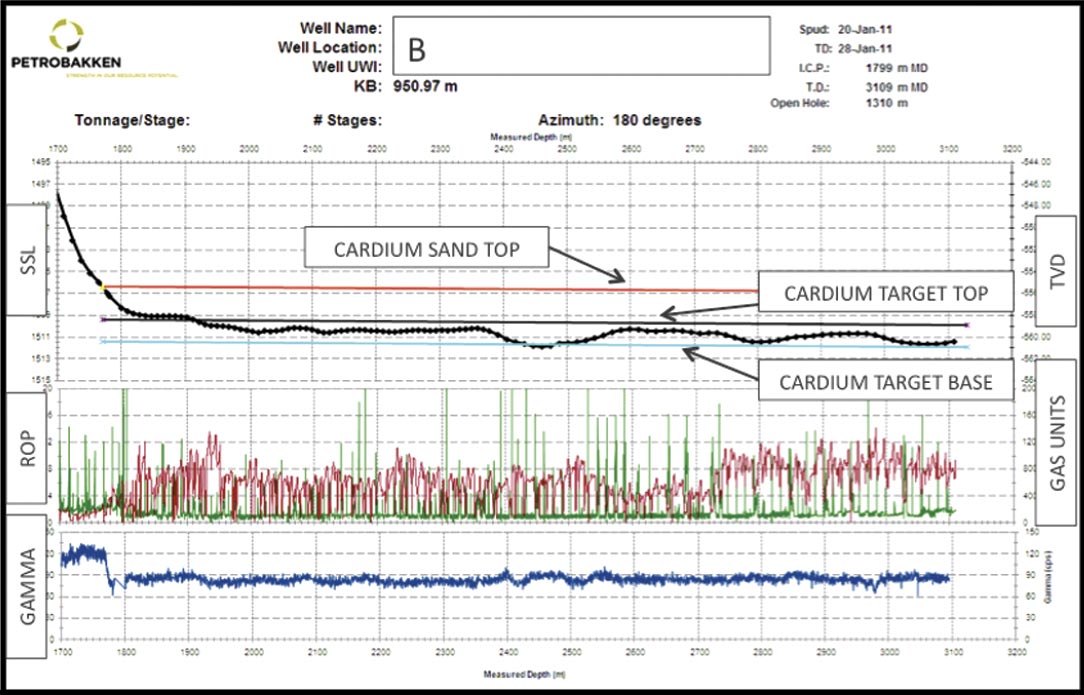
A typical wellbore plot for an East Pembina well is shown in Figure 15. This tool is used to help guide our operations team on the drilling and completing of a typical Cardium horizontal well. The well path is shown in the upper graph with the Cardium Zone, target Cardium Sand Top and Cardium Sand Base identified. The middle graph shows the ROP (Rate of Penetration) in green and the Gas Detection Units in red. The bottom graph shows the Gamma curve in API units and is a key indicator for landing the horizontal and staying in zone. These images confirm the proportion and quality of reservoir – that the lateral portion of the well was in the “target” zone for the Cardium.
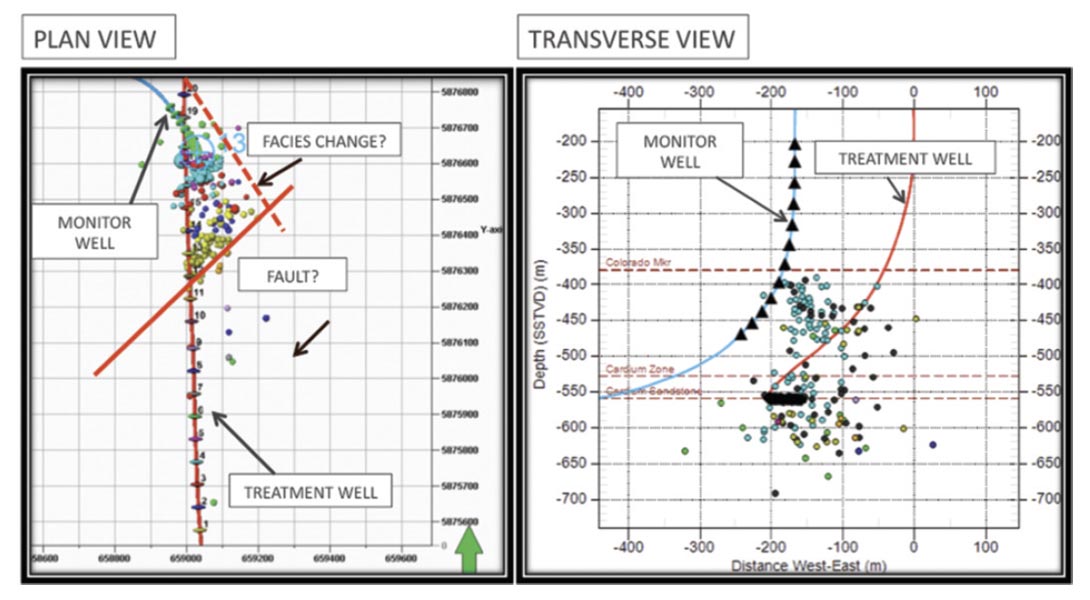
Well B’s Microseismic was monitored using the vertical section of a subsequent drilled but “not yet” stimulated Cardium horizontal. The treatment was twenty stages using nitrified slickwater at 6.0 m3/min, placing about 20 tonnes of sand/frac. Looking at the Microseismic event “cloud” in Figure 16 one can observe that the recorded events were 100-150 above and 30 -50 m below the Cardium zone and that this “cloud” appeared to be fault/facies controlled. Very few events appear to cross the interpreted fault/facies lines indicated in red. The frac wings were also asymmetrical with average half lengths 115 m to the NE and 55 m to the SW. This treatment produced a very small amount of weak events considering it was a slickwater frac at a relatively high rate of injection.
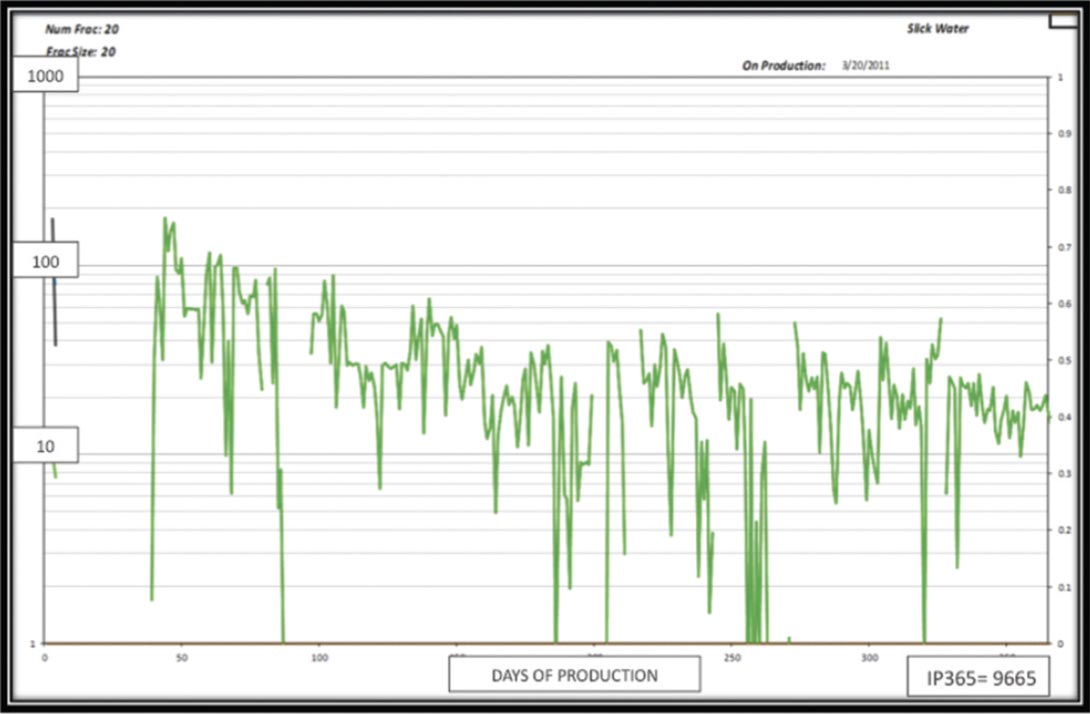
Well B’s production is shown in Figure 17 and shows that even though the well’s initial performance was over 150 bbls/day the well is considered to be a marginal and has leveled off at about 20 bbls/day after producing less than 10,000 bbls in one year.
Garrington
Two parallel, 400 m apart, treatment wells were monitored in the Garrington area, Figure 18. This setup allowed PetroBakken to compare two different treatment techniques and monitor them from the same vertical well. It also allowed the company to address the observation: “The reason why the fracs appear asymmetric is because you only get events close to the Monitor well and on the Monitor well side of the treatment well”.

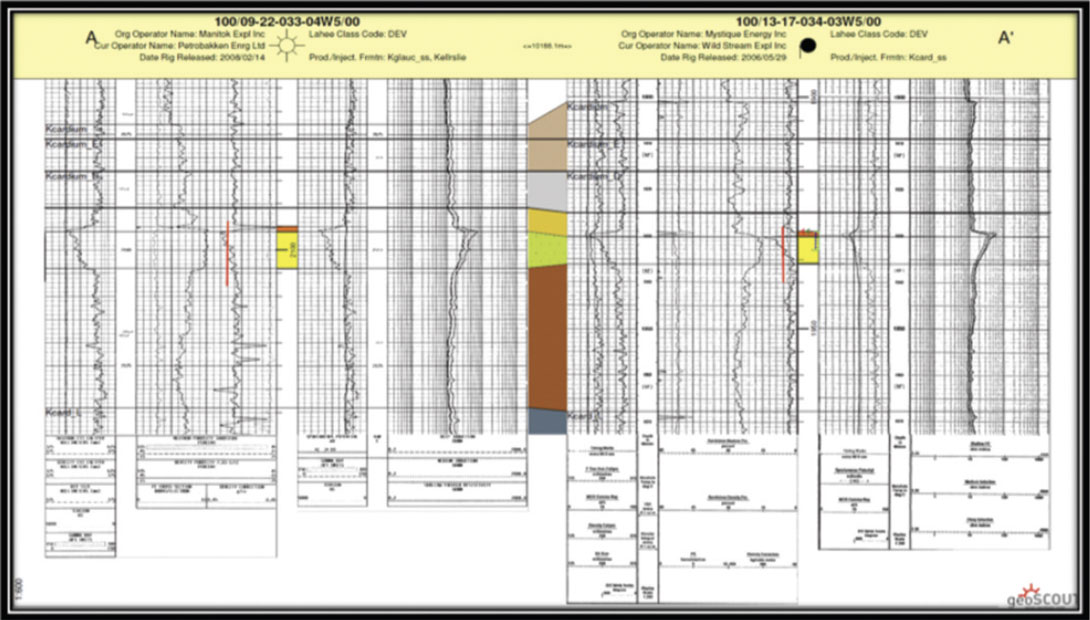
The Cardium geology in the Garrington area is good and Figure 18 shows two wells from the area, the 100/09-22-33-04W5 and 100/13-17-34-03W5 wellbores. The Cardium sand interval can be observed to show one large or two smaller coarsening upwards capped with a thin conglomerate lag. These wells have a net pay range of 5.0 to 8.0 m and average porosity of 6.0 to 7.5 %. The 13- 17 vertical well has produced 93,000 bbls in 20 years. The 09-22 was never put on production.
>
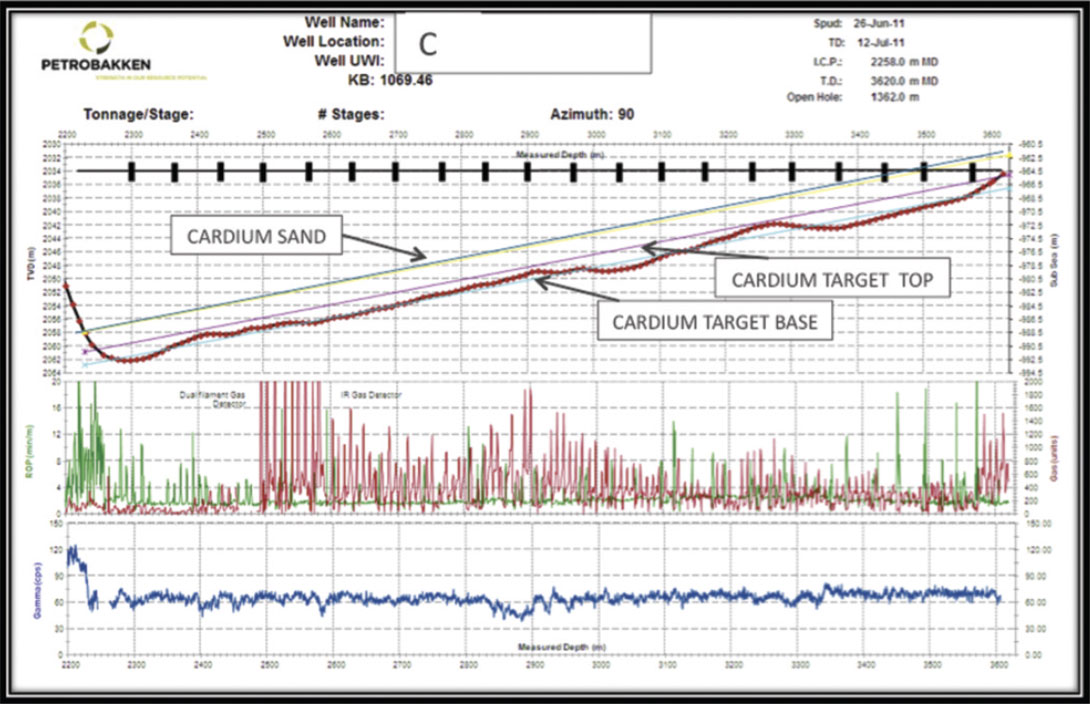
A typical wellbore plot, Well C, for the Garrington area is shown in Figure 20. This figure shows the wellbore path in TVD and MD and illustrates how the lateral section of the well is kept close to the targeted base of the Cardium sand. ROP and Gas detection show the high hydrocarbon response when the conglomerate cap is penetrated and the reduced response when the wellbore falls below the target base when the Gamma curve also starts to increase.
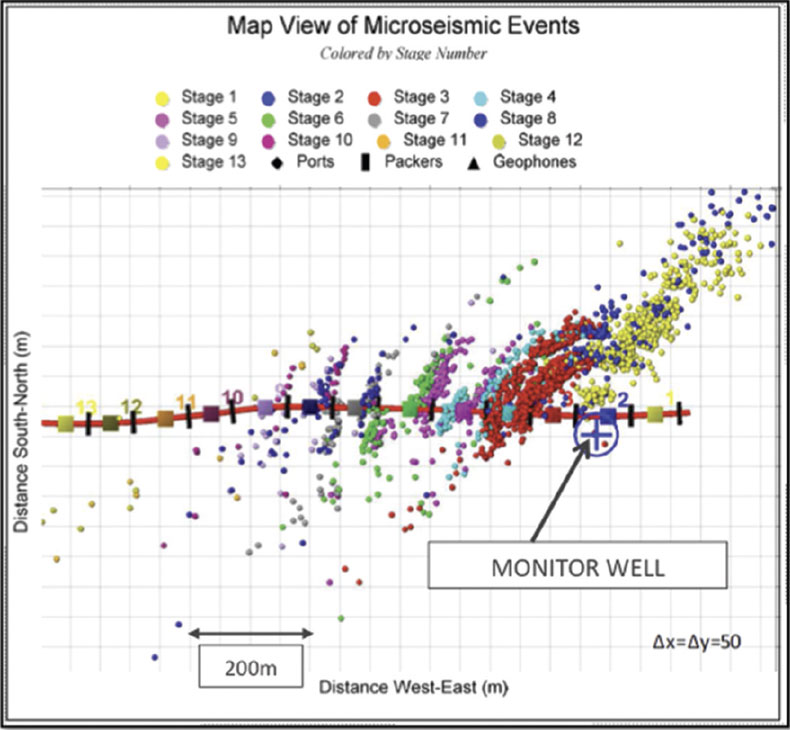
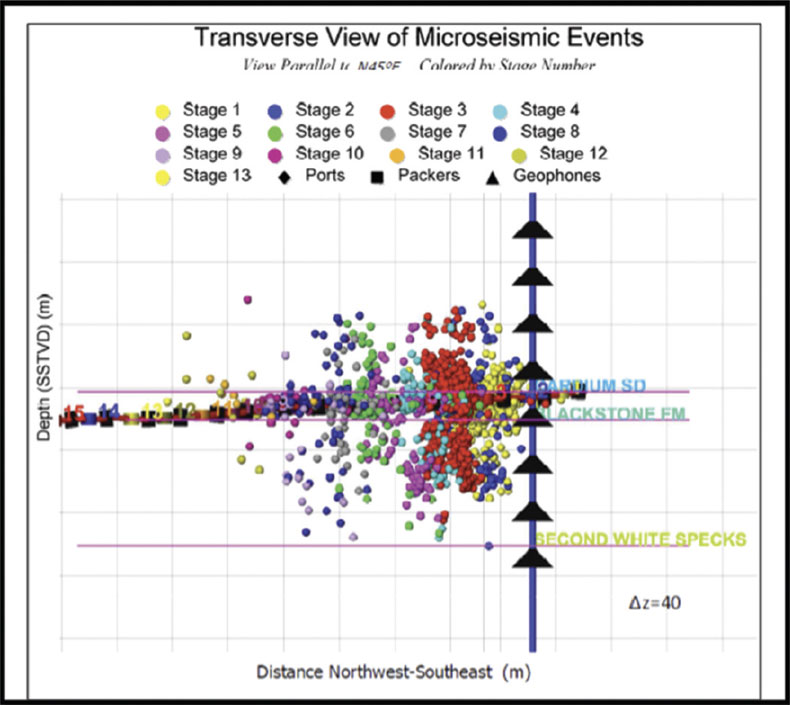
The general observation from Well C’s Microseismic, Figure 21, was that the Microseismic event “Cloud” had a “shattered glass” complex frac network and that once again the frac wings were asymmetric. Well C’s stimulation consisted of twenty stages of 20 tonne slickwater frac delivered at a rate of 6.0 m3/min. It was noted that in this area the frac height was contained within 30 m of the target zone even though the well was stimulated at 6.0 m3/min. The average half lengths were 400 m to the NE and 75 m to the SW.
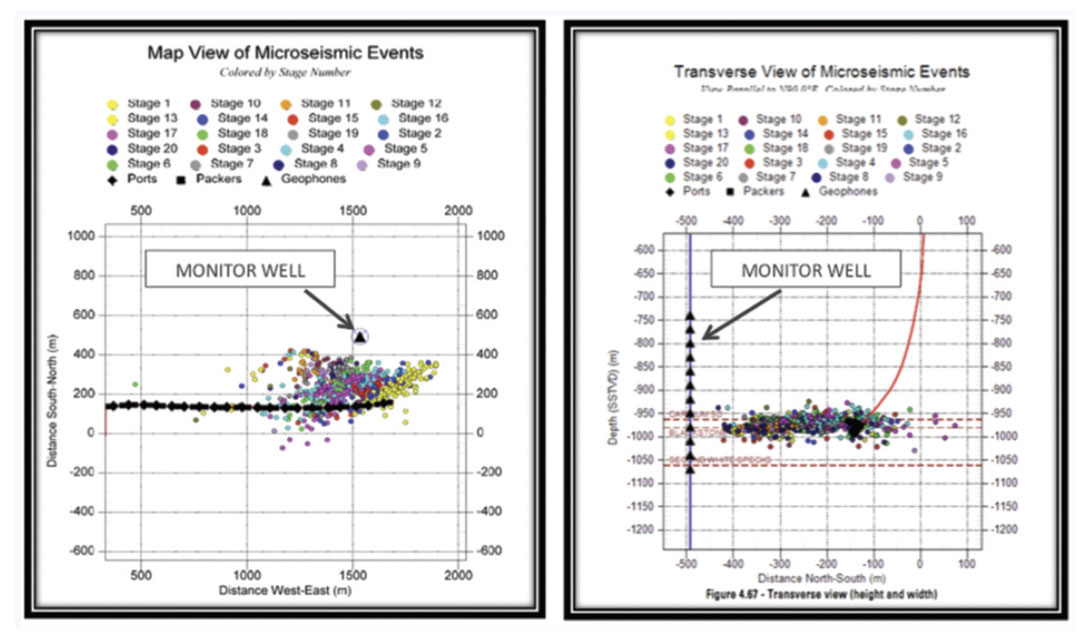
Well D was treated with twenty stages of 20 tonnes foamed fluid injected at a rate of 4.5 m 3/minute and these fracs climbed well over 70 m above the treatment zone. (Figure 22 Plan View and Figure 23 Transverse View). The observed frac wings had a “split wood” or planar frac wing character that had an asymmetric character with average frac half widths of 420 m to the NE and 200 m to the SW. In Well D the monitor well was on the opposite side of the treatment well disproving the monitor well – asymmetric “cloud” theory referred to earlier.
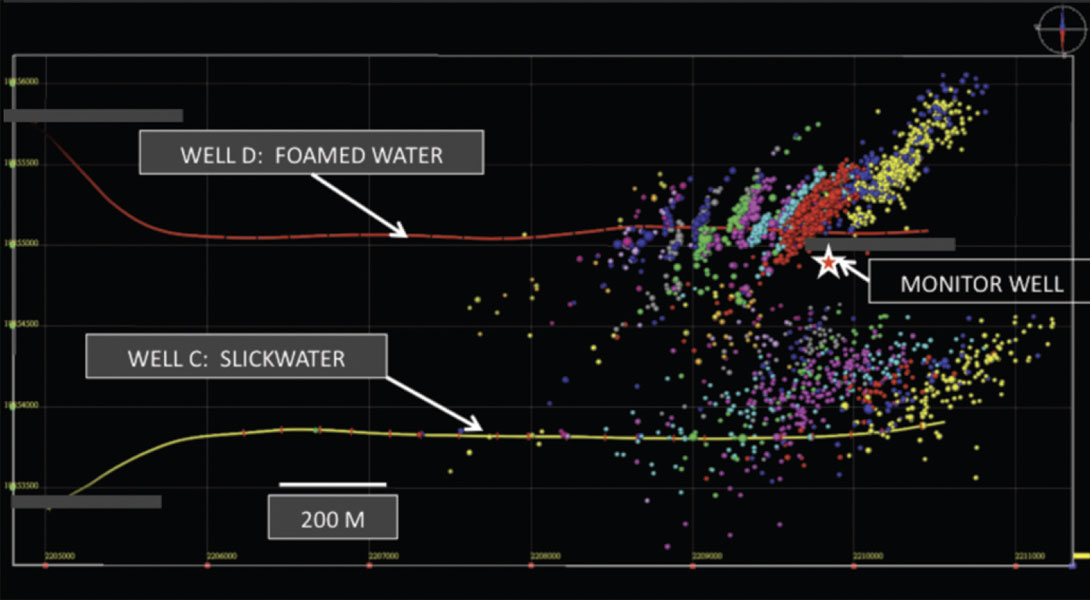
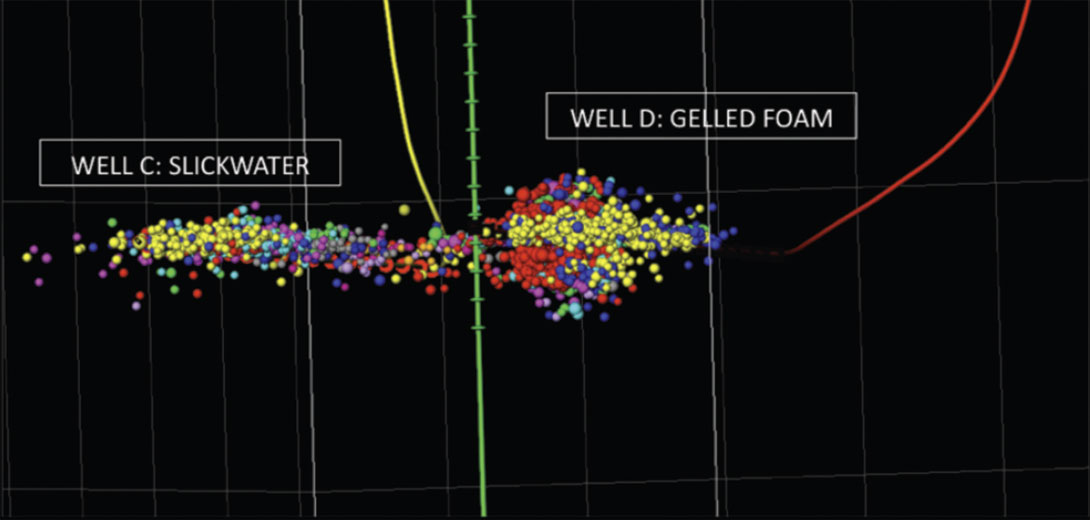
Figure 24 Plan View, and Figure 25 Sectional View, illustrate the comparisons between the Well C Slickwater and Well D Foamed water fracs in the same picture. Figure 24 clearly shows the “shattered glass” complex nature of the slick water frac and the planar “split wood” character of the Foamed Water frac. Figure 25 clearly shows the slickwater frac to be tightly compact about the Cardium zone whereas the Foamed water frac grows in height and depth.
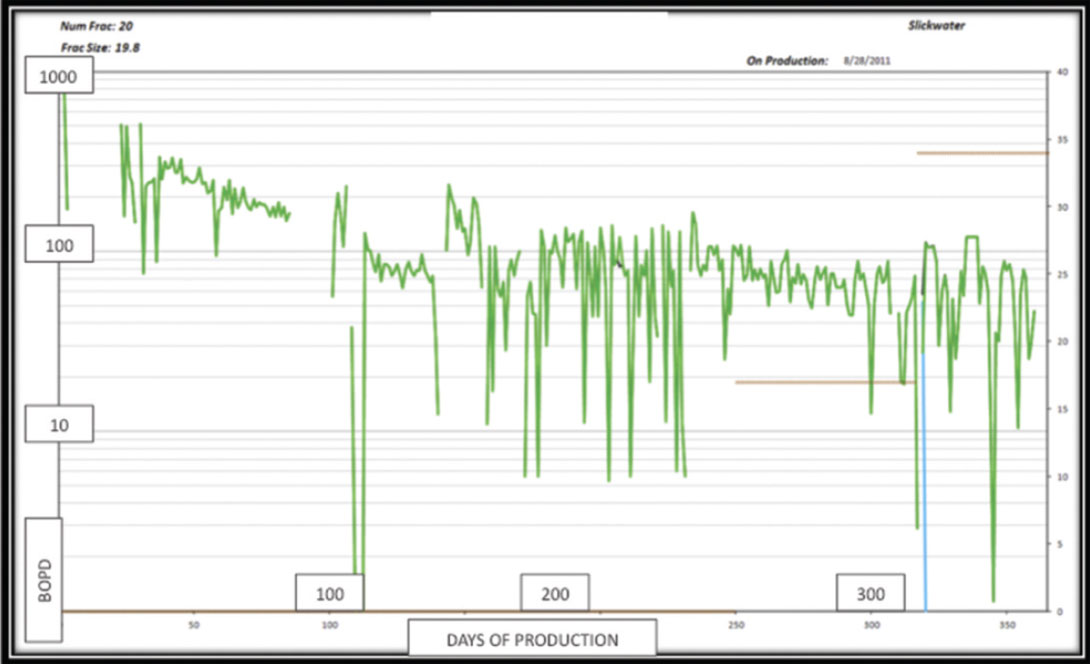
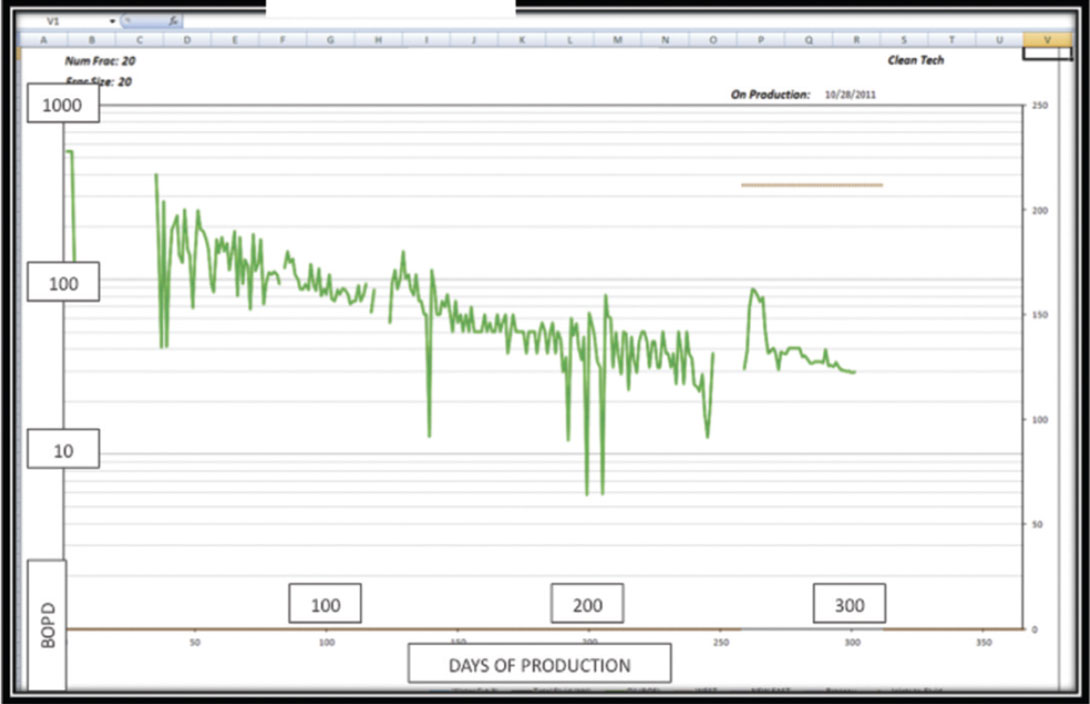
The best comparative for the Cardium team from a business perspective is shown in Figure 26 Well C’s Production and Figure 27 Well D’s production. Although both wells are very economic, Well C is far superior in production profile compared to Well D.
Garrington Well Production Details
Well C: IP 30: 113.2 bbls/d IP90: 168.12 bbls/d Cumulative Production( 365): 34,669 bbls
Well D: IP 30: 57.3 bbls/d IP90: 106.2 bbls/d Cumulative Production(~365): 22,000 bbls
Return to West Pembina
Prior to recording Well E in West Pembina, Figure 28, the team reviewed what had been learned from the previous Microseismic jobs.
- The frac were asymmetric and trended NE 200 – 400 m
- The frac ports were reduced to 66 m to maximize the “Stimulated Reservoir Volume” – SRV potential of 20 stages in a single lateral
- The slickwater fracs were performing better than the foamed or gelled fluid fracs
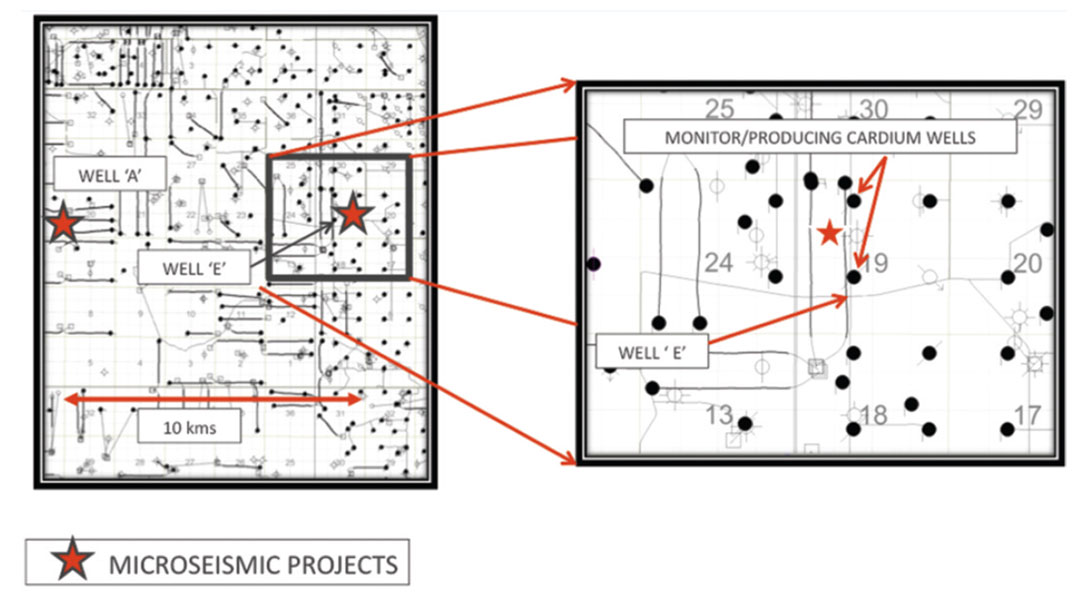
With these observations the Well E completion was planned. Two monitor wells were utilized using 1960 vintage Cardium well bores. The frac ports were gapped to account for the frac wings and the well was treated using twenty 22 tonnes slickwater stages. One of the other reason for doing the Microseismic on this well was there were concerns that the frac wings would bend towards the monitor wells because the reservoir pressure had been reduced from 21 mPa down to 7 mPa.
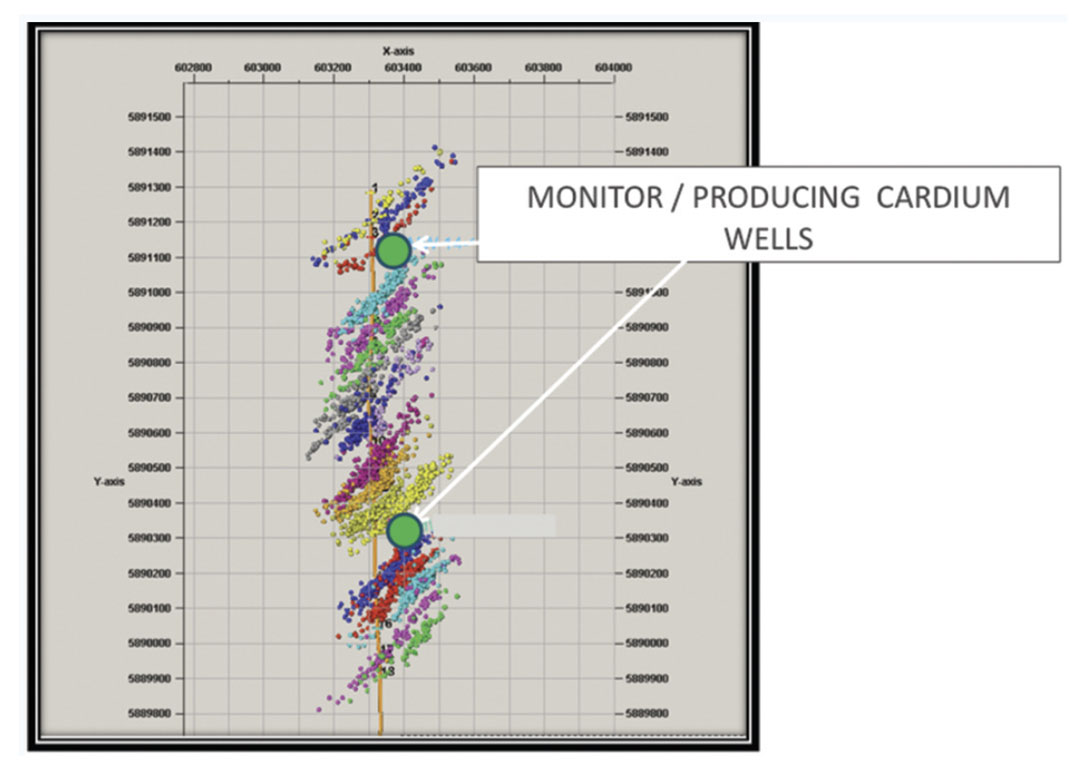
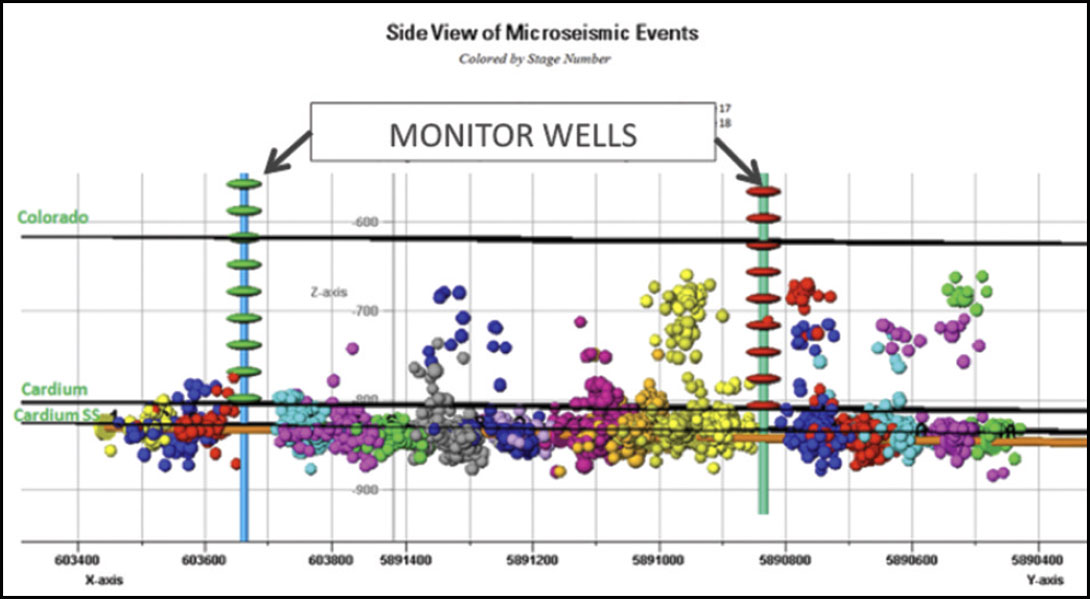
You can see from the Microseismic events recorded from the treatment at Well E in Figure 29 Plan View and Figure 30 Transverse View. By adjusting the frac ports, a clear “corridor” of no events trending NE-SW cuts past the two monitor well locations resulting in no communication with the old Cardium producers. It was noted that the wings are generally asymmetric trending NE-SW and did not bend into the “lower pressure” depleted wells. It was also observed that when the frac pressure climbed to 50 mPa a distinct frac wing was created 30-50 above the Cardium zone and by having the dual downhole monitor wells 60% more events were recorded while treating Well E.
Conclusions
Recorded Microseismic events, in West Central Alberta, from a stimulated Cardium well with magnitudes between -1.4 and -3.0 can be imaged by utilizing down-hole monitor wells if these observation wells are within 525 m of the frac ports.
In the study area it was noted that the frac wings in general trend N45E and that they were asymmetrical.
The Frac height typically stayed with 50 m of the placement zone with the exceptions breaking out due to higher treatment pressure or pre-existing fault plans. The Gelled oil and fluid fracs tended to create a well defined planar “split wood” frac wings whereas the Slickwater fracs tended to a more complex “shattered glass” pattern. Frac lengths typically reached out to 200-300 m and sometime 400m to the NE and typically went 60-100 m to the SW. Two downhole monitor wells recorded over 60% more events over a single downhole monitor.
Modify your frac ports to avoid impacting existing Cardium producers.
This paper was built to illustrate several observations about Cardium Hydraulic fracs recorded through Microseismic images and answer the question of “Why are the results so variable?” Although the question is still being addressed at Petrobakken, it can be concluded that the most critical factor in well performance and inferred frac treatment success is the geology. East Pembina “halo” wells have thin laminated pay with a poor net/gross sand ratio, while the West Pembina and Garrington “halo” wells have thicker, higher net/gross reservoirs.
“Frac Efficiencies” in West Central Alberta can be improved by continuous improvement in integrating the geology, reservoir engineering and frac monitoring into the analysis and discussion.

Acknowledgements
I would like to express my appreciation to PetroBakken Energy to allow me to work on, present and publish this data.
This paper would not have been accomplished without the support of many people at PetroBakken Energy: Their time, efforts and support were greatly appreciated. For their geological guidance: Matt Franks, Don Keith, Parker Moores, and especially Rainer Czypionka. For their engineering advice and observations: Lawrence Backmyer, Barry Hassen, Brian Hawkins, Brian Webb and Chris Mainwaring and for their technical support: Eileen Kelly, Alina Gumerova, and Sherrell Perrett.
Special thanks also go to Irina Nizkous, Zuolin Chen, Richard Parker and Mike Jones at Schlumberger Canada, their depth of knowledge on Microseismic imaging was amazing.
Related Reading


Join the Conversation
Interested in starting, or contributing to a conversation about an article or issue of the RECORDER? Join our CSEG LinkedIn Group.
Share This Article