Introduction
A relatively new method of completing horizontal wells has recently emerged and is quickly gaining popularity. Unlike conventional well construction using a cemented liner and a series of perforations to create different frac stages along its length, openhole completions using multiple, mechanicallyactivated, sliding-sleeve fracports is increasing commonplace (e.g., Seale and Athans, 2008). Multiple ports are deployed on tubing between isolating packers to provide stage isolation within a certain targeted section of the wellbore. Compared to limited entry methods such as plug and perf, completion costs tend to be reduced by avoiding the need for a cemented casing or liner and enabling faster fracturing operations (e.g. Lohoefer et al., 2006). Furthermore, there are also potentially more frac initiation points per stage compared to limited entry perforations, with entire annular space along the isolated horizontal section between packers in contact for fracture initiation (e.g. Al-Naimi et al., 2008). Typically, sleeves are activated by dropping or injecting different sized balls into the well. Balls fit into a corresponding sized seat at a target point in the well (e.g., Wozniak, 2010). Once seated, the balls block flow and increase back pressure that pushes open a sleeve/fracport. As with other unconventional reservoir stimulations, microseismic monitoring has been used to understand the stimulated fracture geometry and also to understand the performance of the completion. Seismic signals with seismogram characteristics have been observed associated with the ‘ball drops’ (called ‘ball drop events’ herein), which will be described in this paper and discussed with potential seismic sources associated with the operation of multiple fracport completions. The paper will also describe several case studies, where these signals are used along with the microseismic and treatment data as diagnostics of the completion performance to help identify the cause of anomalous hydraulic fracture geometry and in particular the effectiveness of the completion to provide intended stage isolation.
Completion Related Microseismic Signals
During microseismic monitoring projects of mechanical fracport completions, characteristic signals began to be observed at approximately the time of the pressure spike following a ball drop. Since there are several distinctive characteristics of these signals along with the obvious causal association with the timing of the ball drops, the signals began to be loosely termed ‘ball drop events’. While the signals are apparently caused by the ball drops, there are a number of potential mechanical actions related to the operation of the completion that could result in a source of seismic energy. Here the characteristics of the ball drops are described and contrasted with typical microseismic events associated with hydraulic fracturing. The signal characteristics will also be used as context for a discussion of potential causes or sources of the signals.
Seismic Signal Observations
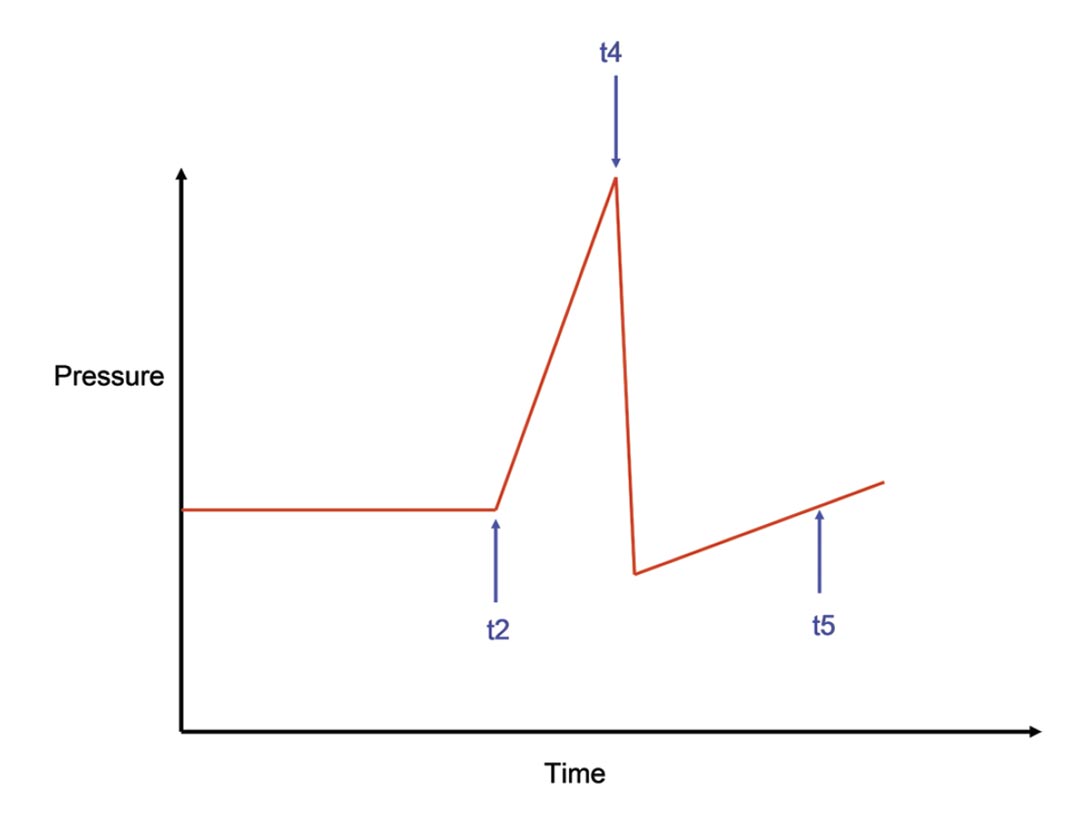
Figure 1 is an example of a pressure curve associated with a ball drop and identifies various phases (Figure 2) corresponding to the opening of the fracports. The ball is pumped into the well and continues to the appropriate sized, target seat. Once seated, the pressure increases until the sleeve slides open. Once the fracport is open, the annular space will become pressurized leading to the fracture initiation in the interval between the packers. Any of the operation phases shown in Fig. 1 and 2 could potentially be associated with the source of the seismic energy, and all approximately correspond to the timing of the observed ball drop events. Note that while the microseismic data is recorded with a GPS system for accurate timing, the injection data is typically recorded with only an approximately synchronized recording clock, making detailed timing comparisons impossible. The ball drop events could be associated with many of the various mechanical actions of the completion operation, which also result in characteristic pressures shown in Fig. 1. Accurate injection timing could provide clues as to the source of the seismic signals, as discussed later.
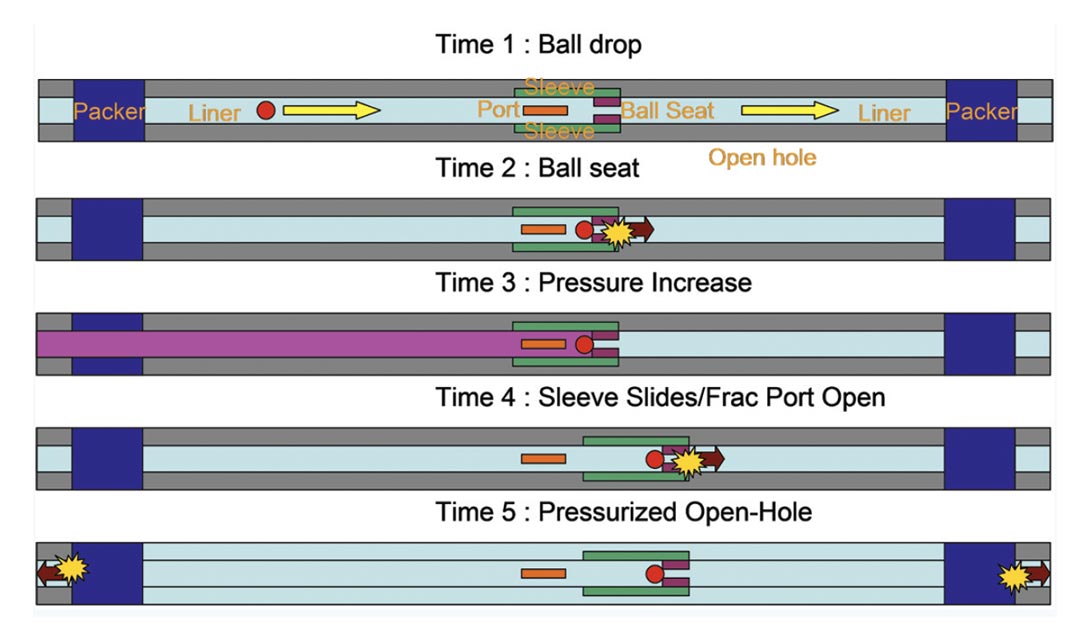
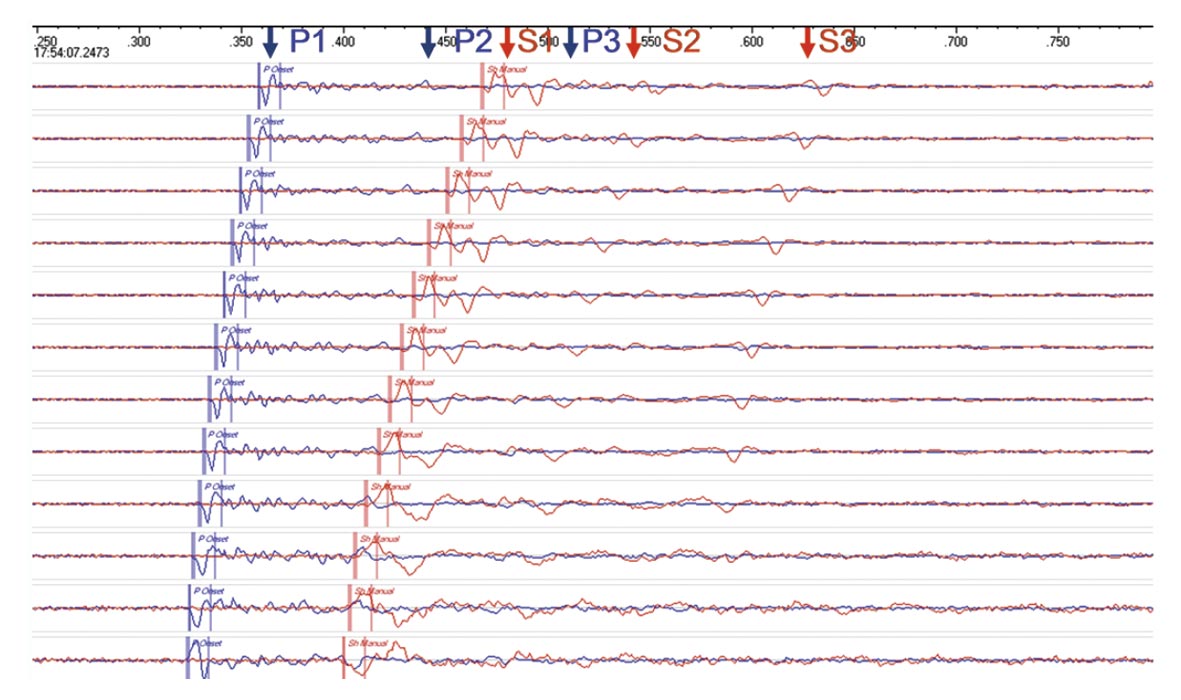
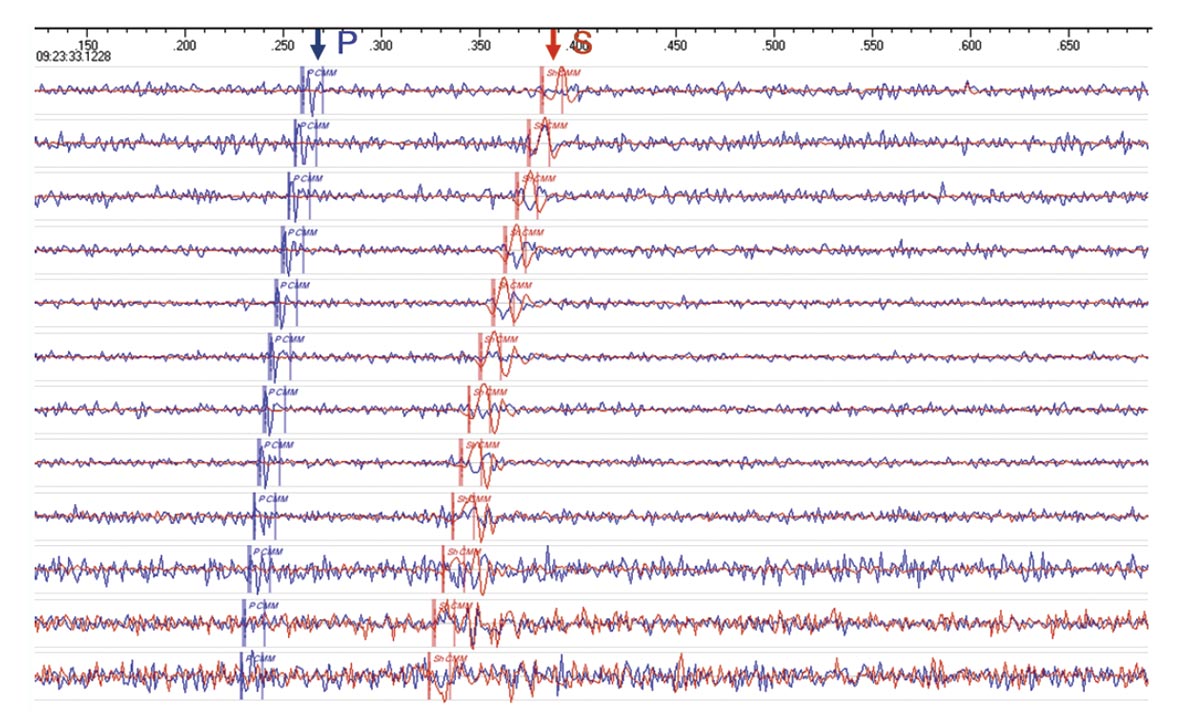
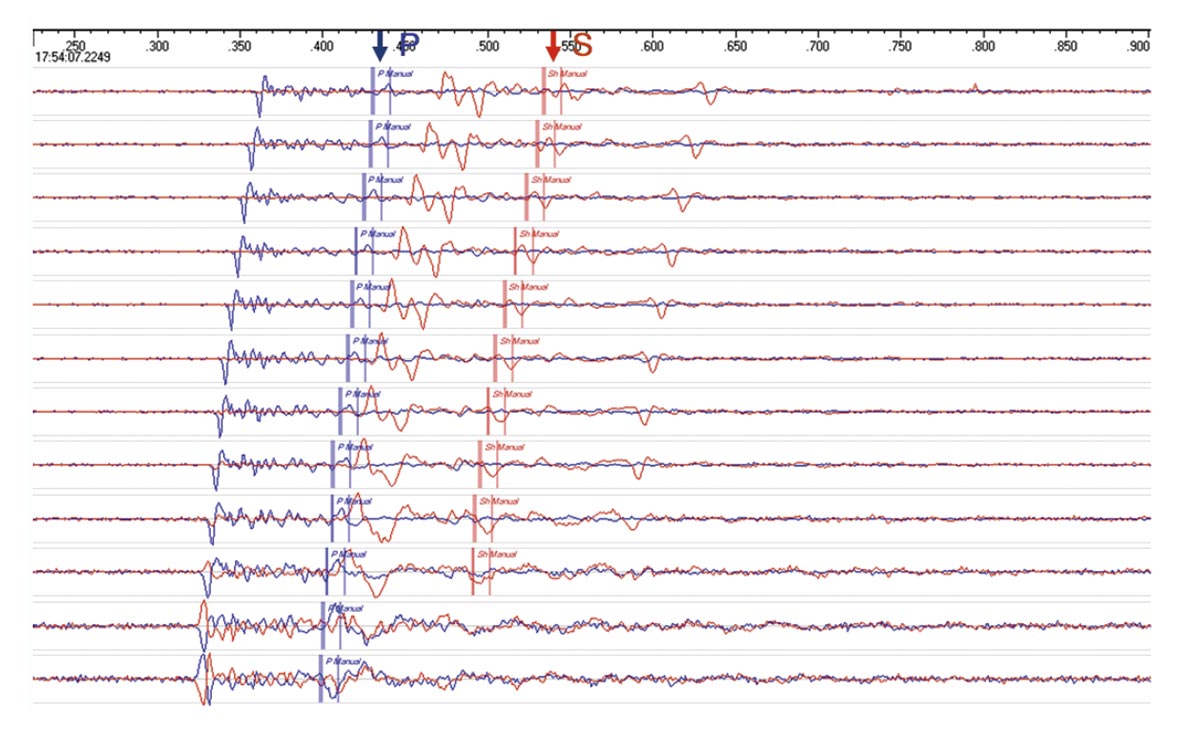
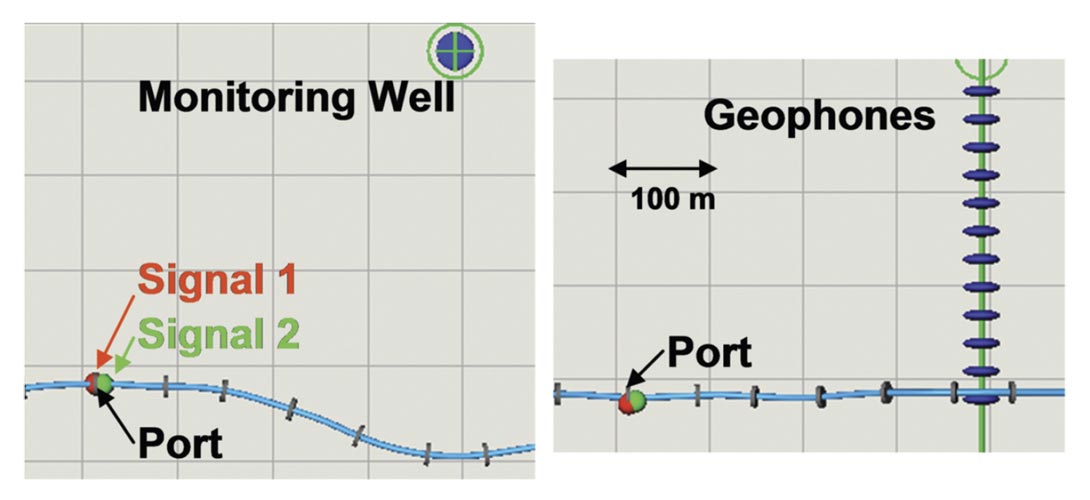
Figure 3 shows a typical ball drop seismic signal, characterized by a relatively large signal amplitude (plot is scaled to the peak amplitude such that the relatively smaller amplitude noise prior to the arrival is barely observable at this scale). As illustrated in this example, there are often multiple discrete signals observed, usually within a time frame of less than a second. Fig. 3 shows three distinct signals with common p and s-wave arrivals, each with similar characteristics but variable signal amplitude. As found in this example, the first signal often tends to be the largest amplitude. For comparison, Figure 4 shows a corresponding signal of a typical microseismic event associated with the hydraulic fracture. The signal amplitude is lower as illustrated in the figure which results in the apparent relatively large noise amplitude before the signal arrival (absolute noise levels are almost identical for Fig. 3 and 4). In some cases a few larger magnitude microseismic events can occur during the frac with amplitudes closer to those of the ball drop event in Fig. 3, although the majority of signals tend to be relatively small such as the Fig. 4 example. Also note in Fig. 4 there is just one microseismic signal with the corresponding p and s-wave arrivals. Occasionally multiple microseismic events can be observed over a similarly short period as the multiple signals shown in Fig. 3. Multiple microseismic signals close together in time tend to only occur occasionally, but are characteristic of many ball drop events. The microseismic signal pulse is also relatively simple, with predominantly one upward peak followed immediately by a downward trough of similar amplitude. The ball drop signal is more complex, as easily seen with the slight delay between the largest peak and trough in the first s-wave signal in Fig. 3. The arrival complexity of multiple signals close together in time and the pulse complexity, suggests a repeating source which has more complexity in time than conventional microseismic signals. As with microseismic signals, the ball drop events can be located and are typically found to locate close to the position of the ports in the completion. In the scenario of Fig. 3 with multiple signals evident in the ball drop event, there is the possibility of locating each signal individually. Figure 5 shows p and s-wave arrival time picks for the second signal. Figure 6 shows the locations of the first and second signals in map view and x-section view. The multiple sources are locating at the port (within the estimated accuracy of a few meters), so that the source is both complex and repeating over a short period of time but each source is occurring at the same spatial location.
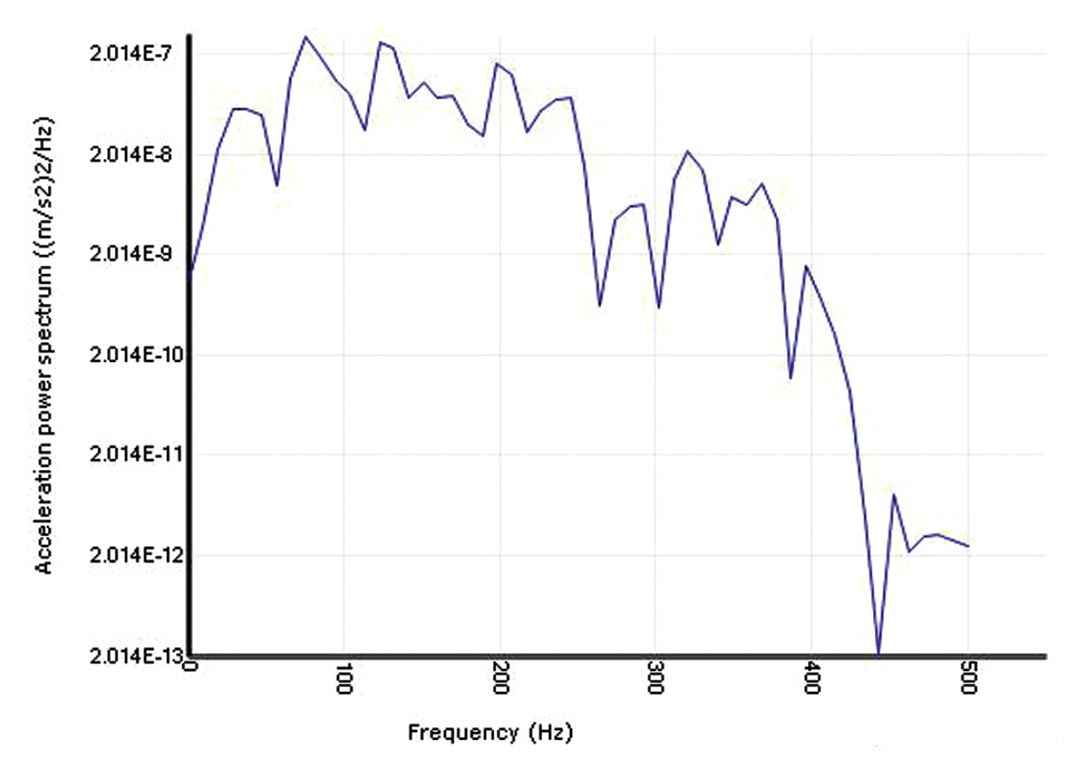
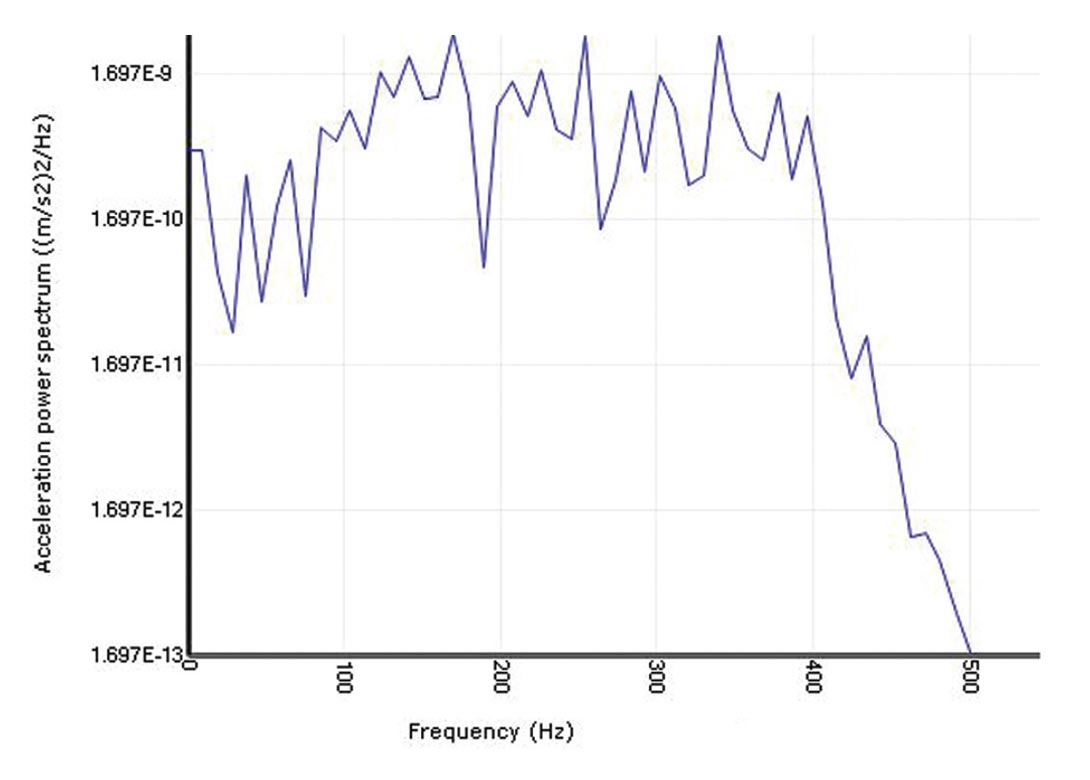
Relative to the microseismic event, the ball drop events also tend to have longer cycle times than the microseismic events. This is illustrated further in Figures 7 and 8, showing the corresponding spectral frequency content (or characteristic time periods computed through a Fourier Transform) of the first p-wave arrival from the ball drop and microseismic event, respectively. The maximum frequency content of the ball drop signal is about 200 Hz compared to the microseismic event that extends to 400 Hz. The lower frequency/lower time duration of the ball drop events indicates a relatively slower or long duration source than microseismic events. The longer duration could be related to a longer slip, from either low slip velocity or a larger displacement. The lower frequency content of the ball drop events provides another diagnostic characteristic, and also suggests a different type of seismic source compared to the microseismic events.
Source mechanisms studies based on amplitude ratios between the p- and s-waves and moment tensor inversions indicate that the mechanism of the ball drop events is consistent with an axial force-displacement.
To summarize, the ball drop events are characterized by the following factors:
- Coincide with the timing of the balls arriving at the downhole port.
- Relatively high signal amplitudes.
- Multiple sets of repeating p- and s-wave arrivals within an interval of less than a second.
- More complex signal pulses than microseismic events.
- Lower frequency content than microseismic events.
These characteristics can be used as a diagnostic to detect and distinguish ball drop events. The source of the ball drop events has the following attributes:
- A strong, energetic source (large seismic amplitude).
- Slow sources (low frequency).
- Mutiple signals occurring at the same location near the packer within less than a second.
- Radiation characteristics of an axial displacement.
In the next section, potential physical sources of the ball drop are explored. Prior to that discussion it should be noted that the ball drop events can also be used for microseismic calibration. Examples shown here are consistent with locations at the ports/ball seats. This is analogous with perforation shots in limited entry completions. Signals from the perforation shots are normally used to determine directions of the geophones in the observation well, calibrate the velocity model and quantify the accuracy of the locations by comparing estimated and true positions. The ball drop events offer the same possibility for calibration, and thereby simplify the monitoring logistics by not requiring additional calibrations sources (borehole or surface shots).
Discussion of Possible Signal Sources
In light of the signal attributes, potential sources of the ball drop seismic signals can be explored. To begin, consider the mechanical sequence of the ball drop (Fig. 2) and corresponding pressure responses (Fig. 1. again relative timing could be used to identify the mechanical source if synchronized with the seismic data). At time 2, the impact or kinetic energy of the ball seating is a potential source of the ball drop seismic signals, in addition to the corresponding ‘water hammer’ effect (pressure pulse from the sudden hydraulic blockage). Once the ball is seated, the potential energy drop associated with the dissipation of the back pressure increase as the sleeve is pushed open, is another possible seismic source. Once the fracport is open, there is also a potentially for another ‘water hammer’ effect which could lead to a seismic source at the packer(s). Conceivably if the packer is not well coupled and susceptible to slip, this could also be a potential seismic source. Ideally the rock will fracture before the packer slips, although the stability of the packer is potentially an issue to be considered especially when interpreting completion performance as discussed later. While the packer slip could result in many of the source attributes described above, critically the source locations (Fig. 6) presented here are not consistent with the packer. Therefore, subsequent discussions will focus just on the ball seating and the sleeve opening as potential mechanisms. Keep in mind the differences between these two scenarios maybe considered somewhat minor, being in the same location and similar timing. However, the difference can be important in implications to the completion performance: can we use the signals to diagnose if (or where) the ball seated or if the associated sleeve opened.
The ball seating could result in a repeating seismic signal, if the ball ‘bounces’ during the seating period. However, with the fluid column momentum the ‘bounces’ would be greatly attenuated and unlikely to be as nearly energetic as the initial impact. The impact of the ball in the seat would be an energetic source, but would tend to be a rapid, high frequency source. Also consider the energy implied by the seismic strength. Estimated kinetic energy of the ball would be about 10J, significantly lower than the source energy estimated from magnitude computed for the ball drop events (approximately magnitude -1.5 or an energy of about 250J). A related phenomenon is the potential energetic ‘water hammer’ that would follow: a pressure wave in the fluid column that reflects between the ends of the fluid column (i.e. between the frac equipment and ball seat). Reflections of the pressure wave at the seat (i.e. the water hammer) could result in an axial force, and multiple reflections could be associated with the multiple observed signals. However, the time interval for this length of fluid column would be of the order of a few seconds and much longer than observed between the observed multiple signals.
An alternate mechanism is the sleeve sliding open, which is believed to be the source. As shown in Fig. 1 there is a back pressure increase that ultimately pushes open the sleeves. Stick-slip motion of the sleeves could account for the multiple signals and the low frequency could be related to relatively slow movement of the sleeves. In terms of the system energy, potential energy associated with the back pressure build up could be approximately 10kJ consistent with the observed source energy discussed above. Therefore, the sleeve sliding appears to be the only source that is consistent with the observed signals characteristics. Through the subsequent discussions, the observation of a ball drop signal will be interpreted as a successful opening of the sleeve.
Examples of Diagnostic Applications
In this section, various examples are presented to highlight the application of using the treatment data, microseismicity and ball drop events as integrated diagnostics of the completion performance.
Cardium Sands Case Study
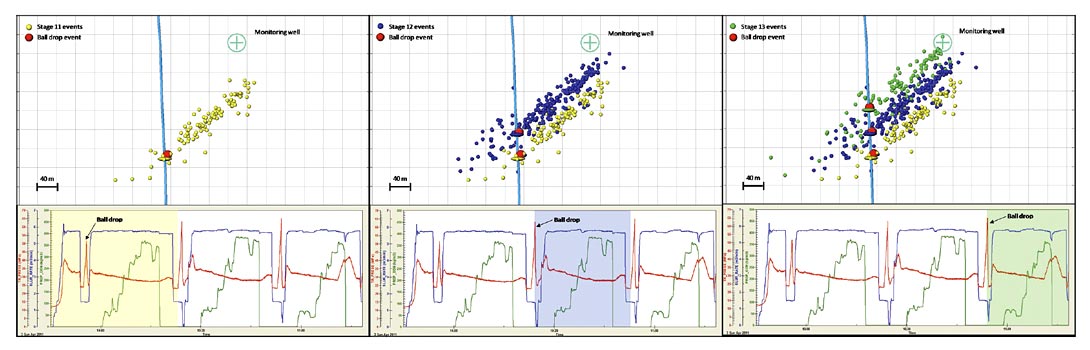
In this example, a multi-stage hydraulic fracture in the Cardium Sands in Alberta was monitored. Figure 9 shows the progression of three stages in the project. Note that with each stage, a ball drop event was observed and in each case was located at the fracport. The subsequent microseismic data shows an approximately NE-SW narrow trend, consistent with a relatively simple planar fracture aligned with the corresponding fracport. During the second and third of these stages, a few events are located within the microseismic region from the previous stage, which is attributed to relaxation processes and continuing but diminishing microseismic activity continuing after the previous stage. This effect is common in any microseismic project, where postinjection activity typically decays with time. In the case of these mechanical completions, the limited amount of time between stages means that often during the time period of pumping a new stage there is also remnant activity continuing in the previous. Nevertheless, the ball drop events confirm the opening of the appropriate port in each stage and microseismic activity centered on each open port as expected. As such this example can be considered a successful operation of the completion.
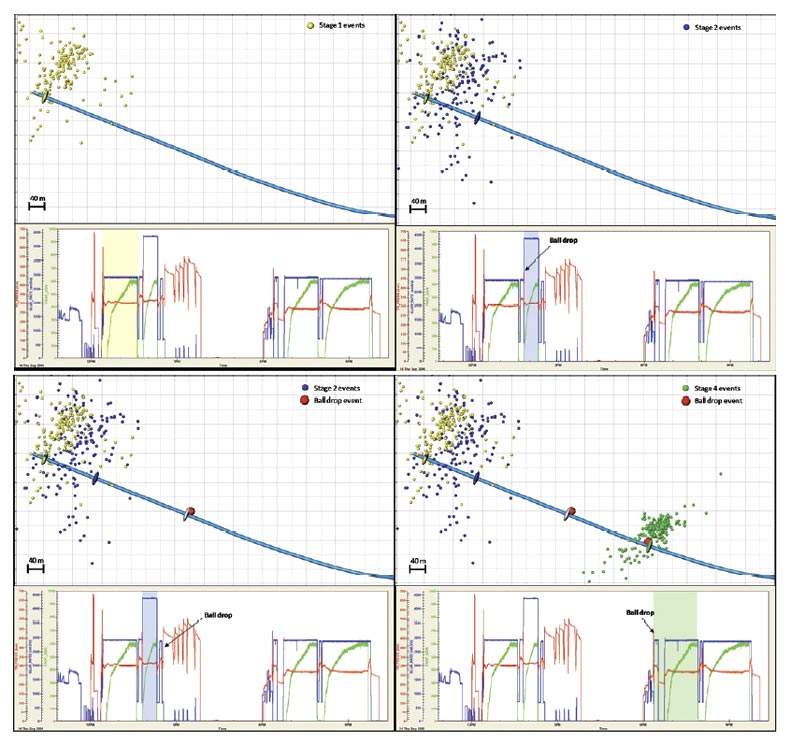
Montney Case Study Figure 10 shows the results of a multi-stage fracture in the Montney shale in NE BC. As shown in the figure, the first stage resulted in the expected microseismicity around the fracport. However, a few events recorded in this first stage also locate near the second fracport. A ball drop event was detected during the opening of the stage 2 fracport, and the resulting microseismicity overlapped somewhat with stage 1. The apparent lack of stage isolation could be related to leakage around the packer, although could also be related to hydraulic fracture connection in a fracture network near the wellbore. At the start of stage 3 a ball drop event was observed at the appropriate fracport, although no significant rate could be achieved. The ball drop seismic signal is not as large amplitude and does not have significant, repeating signals as seen for the previous stage. The pressure record indicates high pressures for several minutes during attempts to initiate the hydraulic fracture, although no microseismicity was detected which could indicate fracture initiation. The occurrence of the ball drop event suggests that the fracport opened; although possibly it was either blocked or did not fully open. Alternatively, the formation may not have broken down. Eventually, the stage was abandoned. At the start of the last two stages (note only stage 4 is shown in Figure 10), a ball drop event was again observed at the next port and the microseismic for both these stages were concentrated in the intended positions showing that these fracports operated properly. This case provides an example of poor isolation during the first two stages, as well as failure for one of the fracports to properly open.
Cardium Case Study 2
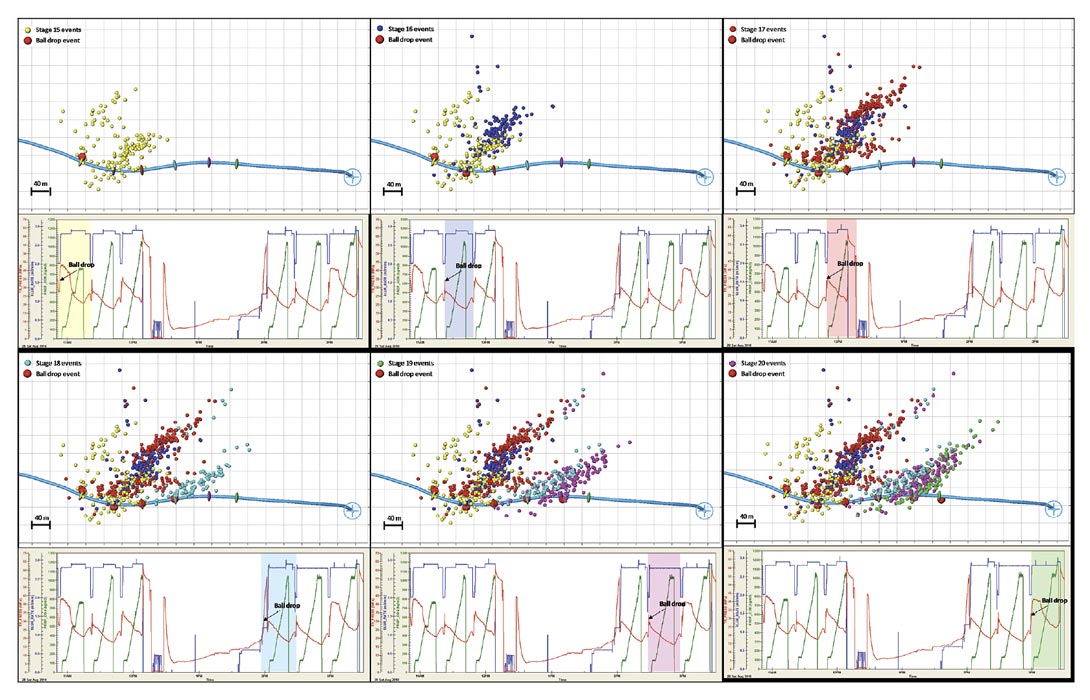
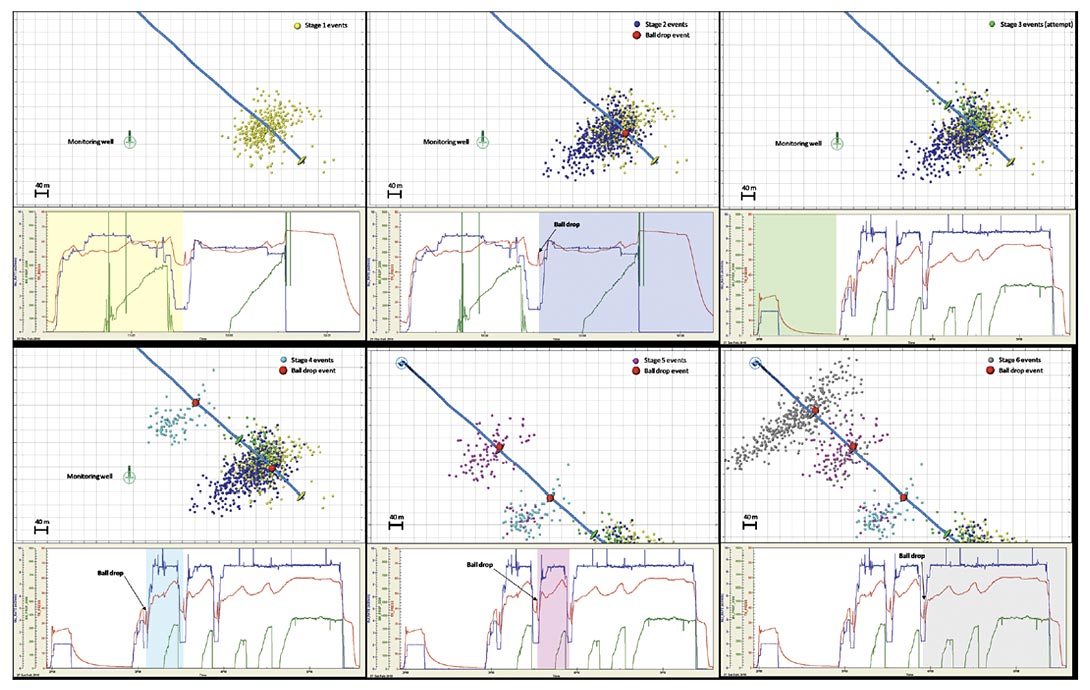
In this second example of a multi-stage fracture in the Cardium sands, Figure 11 shows the progression of six stages. For each, ball drop events are observed at the correct fracport suggesting that each frac port opened properly. The first stage (note numbering just refers to stages examined here) shows a number of events in a NE-SW direction aligned with the first fracport, but a second set also aligned where the next port. This may again be an indication of not achieving hydraulic isolation between the two fracports. However, there are a number of microseismic events approximately parallel to the wellbore (from the yellow to the blue shaded port). The second and third stage predominantly extends the cluster aligned with the second fracport (red). With each stage there are further events parallel to the treatment well but progressively locating further to the north. There is also some NE extension of the smaller cluster aligned with the first fracport occurs during both of the two later stages. At the end of the third stage there is an apparent screen-out and an associated delay prior to the fourth stage. The fourth stage grows in an ENE direction and the next two stages primarily involve similar NE clustering, with each subsequent stage concentrating further to the east so as to widen the stage 4 NE cluster. Apparently, in contrast to the NE lineation from the first three stages where the single, main cluster progressively lengthened with each stage, the subsequent NE cluster from the next three stages progressively widened.
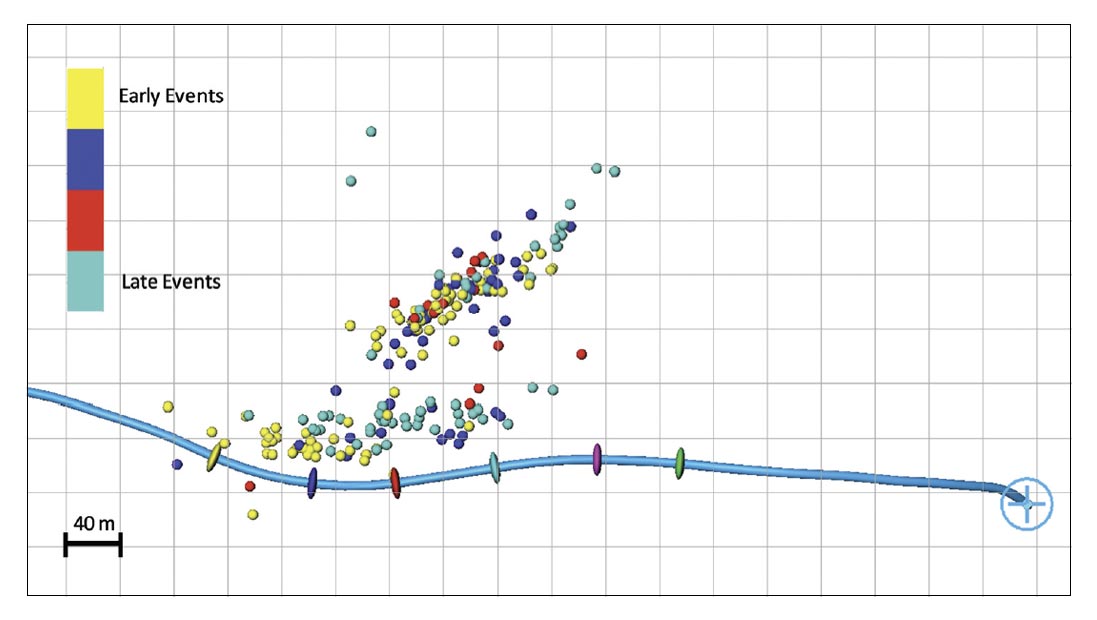
In this example, it appears that there was a fracture zone approximately parallel to the well that resulted in interaction between neighbouring frac stages. This is illustrated with Figure 12 that shows the events from the 3rd stage color coded by time. The earliest events locate between the first three fracports and also result in NE extension of the primary cluster. While there are no early events coincident with the well which might indicate poor hydraulic isolation with the packers, the event clusters that run parallel to the well are clearly offset and grow towards the north with time suggesting that the communication is within a fracture network. Frac stages 1 to 3 resulted in one primary NE fracture while stages 4 to 6 resulted in a second parallel fracture. The position of these two predominant fractures may be related to the presence of a preexisting fracture in these positions, or could potentially be related to a stress shadowing effect between the two NE fractures. This case study serves as an example where the fracports operated as expected, but where a fracture network along the well resulted in overlapping, poorly isolated stages.
Rock Creek Case Study
In this example, a six stage frac was performed in the Rock Creek sand, in Central Alberta. Figure 13 shows the microseismic and pumping data for the six frac stages. Stage 1 microseismic events concentrated away from the corresponding fracport, with the activity instead clustered around the stage 2 fracport. The growth of the hydraulic fracture at such a large distance along the well and past the packer separating these ports, could be related either to a fluid flow around the packer or possibly a partially opened fracport in the position of the second stage. A ball drop event was recorded at the Stage 2 fracport and the subsequent frac stage resulted in overlapping microseismic events with stage 1, highlighting poor hydraulic isolation between these first two stages. No ball drop event was observed with stage 3 and the majority of the corresponding microseismic events again overlapped with the microseismicity with the first two stages. Note the characteristic pressure spike was also not observed, so along with the lack of a ball drop event and microseismic locations suggests that the port did not open. After pumping for several minutes and examining the microseismic data in realtime, this stage was abandoned. Ball drop events were then recorded for the final three stages at the intended fracports, and the associated microseismicity recorded during the subsequent fracs clustered near each fracport. In each stage, there were a small number of microseisms locating within the cluster of the previous stages which were attributed to remnant activity as the previous hydraulic fracture continued to equilibrate. A larger total volume was pumped in the final stage and resulted in a longer hydraulic fracture as seen in Fig. 13. This case study is an example of poor hydraulic isolation during the first two stages, followed by failure to open the intended fracport during the third stage. The final three stages resulted in successful operation of the mechanical completion with intended hydraulic isolation. Realtime microseismic monitoring of the frac was performed, and allowed the operator to realize the poor hydraulic isolation and failure to open the fracport during the operation. Microseismic was the key information used to decide to abandon the failed stage 3. Obviously one advantage of access to information about the success of the completion operation during the frac is to enable modification to the fracture program to avoid for example potential screen-outs. However, the information could also potentially be used to target remedial operations on the completion in an attempt to get the completion to function as intended.
Conclusions
Characteristic seismic signals are often observed at approximately the time of balls being dropped into mechanical, multifracport completions. The signals are high amplitude, low frequency, repeating, complex pulses with p/sh amplitude ratios consistent with an axial displacement type source. The signals tend to locate near the fracport, and partially based on the implied source energy are believed to be related to the sleeves sliding to open the fracports. As such, the observation of the signals provides a diagnostic that the operation successfully opened the fracport and along with treatment and microseismic data can be used to interpret the proper operation of the completion. Case studies shown here provide examples of proper completion performance with isolated stages in the intended interval, fracports that failed to open, and poor hydraulic isolation between stages associated with either packers not provided hydraulic isolation along the well or possibly hydraulic fracture networks in the reservoir along the wellbore. One case study also highlights the ability to use this integrated information in realtime to make on-the-fly operational decisions based on diagnosing the completion operation. Ultimately realtime microseismic information could also be used to reattempt intended mechanical actions of the completion, if the operation is not successful.

Related Reading


Join the Conversation
Interested in starting, or contributing to a conversation about an article or issue of the RECORDER? Join our CSEG LinkedIn Group.
Share This Article