Understanding the subsurface and finding something valuable in it are the key roles of an exploration geophysicist. It’s an exciting search and one that is continually improving. Many energy companies, contractors, government labs, and universities are active in the research and development efforts that give rise to these advancements.
The applied geophysics group in the Department of Earth and Atmospheric Sciences at UH includes colleagues: Drs. John Castagna, Leon Thomsen, Fred Hilterman, Edip Baysal, Evgeny Chesnokov, Pete Emmet, Yingcai Zheng, Aibing Li, Peter Bartok, and Hua-wei Zhou. Geophysical strengths of the Department include: rock physics, microseismic analysis, borehole geophysics, seismic signal processing, seismic imaging, and geophysical interpretation. The Department has a full undergraduate program (with about 100 geophysics majors) along with course- and thesis-based M.S. degrees in geophysics. An industry-oriented Professional M.S. program in geophysics has also been quite popular. The active Ph.D. program garners considerable industry support and has active ties to the Society of Exploration Geophysicists and Geophysical Society of Houston (which has collaborative links to the Canadian Society of Exploration Geophysicists). There are some 140 graduate students in geophysics. Several courses specifically related to shales and other unconventional resources are taught in the graduate program.
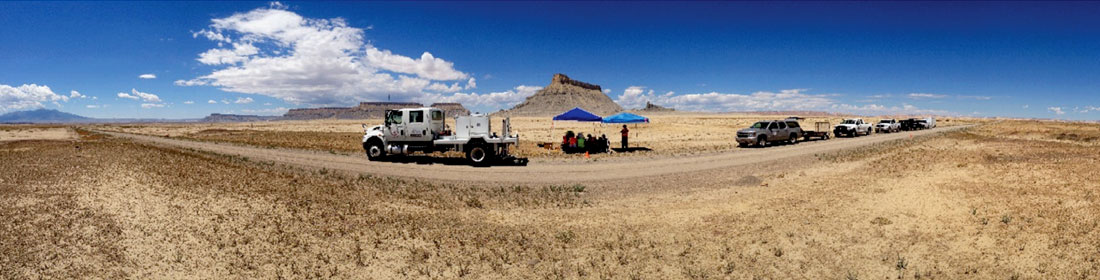
At the Allied Geophysical Labs (AGL), in the Department of Earth and Atmospheric Sciences at the University of Houston (UH), we are Exploration geophysics at the University of Houston: The shale trail and other unconventional voyages Robert R. Stewart, Fabiola Ruiz, Julia Wellner, Nikolay Dyaur, and Long Huang DEPARTMENT OF EARTH AND ATMOSPHERIC SCIENCES, UNIVERSITY OF HOUSTON working on a range of topics in which we aspire to make substantial changes in the world of unconventional resources. AGL has a physical modeling laboratory with three ultrasonic surveying systems (benchtop, large “marine” tank, and rock physics apparatus). In addition, AGL maintains a full seismic acquisition system with an IVI vibroseis truck (Figure 1), 240-channel Geometrics recording system, 120 GSR autonomous nodes, plus an assortment of vertical and 3C geophones. We also undertake VSP and well logging surveys at various sites, including our Geophysical Test Site at La Marque south of Houston, as well as marine surveys with sonar and boomer sources in nearby Galveston and Kemah.
In our geophysical research, we often start work with an idea and then test it numerically and in the physical modeling lab. We’ve been particularly interested in the effect of cracks and fractures and their saturation on elastic wave propagation. We use our physical models and waves propagating in them to teach us about what to look for in the field. As part of the lab effort, we have been building laser-fractured (Stewart et al., 2013) and 3D-printed models of reservoirs. We then conduct scaled ultrasonic surveying of them. Heading out from the lab, we’ll undertake field studies, with our own surface and borehole equipment, as well as with data from industrial sources. We’ve been focusing on full-wave (multicomponent) seismic studies and VSP, especially in unconventional plays. The goal is to find attributes, largely from 3C-3D and borehole seismic data, that describe some aspect of shales or oilsands that assist with hydrocarbon discovery or recovery.
While the winds of the shale gale may have calmed along with the jet-stream exuberance attached to other unconventional resources, there remains plenty of research to do. As mentioned above, our AGL research has spanned lab measurements, theoretical developments, borehole geophysical results, and surface seismic investigations. We highlight some of these areas below.
Ultrasonic lab measurements
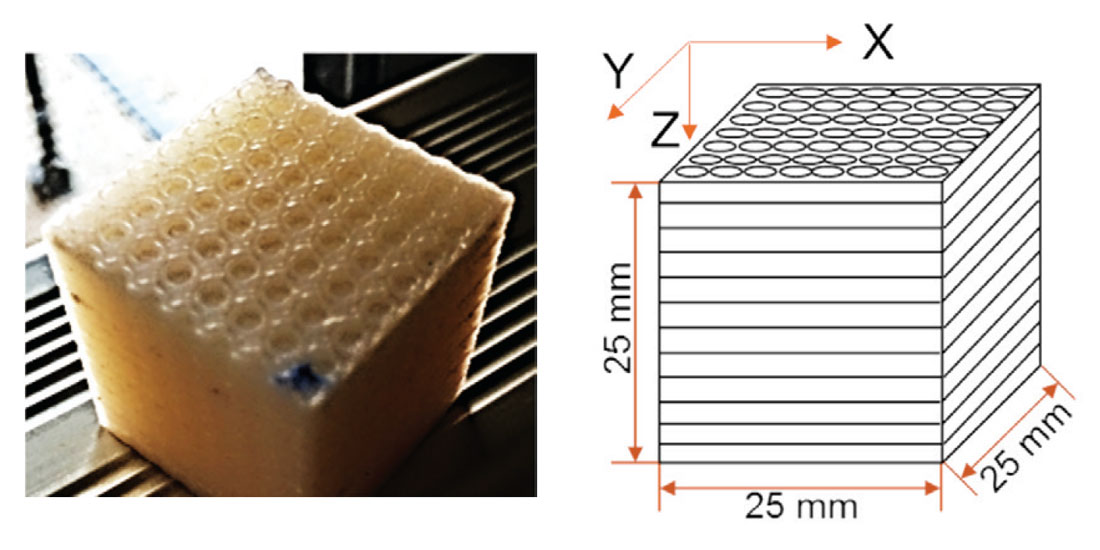
We have undertaken a series of experiments in our ultrasonic lab to attempt to measure the effects of cracked, anisotropic domains. In addition, we are analyzing the effects of different fluid saturations on P and S-wave velocities. Huang et al. (2015) derived equations for fluid substitution for fractured rocks combining the anisotropic Gassmann equations and linear slip theory. To test the equations, we have made experiments on physical models which are created by a 3D printer (Stratasys Dimension SST 768). Via the near-magic of additive manufacturing (3D printing), we can now make an actual penny-shaped crack model (Figure 2). The input printing material was ABS thermoplastic with a density of 1.04 g/cc, a P-wave velocity of 2179 m/s and a shear-wave velocity of 887 m/s. The cracked model, gave a density of 0.79 g/cc and a porosity of about 24%. This model was close to VTI symmetry with a P-wave velocity of 1438 m/s parallel to symmetry direction and 1638 m/s in the bedding plane. The fast and slow S-wave velocities were 825 m/s and 665 m/s respectively. A fluid substitution experiment was performed with water and an increase (26% to 38%) in P-wave velocities and a decrease (4% to 10%) in S-wave velocities are observed. Compared to the predictions from the derived equations, the measurements were about 2% higher. As Gassmann’s theory is derived for low-frequency velocities, our ultrasonic measurements might be expected to be slightly higher. The 3D printed material has interesting properties and is an exciting new material for seismic physical modeling and a host of other applications.
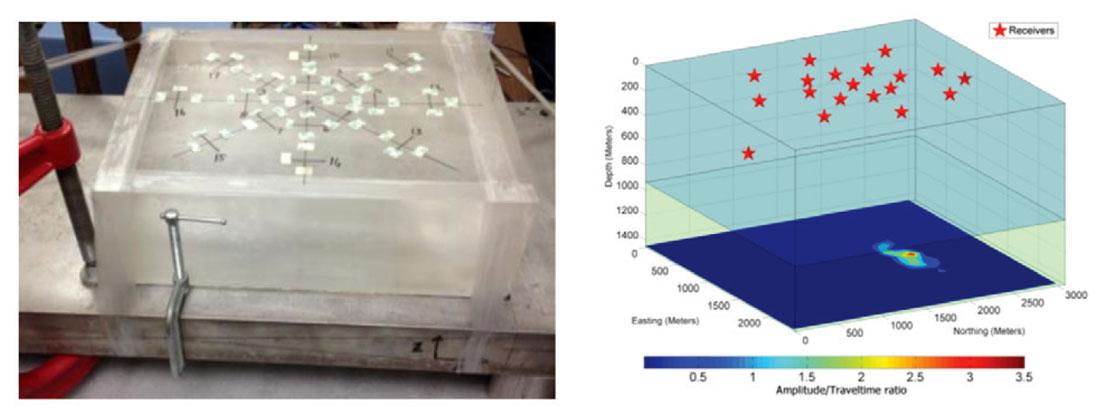
We are conducting other experiments with various models and geometries. One interesting set of tests involves placing an oriented ultrasonic source on the bottom of the physical model, with receivers on the surface - to treat the source as a microseismic (hydraulic fracture) event. The event location and its source parameters are then estimated using a variety of inversion and migration techniques (Figure 3).
Eagle Ford shale study
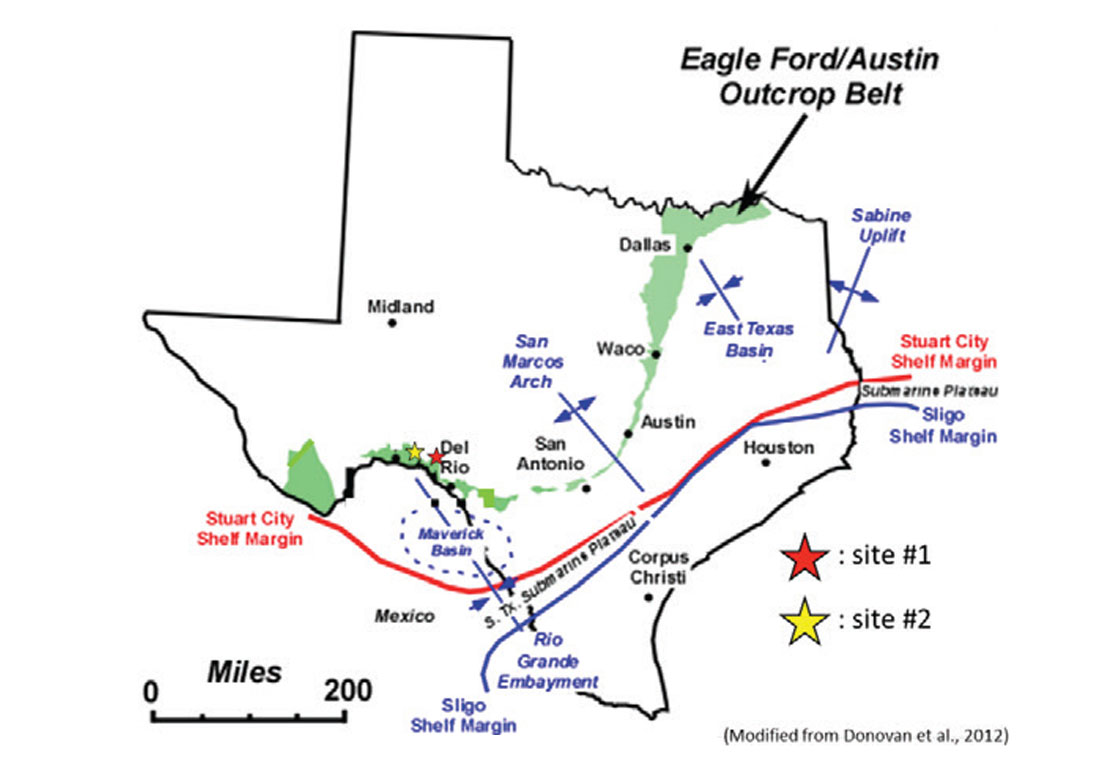
Moving to the field and a site to the west of UH (Figure 4), the Eagle Ford shale has become a prolific hydrocarbon producer (1.7 Million bopd - EIA, 2015) and subject of intense economic and geoscientific interest. Fortunately, this mixed siliciclastic/carbonate Mid-to-Late Cretaceous marine shale outcrops in a swath across Texas providing a unique opportunity for its investigation.
We have undertaken seismic and GPR surveys, along with the collection of rock samples, in the Del Rio area of south-west Texas (Figure 5).
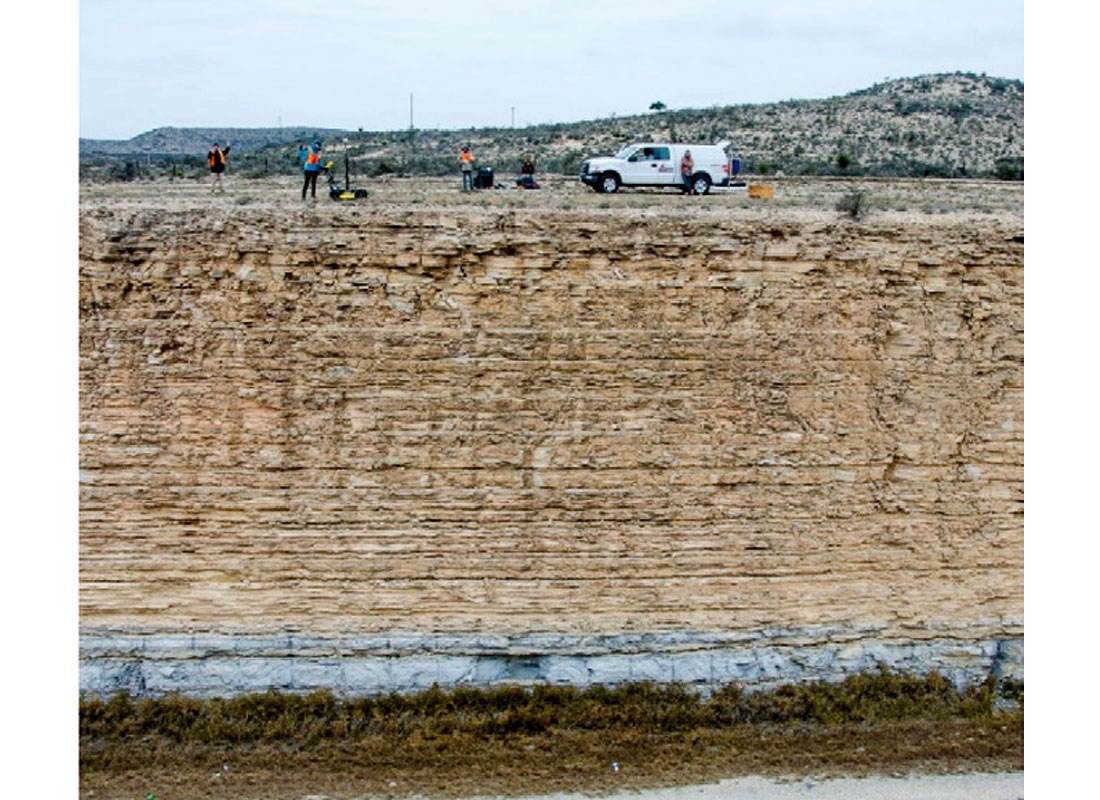
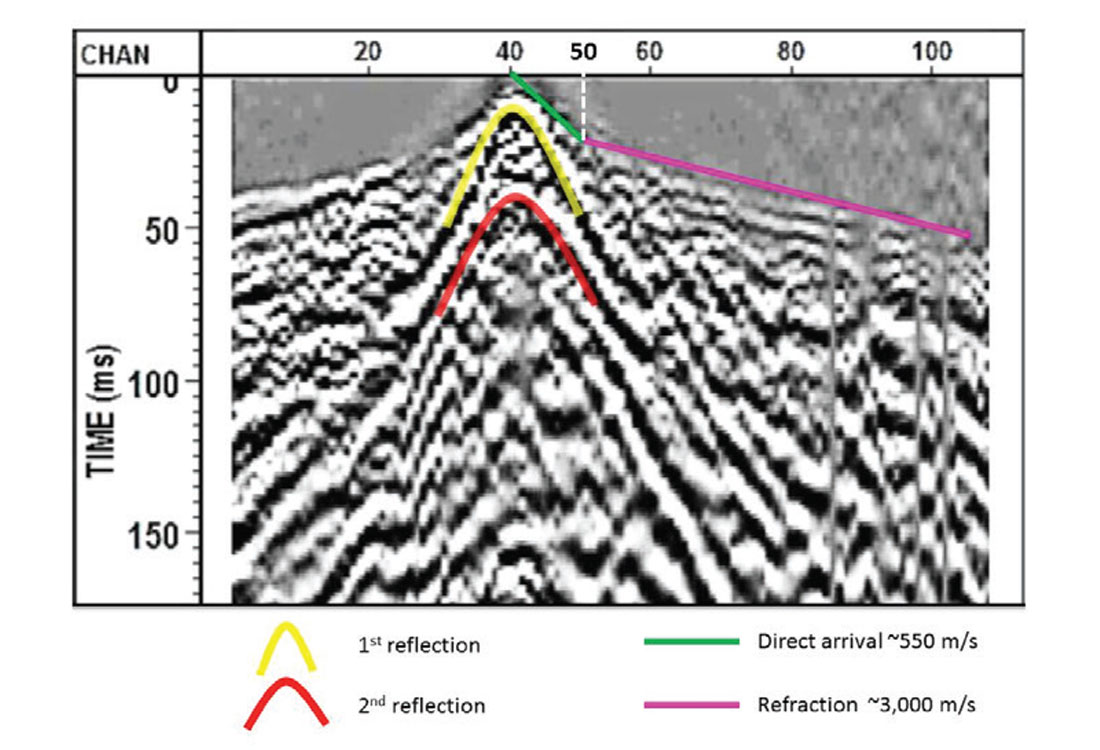
Raw seismic data (Figure 6) acquired on top of the exposure shown in Figure 5 reveal a high-velocity (~3,000 m/s) refractor at 8 m depth which corresponds to the gray carbonate- shale visible at the bottom of the photo.
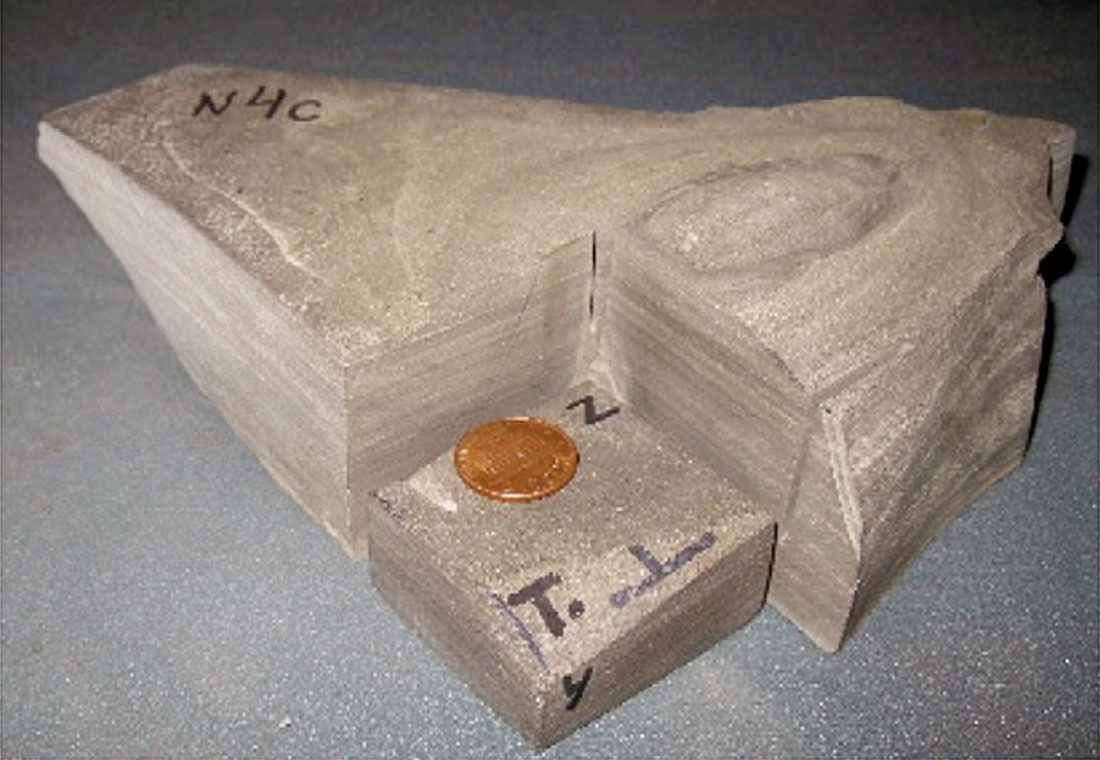
We also collected hand samples of the Eagle Ford shale (Figure 7) and measured their ultrasonic velocities upon return to the lab. Vp parallel to bedding is 3.94 km/s and normal to bedding is 3.11 km/s (with errors of ± 0.02 km/s). Vs parallel to bedding (in two directions) is Vs1 = 2.34 km/s with Vs2 = 2.03 km/s. Normal to bedding has lower values (Vs1 = 2.01 km/s, while Vs2 = 2.00 km/s, with errors of about 0.01 km/s). Substantial anisotropy is in evidence.
3D survey design
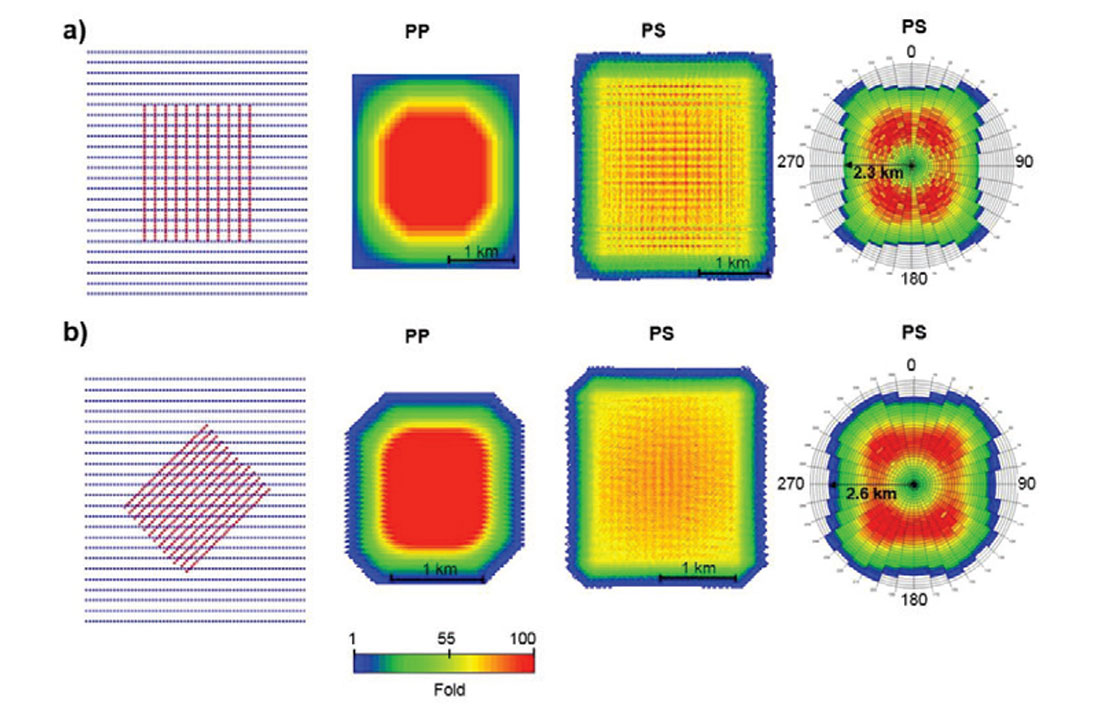
The success of many 3C-3D seismic surveys will depend significantly on how the survey was designed. To this end, we have been investigating many different designs for unconventional targets that include the effects of shot-receiver line orientation and pattern, line stagger (periodic shifting), and shot and receiver intervals. While the standard orthogonal patterns are often very good, slanted geometries can have some advantages, especially in their smoother offset distributions in this case (Figure 8). Use of staggered (periodically shifted) receiver lines can allow smaller bin sizes with regular fold than the receiver interval over two length. The stagger design can work well for PS waves too (Kocel, 2015).
Marcellus Shale analysis
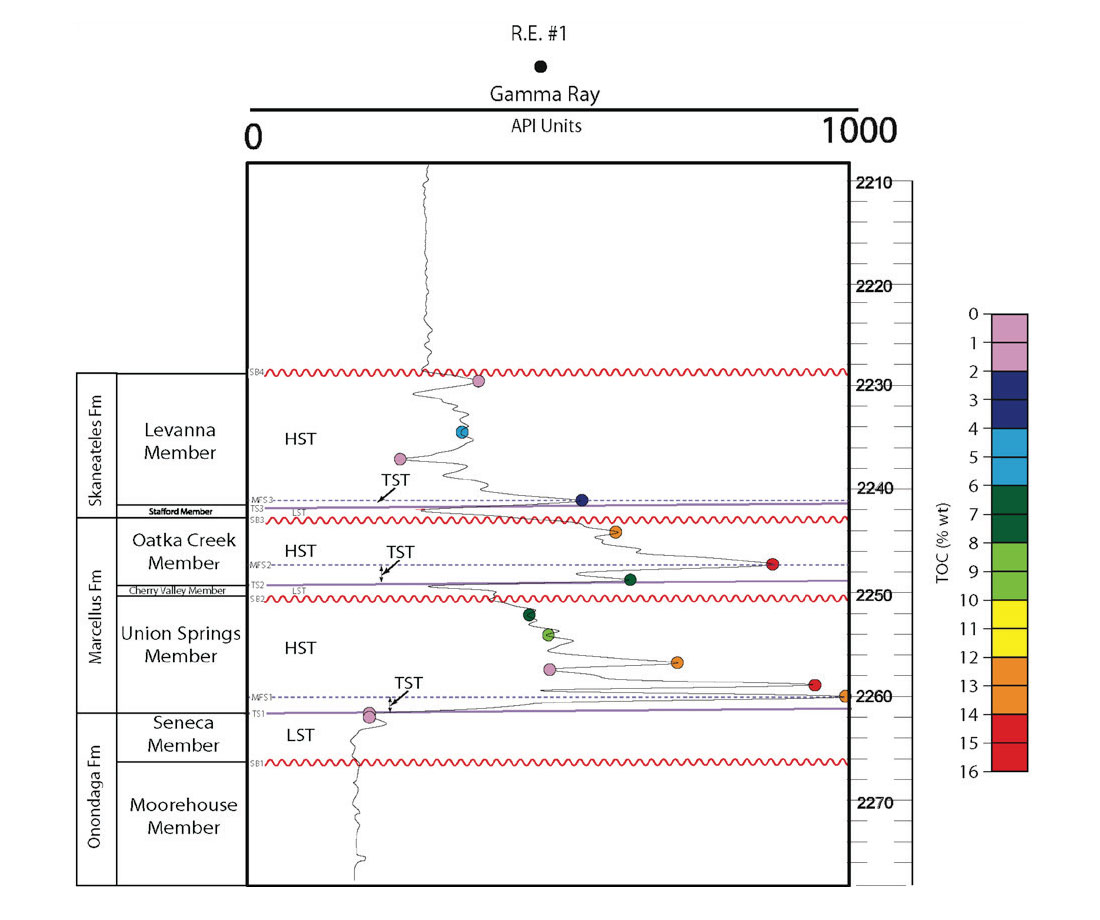
The Marcellus shale in the eastern part of the continental US has been a massive gas producer – currently at approximately 17 billion cfpd or just under 3 million boepd. Fellow UH geologists have research projects in unconventional plays including studies based on regional correlation of well logs, in a sequence stratigraphic framework, integrated with TOC measurements and XRD analysis of sidewall core samples. Students have worked most extensively in the Marcellus across Pennsylvania using data donated by Rice Energy. Using 821 wireline logs, Luker (2012) demonstrated that two individual sequences within the Marcellus were mappable over long distances. Within the Marcellus, highstand systems tracts thicken to the northeast portion of the basin, in front of the Acadian thrust front, although overall thickness of the total sequences is relatively uniform. In each sequence, the highest TOC values are found within the transgressive systems tract and the lower portion of the highstand systems tract. X-ray diffraction analysis (XRD) shows that the same horizons are enriched in quartz, calcite, and pyrite relative to other portions of the sequences. These TOC and XRD results are from a limited number of samples but indicate that the zones of high TOC are also zones of mineralogy that will enhance brittleness and thus the “fracability” of the rock. The fact that the sequences can be mapped across the basin suggests that such analysis can be done before landing a horizontal well into potentially less-productive zones. Additional work needs to look not only at additional sidewall samples from the Marcellus, but at creating a general model for applying such tools to other basins (Figure 9).
Another project involves the study of elastic attributes and rock properties from a 3D-3C seismic data set acquired in Bradford County, Pennsylvania over the Marcellus Shale. The objective is to study the rock properties of the Marcellus Shale using rock physics models, evaluate the seismic sensitivity to variations in rock properties, and use this analysis to guide the quantitative interpretation of the multicomponent seismic data.
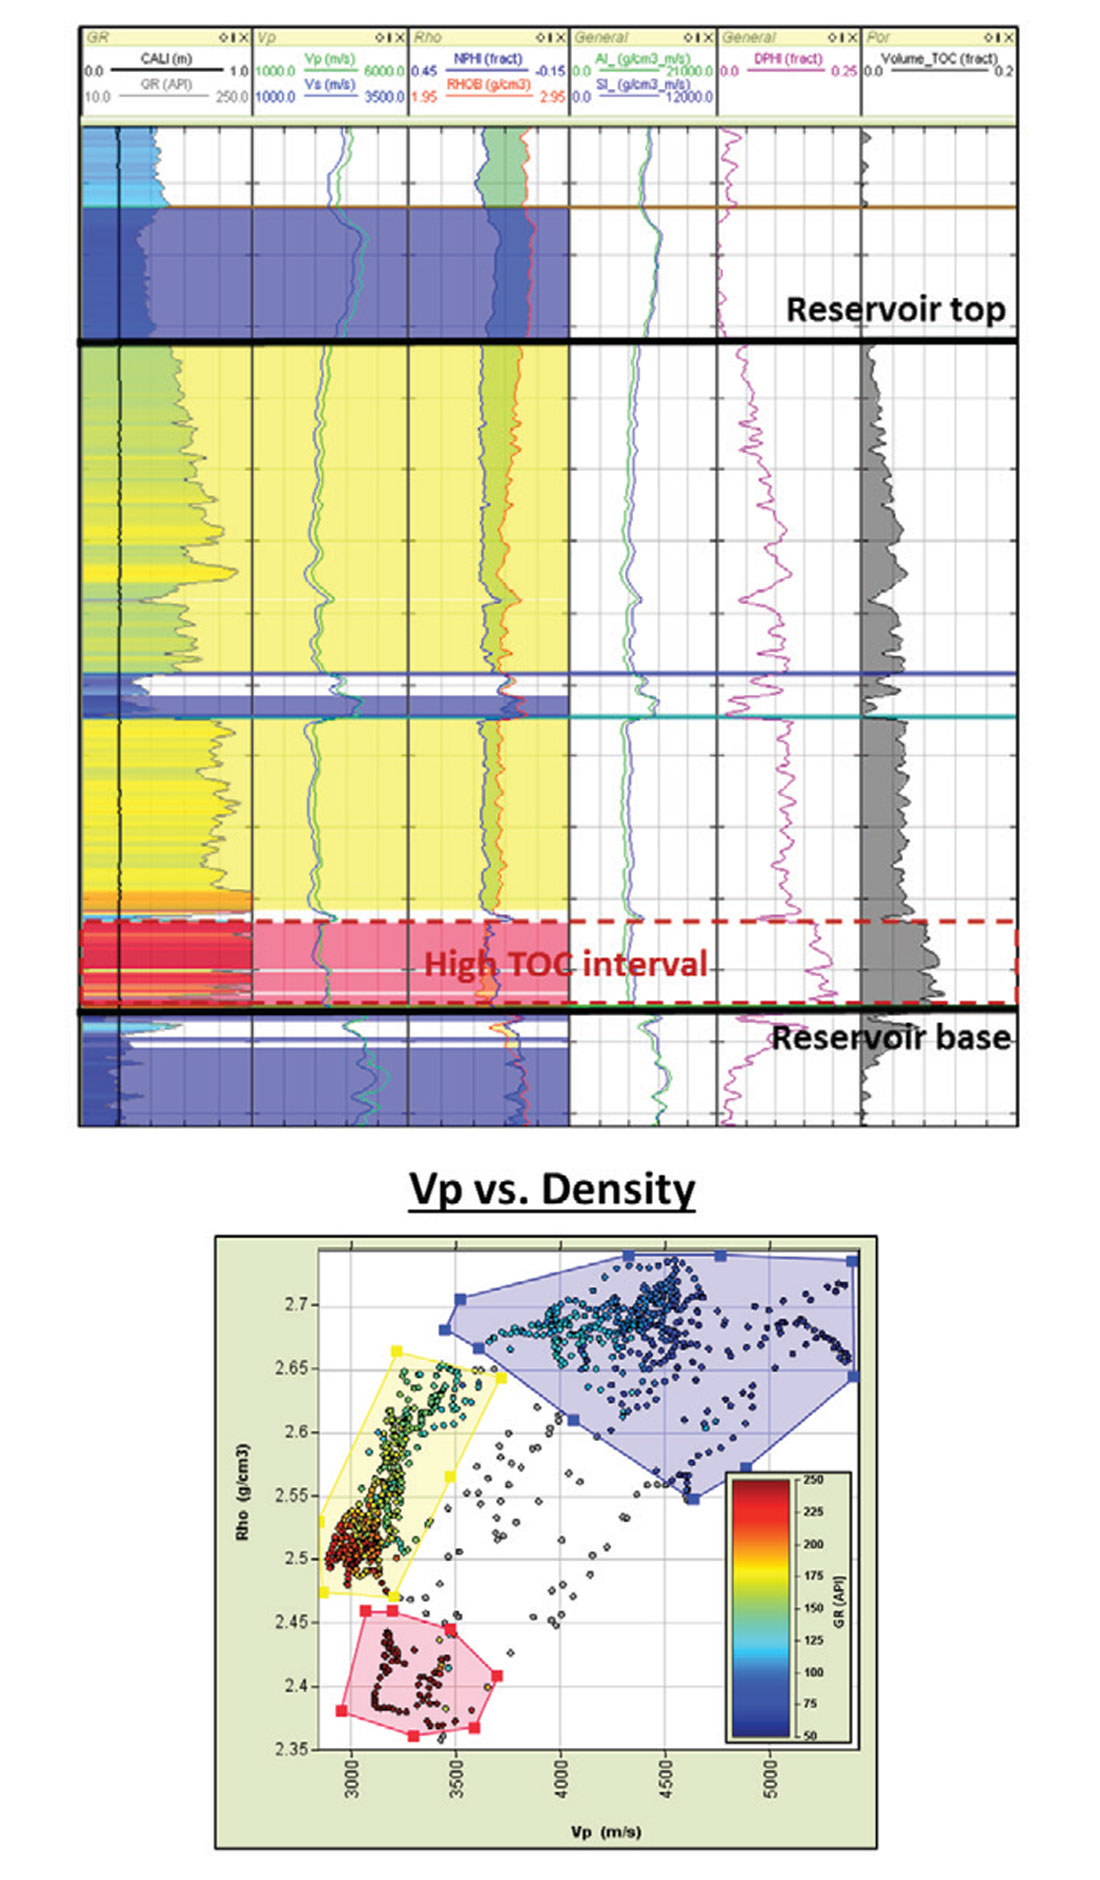
The elastic properties of organic shales are thought to be largely controlled by kerogen content, porosity, clay and other minerals, and effective pressure - kerogen being an important factor controlling the rock elasticity. Clay content is considered to be another key parameter affecting the elastic response of organic shales, as strong anisotropy can be induced due to the partial alignment of anisotropic clay minerals and the bedding-parallel lamination of the organic material. Since surface seismic measurements can have a complicated dependence on rock properties, it is essential to understand the relationship between the elastic response and variations in rock properties, to correctly assess the target reservoir. In this sense, a combination of rock physics and seismic modelling is applied to relate variations in key properties, such as kerogen content and porosity, to differences in the seismic character of a 3C-3D seismic volume in the Marcellus Shale. The study area is located in Bradford County (Pennsylvania), where the Marcellus interval can be easily identified in the Vp/Vs vs. impedance domain. However, density is the key property to consider when the goal is to locate high organic matter areas within the reservoir, as shown in the Vp vs. density crossplot in Figure 10, where the high TOC interval (enclosed by the red polygon) shows lower densities than the rest of the reservoir.
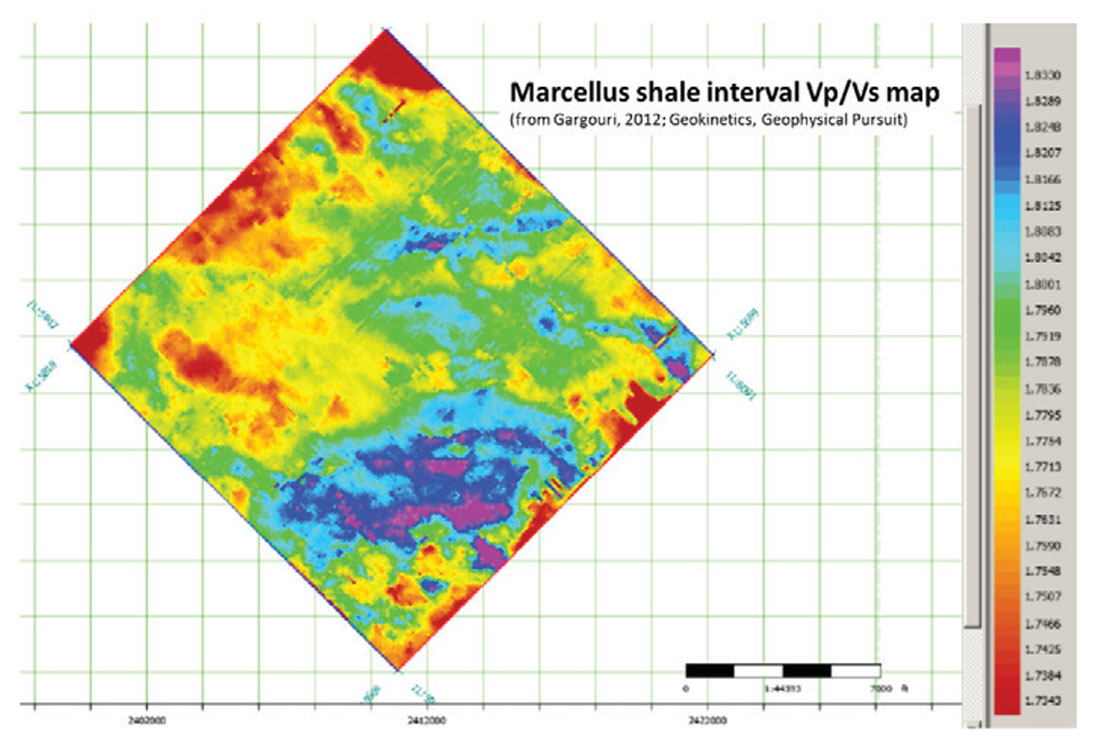
We previously (Gargouri, 2012) analyzed 3D PP and PS data via correlations and amplitude inversions to develop Vp/Vs maps. As shown in Figure 11, the map provides some tantalizing differences across the area which may be indicative of lithology and brittleness changes.
AGL is also collaborating with Hess Corp. on a very thorough set of measurements in the Bakken shale comprising with 3D seismic, 3D VSP, microseismic, well logs, and production data. The goal is to understand what geologic conditions and factors (and their geophysical expression) influence the productivity of the horizontal and hydraulically fractured wells. The US Bakken now has a remarkable production of approximately 1.3 million bopd. We are also working with Marathon on a Barnett 3D case and identifying anisotropic changes from azimuthal seismic inversions.
Multicomponent 3D time-lapse analysis – oil sands
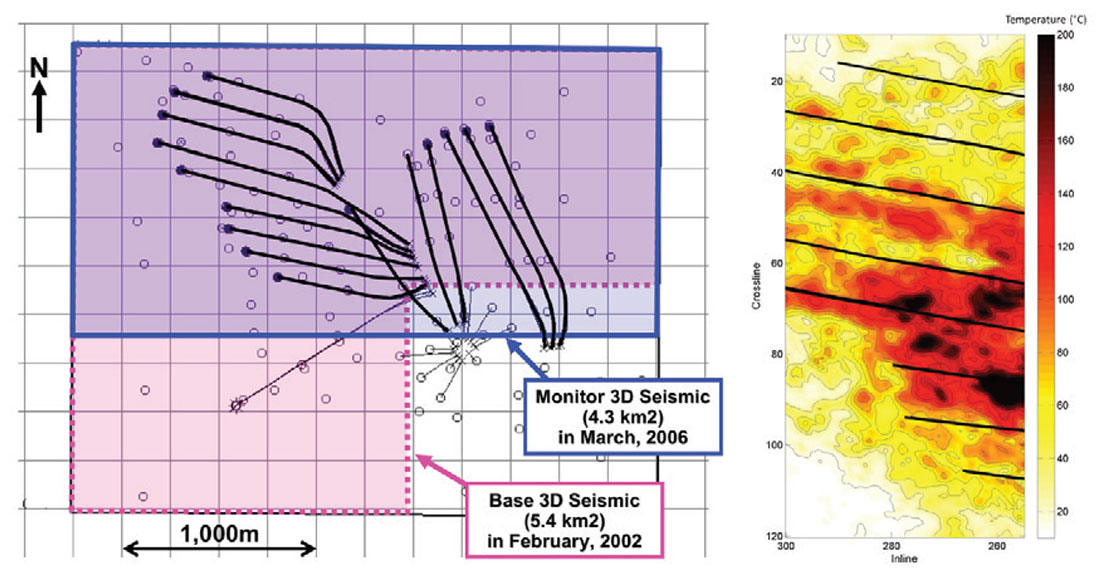
While much excellent work in geophysical analysis involves developing a picture of the architecture, lithology, and fluid content of the subsurface, there is more to be done. That is, monitoring the results of stimulation and production. Repeated or time-lapse surveys can assist with understanding and predicting future reservoir performance. In one case, from the thermally stimulated (SAGD) Hangingstone heavy oil area, repeated 3D surveys were undertaken. We processed the base (legacy) survey simultaneously with the later or monitor survey (Kato, 2011). The inversion technique basically used the AVO response of PP and PS waves, in a Bayesian formulation to infer elastic property changes. Then, using supporting measurements from the lab and logs, we mapped the elastic changes to a reservoir temperature (Figure 12).
Summary
Geophysical education and research in unconventional resources is thriving at the University of Houston – with its proximity to productive plays such as the Eagle Ford and Permian Basin, the energy industry, and professional Societies. The large and diverse undergraduate and graduate student population at UH comprises an active group. Eleven geophysics faculty, working on projects related to unconventional resources, span a wide range of capabilities and experience. With the vast potential of unconventional resources in North America and elsewhere, but now in a highly competitive price and awareness environment, there is much work to be done.

Acknowledgements
We would like to express our appreciation to the supporters of the Allied Geophysical Lab at the University of Houston. We are grateful to Geokinetics, Hess, JOGMEC, Rice Energy, and Marathon for the provision of geophysical data. Many thanks to software providers Schlumberger (GEDCO), Paradigm, and CGG (Hampson-Russell) for donation of their systems.
Related Reading


Join the Conversation
Interested in starting, or contributing to a conversation about an article or issue of the RECORDER? Join our CSEG LinkedIn Group.
Share This Article