The fast pace of drilling and completion of unconventional reservoirs in North America is challenging engineers, geoscientists and petrophysicists who have to make prompt and reasonable plans for drilling and completion strategies. One of the main issues is understanding the physical rock properties, such as clay and organic content, and mechanical properties or stress behaviour, in these often highly anisotropic reservoirs. In many cases, these parameters are selected or determined based only on well log data, and if available, a few data points from core derived from close or far offset wells. This practice continues despite the fact that, during drilling, valuable cuttings material is available; in addition, government archives store valuable cores or cuttings material from older, offset wells.
Here, we demonstrate that X-ray fluorescence (XRF) geochemistry profiling presents, if accurately calibrated, a unique opportunity to develop methods for high resolution petrophysical analysis and rock property modeling. Once calibration datasets are established for a formation, the methods can be applied to cuttings material from new wells, reducing the guesswork involved with petrophysical and completion modeling exercises. The main topics of this paper are that:
- Archived and new drill cuttings and core data are under-utilized with respect to geomechanical well profiling.
- Thoroughly calibrated XRF geochemical profiles of core and cuttings provide geological and mechanical rock properties, which can be incorporated into petrophysical completion models.
- Various mineral models exist, using algorithmic, linear and leastsquares methods to determine rock properties.
- Hardness profiling of cores support XRF derived brittleness models and allow scientists to predict the ease of hydraulic fracturing and the embedment of proppant.
- A multi-disciplinary approach and cross-methodological calibrations highlight that XRF-derived brittleness index and mechanical properties are superior to estimates based on far offset wells.
- XRF mechanical and rock property profiling can be applied to horizontal wells to identify formation issues prior to completion in order to improve successful perforation, sand placement and production.
In this study, we specifically investigated high density core profiling from the unconventional Triassic Montney Formation in Alberta, Canada. Methods and analytical analyses include geochemical and Leeb Hardness profiling, measurements of total organic content (TOC), mineralogy (X-ray diffraction), geochemistry (X-ray fluorescence), and rock mechanical analysis including Young’s Modulus (YM) and Poisson’s Ratio (PR). These were used to assess and develop the following:
- High resolution mineral and organic content profiles for the Montney Formation
- High resolution brittleness and hardness profiles
- Identification of downhole rock property complexity and physical rock property variability.
The demonstrated workflow illustrates that well-calibrated models serve as powerful tools to assess and evaluate the cuttings material of new wells, and thus obtain timely, high-resolution, accurate reservoir characteristics of vertical and horizontal wells for optimizing drilling locations, horizontal well placements and for completion stage selections. Using such an approach, geological and petrophysical parameter selection along lateral wells prior to completion is no longer guesswork.
Introduction
Petrophysical and fracturing models for unconventional reservoir rocks rely on a multitude of parameters and factors including porosity, permeability, density, mineral composition, organic content and rock mechanical properties. Here we explore the applicability of some geochemical and rock mechanical measurements to provide fast and comprehensive data for modeling input.
The analytical work relies on a recent regional exploration study of the Montney Formation in Alberta, Canada, compiled by AGAT Laboratories, and focuses on high density core profiling of the Montney Formation. The regional core data provides an unprecedented dataset for the development of robust calibrations for the most critical parameters used in petrophysical and completion program models.
Chemostratigraphy
Geochemical profiling or chemical stratigraphy (“chemostratigraphy”) is commonly used in petroleum exploration to identify similarities between units, hence correlate similar units across large distances or entire basins. Chemostratigraphy of both major elements and trace elements often provides an independent facies identification devoid of bias from visual inspections. In combination with statistical data processing, geochemical datasets can provide a powerful approach to delineating sedimentary or stratigraphic boundaries, whereas visual interpretations of such boundaries have a component of personal preference, bias, or interpretation. Here we highlight the key aspects for the application of geochemical profiling: 1) the establishment of high resolution mineralogical profiling and rock mechanical properties, and 2) the correlation of geochemical based mineral properties and distribution to high-resolution physical rock hardness profiling.
X-ray fluorescence, x-ray diffraction, and hardness
X-ray fluorescence (XRF) technology is a non-destructive analysis using energy light waves (produced by an x-ray tube) to measure the elemental compositions of a material. The x-rays or photons excite the electrons of the atoms, and transitional shell changes produce elemental specific radiations (fluorescence). The emitted energy allows the identification of the specific elements. X-ray diffraction (XRD) technology also uses energy light waves, but focused beams on the sample material allows the x-rays to diffract on the crystal lattice of each mineral phase (minerals usually have regular arrays of atoms in their crystal structures) thus identifying mineral-specific crystal diffraction patterns. Therefore, XRF allows the identification of elemental composition, while XRD allows the identification of mineral phases.
As a first step, high-resolution (i.e. 1-40 cm spacing) geochemistry (XRF), mineralogy (XRD), and hardness profiles were established and mechanical properties were evaluated. We demonstrate a strong link between XRF-XRD and the reservoir and mechanical properties of the Montney Formation. The study highlights that downhole variability in rock and petrophysical properties can be delineated by tightly calibrated XRF profiling and thus the method can be applied to drill cuttings from vertical and horizontal wells. Geochemical profiling then provides the ability to select optimal stratigraphic sections for completion targets. The in- the-field-site or 3-7 day laboratory analytical turn-around of this method provides a low cost alternative and instant rock property parameters necessary for completion modeling during the often short time period between drilling and the start of the completions program.
Formation background
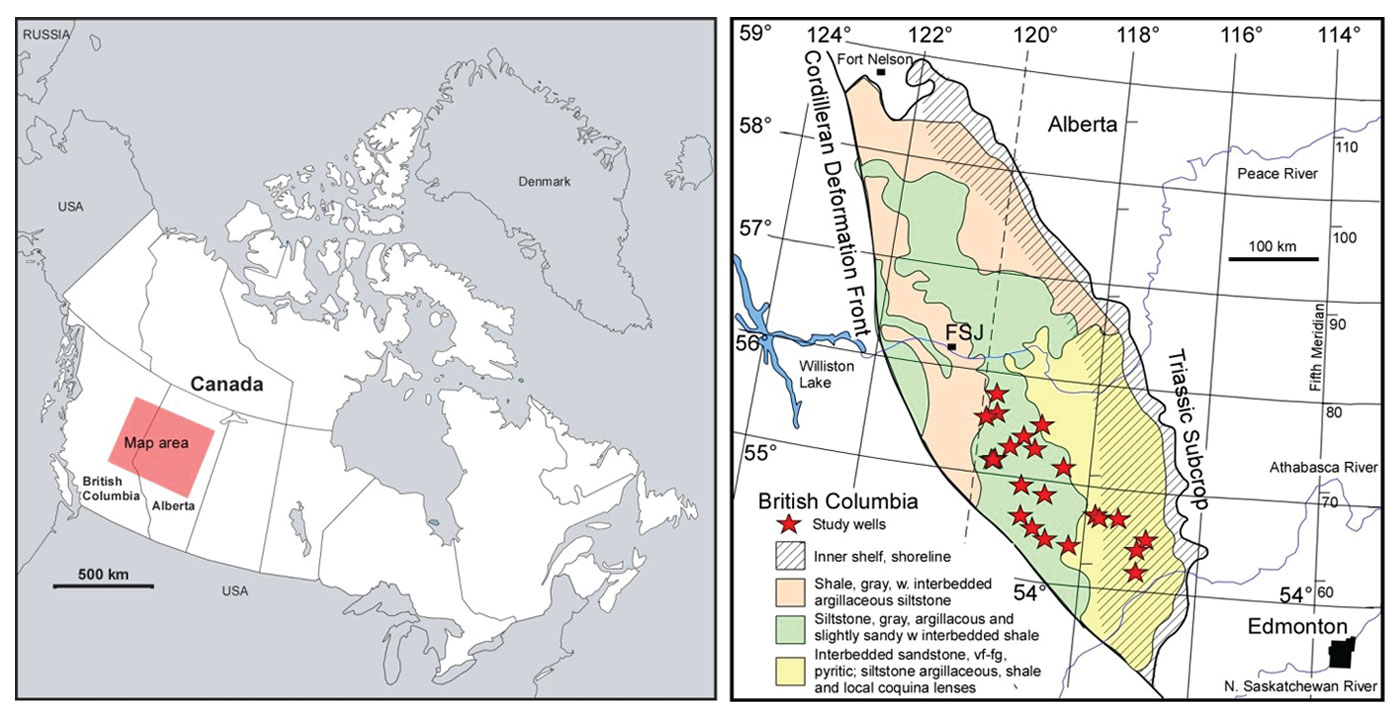
Over the last decade, the Lower Triassic Montney Formation has been a major focus of the unconventional oil/gas exploration activities in Western Canada, as it has seen production output of >3.5 billion bcf/d and estimated reserves of >440 Tcf (NEB, 2013). Most production comes from the uppermost units, which have been the focus of many research investigations (e.g. Chalmers and Bustin, 2012; Davies et al., 1997; MacFarlane and Davis, 2015). The Montney Formation of the Western Canadian Sedimentary Basin (WCSB) in Alberta and British Columbia (Fig. 1) was deposited conformably during a marine transgression onto eroded and peneplained siliciclastics and carbonate deposits of the Carboniferous and Permian (Edwards et al., 1994). The formation is generally interpreted as a sequence of interbedded siliciclastic sandstones, siltstones, and shales deposited in a shallow, clastic ramp setting that deepens to the west with deep distal fine-grained siltstones from turbiditic and mass wasting processes (Davies, 1997; Davies et al., 1997; Edwards et al., 1994; Moslow and Davies, 1997). New models for the lower stratigraphic units have been proposed, though (i.e. Wust et al., in press).
A more recent stratigraphic investigation (Crombez, 2016; Crombez et al., 2017), based on outcrop and core analysis created a 3-D stratigraphic framework of the Montney Formation and included well log patterns for the modeling. Sedimentary geometries were also divided into turbiditic deposits overlain by forced regressive shoreface units, with a combined total of six facies (tidal fine-grained sandstones/siltstones to offshore planar laminated siltstones). The study highlighted the lack of abrupt margin development involving deep marine environments.
Methodology
For this study, X-ray fluorescence (XRF), X-ray diffraction (XRD), petrography, and Leeb Hardness analyses on more than 1200 meters of core from the Montney Formation were used to build a robust model that incorporated several parameters critical for modeling fracture behavior.
For the geochemical profiling, a Bruker Tracer IV ED-XRF instrument (energy-dispersive XRF) with a Rh target and 50 kV tube and a Silicon Drift Detector (SDD, XFlash®) was used, which detects elements between Na and U. Elemental concentrations measurements along >1400 meters of core length of the Montney Formation were completed in order to obtain a regional overview of the elemental variability. Elemental concentrations were determined by analyzing both major elemental and trace elemental spectra. Data calibration is key for reliable ED-XRF data and thus high resolution geochemical profiling. More than 450 samples from various Montney cores were analyzed to establish a Montney Formation calibration. A Bruker S8 TIGER WD-XRF (wavelength-dispersive XRF) 4 kW instrument with a Rh x-ray tube, 60 kV, HighSense detectors and specialized and application-calibrated GeoQuant-M and GeoQuant-T programs (for majors and traces) were used to analyze these samples and the reference material (USGS shale standards SBC-1 and SGR-1b). All samples were ground with a W-C ring mill prior to sample preparation. For trace elemental concentrations, 7 g of sample and binding material were ground for 2 minutes, then pressed into a pellet. For major elements, loss-on-ignition (LOI) at 950°C was determined on 1.5 g of material. After LOI, 0.6 g of the material was mixed with 6 g of Li2B4O7 / LiF and heated to 1040°C in a Claisse LeNeo Fusion instrument for fused beads.
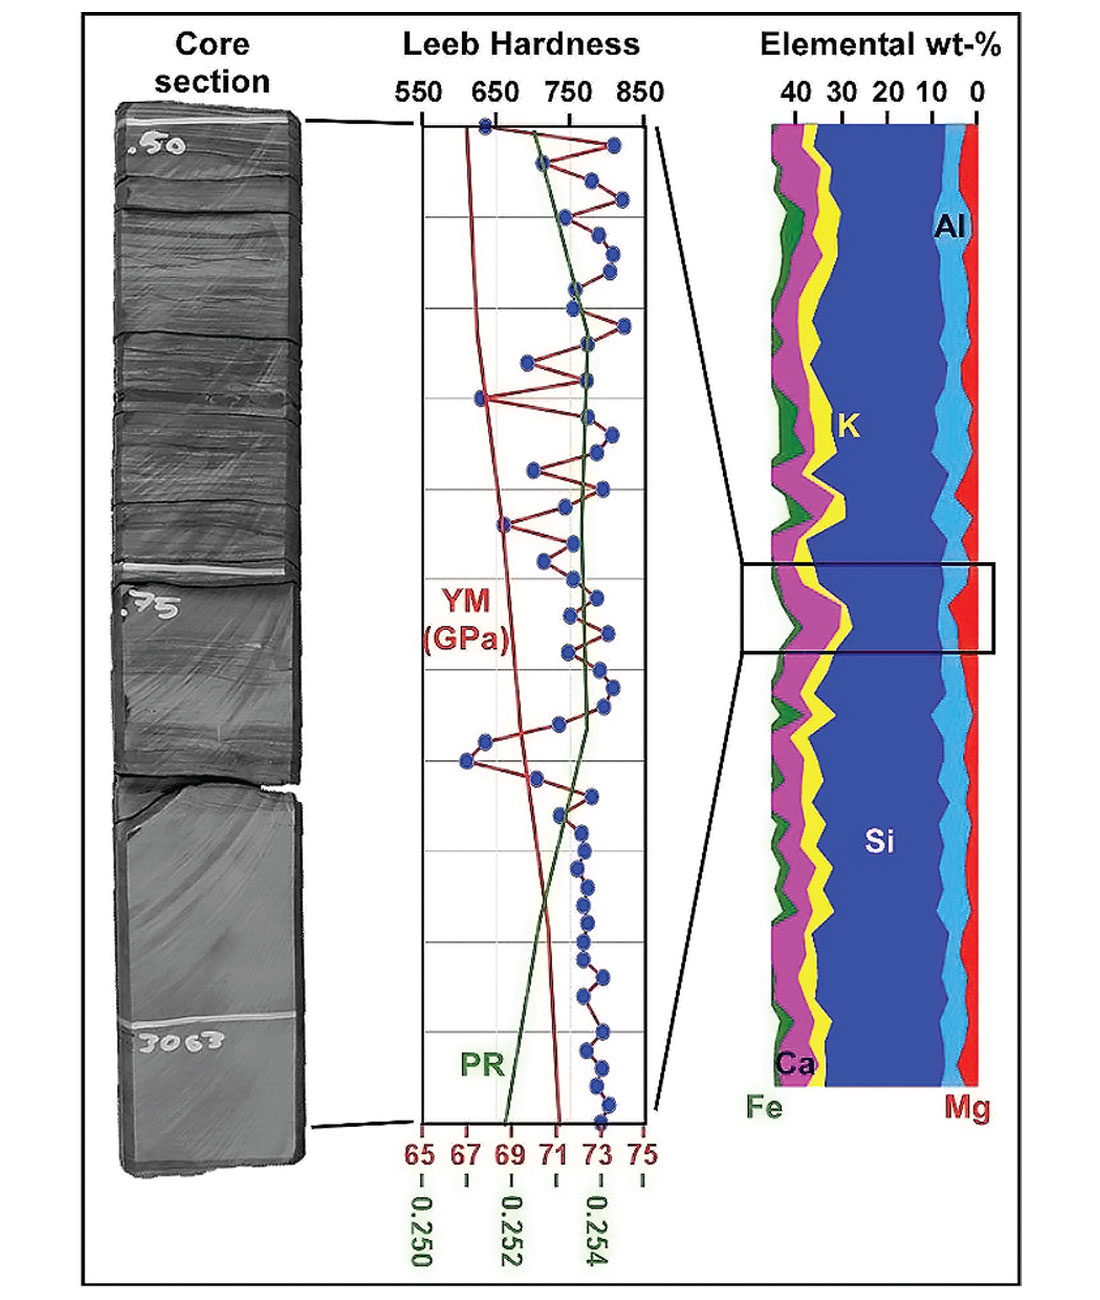
In order to better understand the mechanical properties of the Montney Formation, Leeb Hardness analyses were performed with a portable Leeb Rebound hardness instrument. Testing was carried out using a probe, which is placed on the slabbed surface of the core. A flat core surface is required to create uniform surface conditions, which allows for direct comparison between cores. Hardness is a measure of the energy lost by plastic deformation of the rock material. Figure 2 shows an example of a 50 cm core section, with the Leeb Hardness analysis (1 cm interval) and the corresponding geochemical elemental composition. Modeled Young’s Modulus (YM) and Poisson’s Ratio (PR) are superimposed.
The geochemical dataset was used to model mineral compositions in comparison with mineralogical data derived from XRD. XRD analyses were performed using a Bruker D4 Endeavor instrument equipped with a Co X-ray tube (40 kV, 40 mA) and a Lynx-Eye detector. The scan range spanned 3-70° 2Theta. The dataset included 640 XRD samples with the mineralogical quantification being completed using Rietveld modeling (Bruker Topas V. 4.2). The data was compared with petrographic and Scanning Electron Microscopy (SEM) analyses and the information compiled to represent the basis for the mineral model calibration. Petrographic analysis of the rocks illustrates often thinly bedded to laminated “silty” strata with abundant quartz, feldspar and dolomite grains. Organic material is often rare and finely dispersed throughout the samples but commonly concentrated in clay-rich laminae. In the Montney Formation, quartz often constitutes 30-50 weight-% with feldspars (20-35 wt-%), dolomite (15-35 wt-%), phyllosilicates (5-20 wt-%) and small amounts of pyrite and apatite.
Figure 3 shows an example of the process for identifying mineral phases present. X-ray diffraction identifies mineral phases that are selected and quantified from elemental composition (XRF major elements) to model mineral fraction volumes, densities and mechanical properties.
Mineral modeling
Normative mineral compositions can be modeled with several different approaches, such as the algorithmic approach or linear programming method (Figure 3). The algorithmic approach (e.g. Cohen and Ward, 1991; Rosen at al., 2004) allocates different elements or oxides to different minerals in a pre-defined routine or algorithm. The linear programming methods apply linear algebra to find a “best-fit”approximation for a sample (e.g., Caritat et al., 1994; Posch and Kurz, 2007). The algorithmic approach is heavily dependent on experience, and different algorithms are defined for specific rock types or formations, whereas the linear programming method does not require experience, as input is statistically robust.
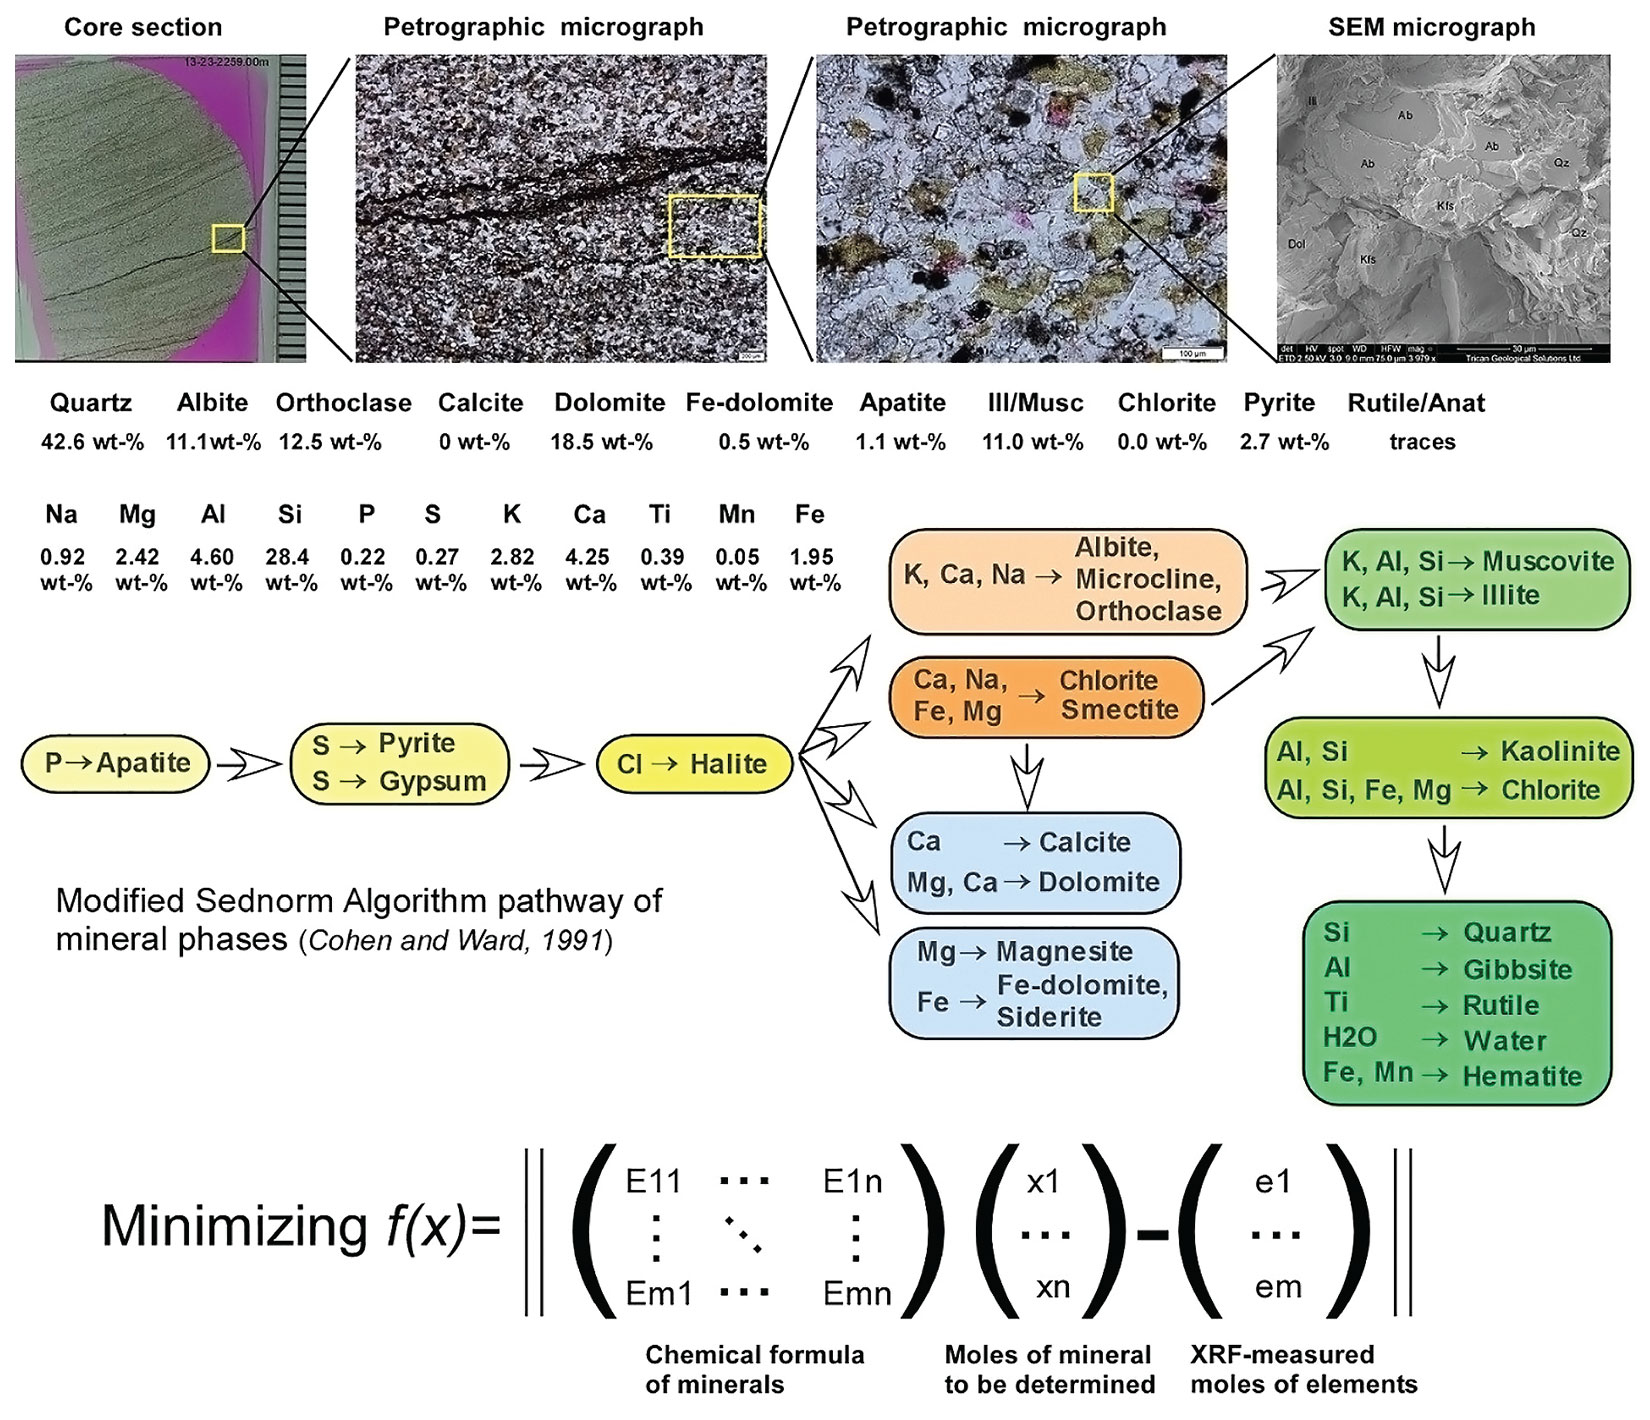
Figure 3 illustrates the algorithmic method and elemental associations, with specific mineral matter identified in the rocks of the Montney Formation. Modeling challenges exist for solid-solution mineral phases as well as for minerals with similar elemental components or compositions.
To accurately model the mineral composition, both the algorithmic and linear programming methods require a well-understood mineralogy of the target formation or the minerals to be included. In this study, both approaches are applied with four realizations: one algorithm similar to the Sednorm program (Cohen and Ward, 1991), and three linear programming realizations using different objective functions for optimizations (linear programming and linear least-squares, (e.g. Andersen et al., 2012)). With the calibration of over 100 samples of known mineralogical compositions from XRD analysis and elemental compositions from XRF analysis, the four models yield similar results, however, the least-squares approach produced slightly more robust mineral compositions in comparison with XRD data. Thus, the least-squares approach was used for further rock properties modeling.
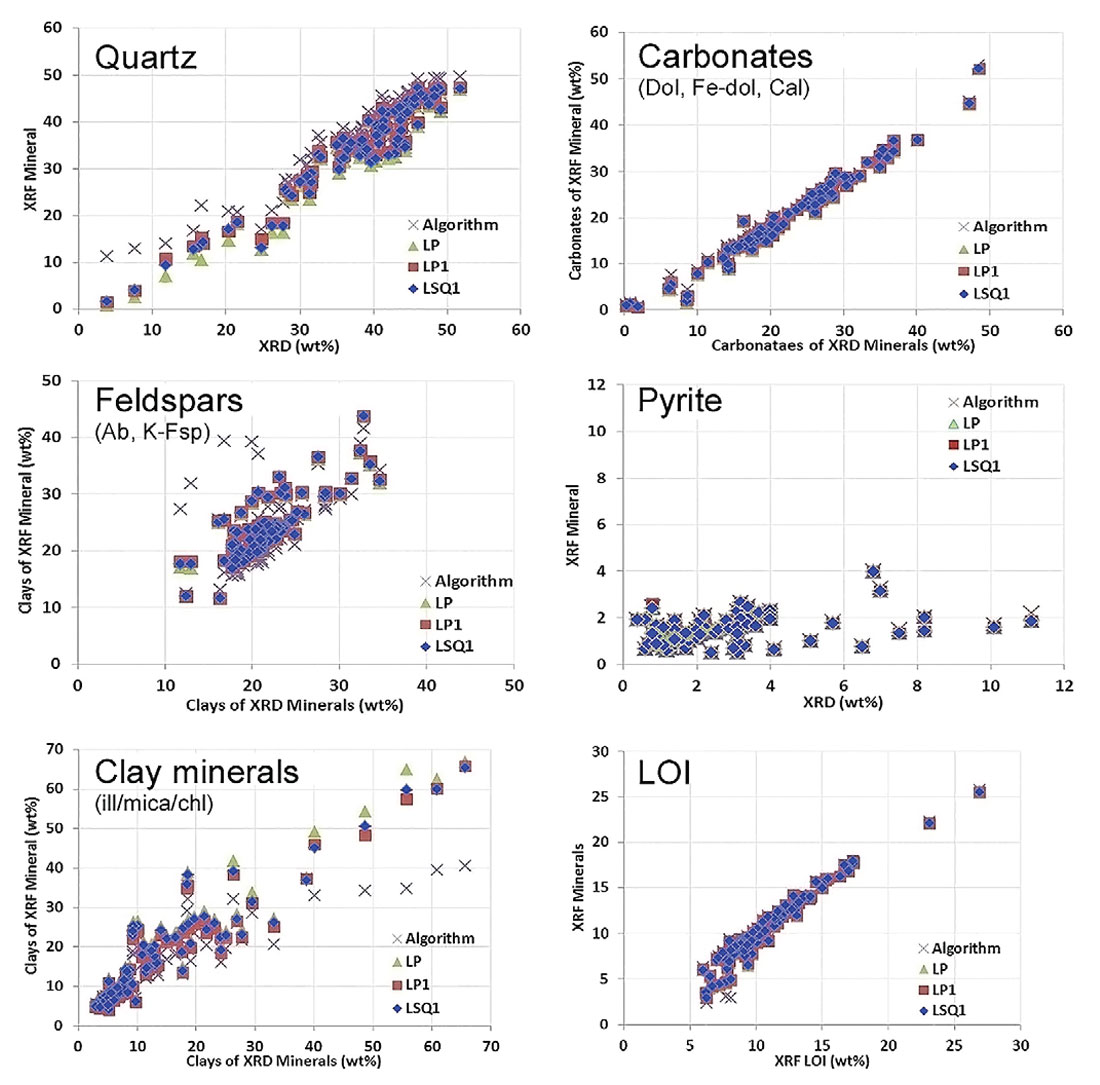
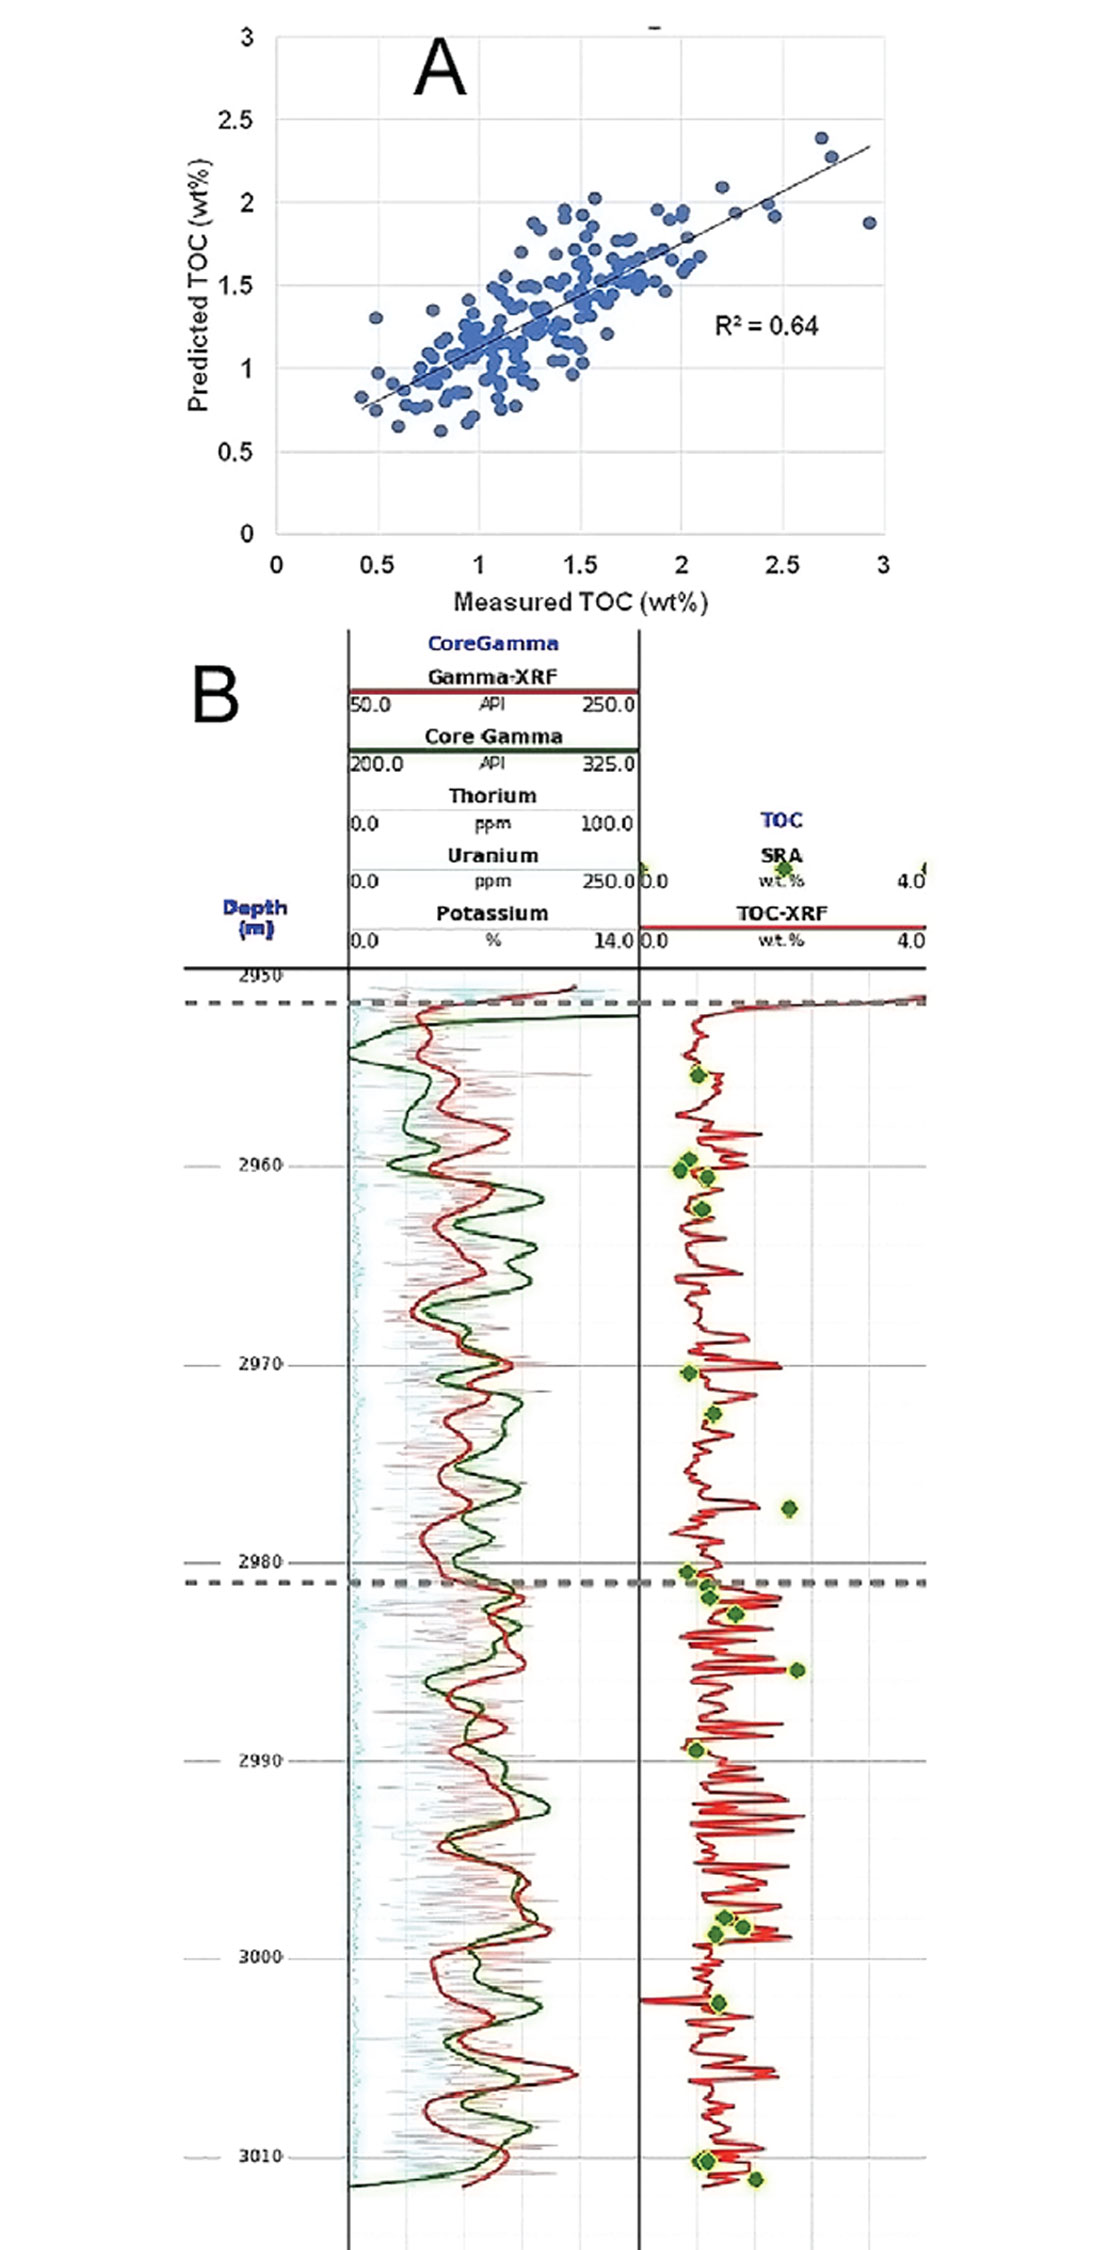
Figure 4 shows the output of 82 samples from 7 wells with selected elemental-based mineral model data plotted against XRD refined weight percentages. One of the more challenging modeled determinations is computing the total organic content (TOC). In this study, TOC is modeled from XRF data using the machine learning technique based on 180 measured TOC and XRF samples. Figure 5 illustrates the cross-plotted measured and modeled TOC from 180 samples and the model-derived (from XRF data) TOC determination. The comparison of the XRF-derived gamma and core gamma and the modeled TOC profile show different absolute values but very consistent patterns and closely matches with measured TOC values.
Hardness profiling
Hardness describes the resistance of a sample surface to localized plastic deformation from indentation, scratching, cutting or bending. The commonly used hardness test methods in the oil and gas industry include indentation tests such as Brinell and Vicker tests (Das, B., 1974), dynamic tests or rebound tests, and the scratch test. Hardness is not a fundamental property of a rock; instead it characterizes the composite contribution of the yield strength, tensile strength, Young’s modulus and other properties. Therefore, hardness is commonly used as a parameter to indicate the relative ease of a formation or zone to be hydraulically stimulated, and the potential embedment of proppant into hydraulically-induced fracture faces. High resolution hardness profiles can provide valuable data for optimizing well placement and multi-stage hydraulic fracturing programs.
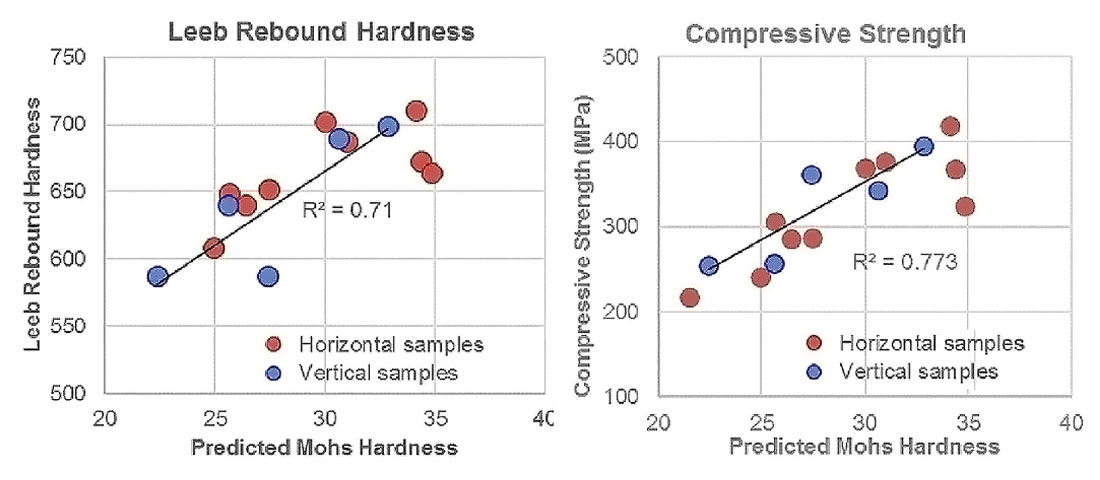
In this study, the Leeb rebound hardness is measured every centimeter on slabbed core surfaces to establish the hardness profile along the cores studied. The portable Leeb rebound hardness instrument applies a UCI (ultrasonic contact impedance) method by measuring the change in rebound velocity (Vr) from impact velocity (Vi) of a tungsten carbide ball, before and after hitting a sample surface. The testing procedure is followed in accordance with ASTM Standard A103-10a (2010) and ASTM Standard A956-12 (2012). Leeb rebound hardness is defined as the ratio of the rebound velocity to the impact velocity times 1000 (i.e. Vr / Vi *1000). A hardness profile along the core depth is also modeled based on the mineralogy determined from XRF profiles. Figure 6 shows that the Leeb rebound hardnesses are well correlated to the predicted Mohs hardnesses and measured rock compressive strength from a single well. A high resolution hardness profile along a vertical well is shown in Figure 8 as well.
Brittleness profiling
Brittleness describes the failure behavior of a rock mass during exposure to increasing stress levels. In general, brittle rocks are likely to have low values of elongation upon load application, a high ratio of compressive strength to tensile strength, high resilience, high concentrations of brittle minerals and less clay content, a higher Young’s Modulus (i.e. ability to shatter and thus fracture) and a lower Poisson’s ratio (i.e. low resistance to stress-induced failure), and generate fractures or fine particles and cracks upon failure (e.g., Hucka and Das, 1974; Zhang et al., 2016).
Numerous brittleness indices (over 25 definitions, e.g. Zhang at al., 2016) have been proposed in the literature for different applications, however, there is a lack of coherent consistency among these definitions as each index is based on a certain aspect of the attributes of brittle rocks and their failure behaviors.
Brittle unconventional reservoirs or formations are desirable for formation reservoir stimulations, because complex fractures are required to access larger reservoir volumes and increase the efficiency of production. Brittle rocks have been shown to develop more complex fractures during well stimulation than less brittle rocks.
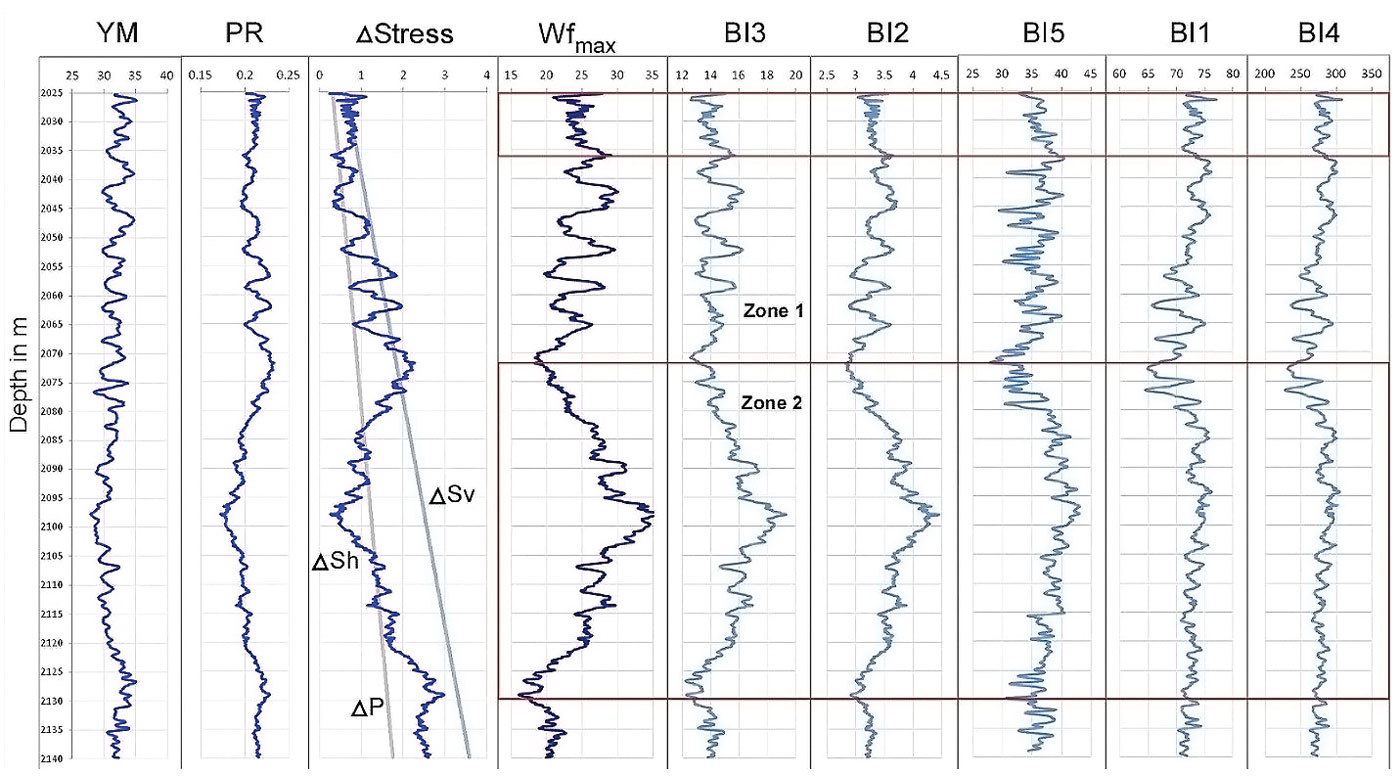
In this study, several commonly used brittleness indices based on elastic properties and mineralogy are considered, and are compared with the newly-proposed XRF-derived profile and hardness measurements:
Elastic properties based brittleness:
Rickman et al., 2008: BI1 = 0.5 x (BIYM + BIPR)
- BIYM = (YM – YMmin) / (YMmax – YMmin)
- BIPR = (PRmax – PR) / (PRmax – PRmin)
Chen et al., 2014: BI2= YM/λ, where λ is the Lamé first parameter.
Mineralogy-based index:
Jarvie et al., 2007: BI3 = Qtz / Total
Want and Gale et al., 2009: BI4 = (Qtz + Dol) / Total
We also proposed a new brittleness index based on hardness. For example, Mohs hardness is used here:
BI5 = Mohs Hardness based on mineralogy modeled from XRF data.
The brittleness determinations provide relative measures and are not absolute numbers of static or dynamic physical rock properties. However, as an indirect measure, relative differences in brittle or ductile behavior of the lithological units can be identified. The usefulness of the brittleness numbers increases when combined with other reservoir rock properties, such as mineral composition, density, and organic matter content, etc., for cross-correlated rock elastic property determination and thus identification of optimized fracturing models and plans. In the absence of rock data, determination of geomechanical properties is commonly completed using log data, which in some cases may be from wells several kilometers, or even tens of kilometers, away. The reliability of using distant offset wells is questionable given the fact that unconventional deposits are characteristically heterogenous with high lateral and vertical variability (see Figure 7). We argue that such an approach is often fairly poor and results in incomplete hydrocarbon recovery, poor well performance, and early reservoir depletion. With the establishment of robust calibration methods that cover a wide range of rock properties, analytical approaches can be steered towards drill cuttings. These can be collected at high frequency in order to obtain high resolution rock property profiles and improve stimulation approaches.
Data and modeling applications
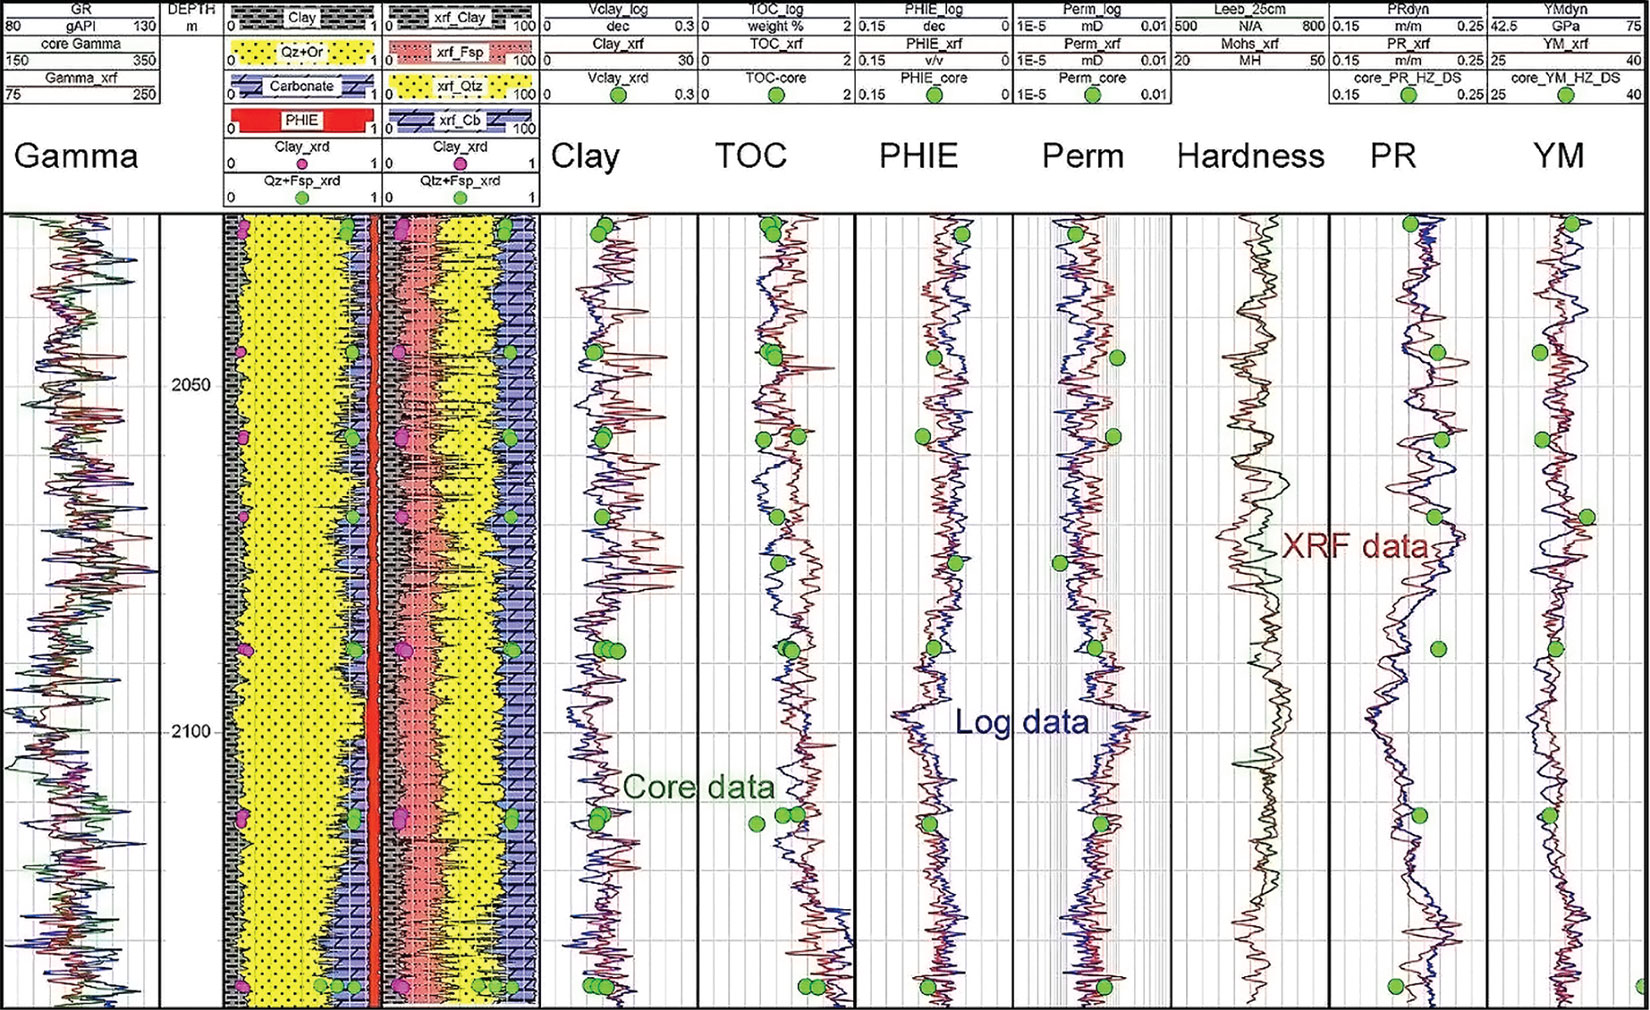
XRF geochemical and Leeb Hardness profiling of a large regional core assemblage in the Montney Formation of Alberta illustrates that many physical rock properties can be derived, including TOC, and fracture critical parameters such as Young’s Modulus (YM), Poisson’s Ratio (PR), and brittleness. The importance of this approach is to identify and differentiate brittle and ductile areas in any well section. Data comparison with log data and log calibrations provides further assurance to select optimal completion and stimulation areas within the target units. The Montney Formation example shows that variable mechanical behavior exists downhole, and the rocks display different behaviors during fracturing processes. More importantly, strongly calibrated XRF model outputs closely match the rock mechanical data. Figure 8 shows the output of the model in comparison with the core data and the modeled XRF data. Consistency among the petrophysical data, core data, and XRF-based modeled data underscores that the XRF-based approach can indeed be very useful for the determination of rock properties, which are critical for exploration and completions within a target play.
Implications and future applications
Geochemical XRF data (Na to U) and Leeb hardness high resolution profiling of cores in the Montney Formation are providing new detailed insights into the variability of geological and mechanical characteristics and the heterogeneity of the formation. The investigations of the Montney Formation using more than 1400 meters of core illustrates that several steps are critical to obtain valuable information and data. XRF data collection is routinely done but calibration approaches are often fairly limited. Our approach illustrates that:
- XRF data of portable units (ED-XRF) need to be calibrated with full-size (i.e. wavelength diffraction) XRF units against different formation specific rock types and international rock standards (can be obtained for example from the US Geological Survey).
- XRF mineralogical data requires careful calibration with XRD-derived mineral phases and mineralogical composition.
- XRF modeled organic data requires calibration against measured TOC data.
- Leeb hardness data are very sensitive to lithology and mechanical properties variation; hardness can be a very useful tool to probe the reservoir and completion quality.
- Brittleness modeling shows that different models based on different rock properties (mineralogy, mechanical strength, or petrophysical properties) have different profiles and reflect different aspects of the rocks properties.
- Consistent reservoir and mechanical properties from different sources can be derived using a rigorously calibrated database. Multiple data sources should be integrated together to provide a more complete dataset for exploration and completion.
Core data calibration and log information can then be used to identify favorable zones for stimulation treatments. Equally important is the determination of rock properties along the length of horizontal sections, where it is often assumed that homogenous rock sections are present. However, even in formations like the Montney, this is far from the case. High-resolution XRF profiling and rock property modeling can be completed with the help of cuttings material. Once robust calibrations are established for a specific formation, cuttings of both vertical and horizontal wells provide a low-cost approach to increase our understanding and knowledge of the variability in rock properties and mechanical properties.
More importantly, XRF profiling and data generation can be completed within 3-10 days, which lies within the timeframe of drilling and completion decision making. Almost every horizontal well shows lithological variability and yet lateral well stimulation is performed as uniformly as possible. Zonal issues with perforation, fluid volume, or sand-placement are clear indicators of stratigraphic heterogeneity along the well bore. Any issues encountered should be a reason to use a more scientific approach and treat these heterogenous reservoirs properly. High resolution mechanical and rock property profiling derived from analytical tools like XRF along horizontal wells provide high-resolution petrophysical analysis that will erase guesswork and hence ultimately lead to reduced costs (by not completing poor zones), and increased success in reservoir area stimulations and production history.

Acknowledgements
This work was done for a regional study as part of a commercially available Montney Study of AGAT Laboratories (formerly Trican Geological Solutions) and we are grateful to be able to publish some of the data. The work in this study relied on the help of numerous people to whom we are indebted, including Sam Tu, Nik Minions, Cory Twemlow and Brent Nassichuk.


Join the Conversation
Interested in starting, or contributing to a conversation about an article or issue of the RECORDER? Join our CSEG LinkedIn Group.
Share This Article