Introduction - Vibroseis deconvolution
Vibroseis has enjoyed worldwide popularity in land seismic acquisition ever since its development by Conoco’s researchers (Crawford et al., 1960). Crosscorrelation of the sweep with the recorded data, which emulates the methods developed in chirp radars by Klauder et al. (1960), will ideally produce zero-phase wavelets with a flat spectrum. The crosscorrelation method is generally robust and greatly compresses the recorded data. On the other hand, recent articles by Haffner (private communication) and Robinson (1999) have caused us to re-examine sweep deconvolution as an alternative to crosscorrelation. Brittle et al. (2000) have demonstrated the use of sweep deconvolution on synthetic and field data. In this article, we examine sweep deconvolution in the frequency domain, and compare deconvolution to crosscorrelation for data from the Pikes Peak field in Saskatchewan.
In vibroseis acquisition, the source wavelet is not an impulse, as for dynamite or air guns. Rather it is a more complex signal of continuously varying frequency created by mechanical vibrators. The vibroseis source signal is of longer duration and generally lower amplitude than dynamite sources. The sweep travels through the earth and is reflected back to a recording geophone. The recorded vibroseis trace can be defined as a combination of several different time sequence effects, including the earth’s reflectivity r(t), the input sweep s(t), random noise n(t) and earth attenuation e(t). The trace, x(t), can be expressed mathematically as:

where * represents convolution. The data must be processed to suppress noise, and deconvolve the sweep and earth filter from the convolution equation, leaving the desired reflectivity. This is traditionally completed with the use of crosscorrelation.
Crosscorrelation
Crosscorrelation exploits the concept that the autocorrelation (crosscorrelation of two identical functions) results in a symmetric sequence at zero lag (Yilmaz, 1987). When a sweep is correlated with itself, the output is a Klauder wavelet, with the maximum value located at zero-lag. This method of crosscorrelation can be completed for the recorded seismic traces, where the sweep for each shot is stored in the auxiliary channels of the data, thereby removing the embedded sweep and replacing it with the Klauder wavelet. That is, the crosscorrelated vibroseis trace can be written as the convolution of the recorded trace with a time reverse of the sweep, s(-t), such that

Crosscorrelation (cc) compresses the sweep to a Klauder wavelet,

and also affects the additive random noise. The noise is also correlated with the sweep, which acts as a filter for the random noise - eliminating the noise component outside the bandwidth of the sweep. Another advantage of crosscorrelation is the significant compression of data volumes.
Despite the advantages of vibroseis crosscorrelation, there are several effects of crosscorrelation that can cause problems in future processing. The first is the dependency of the result on the sweep shape. A consequence of crosscorrelation is that the data is filtered by the power spectrum of the sweep. For linear sweeps, where the spectrum is white over the bandwidth of the sweep, there are no problems related to the filtering. For non-linear sweeps, due to the filtering, the data will have a non-white spectrum that is not representative of the true reflectivity. Another disadvantage of field crosscorrelation is that it is difficult to undo the effects of bad correlation.
A significant component of the convolution equation is the presence of minimum-phase earth attenuation in real data, as discussed by Ristow and Jurczyk (1975). Futterman (1962) effectively shows that the “earth filtering” attenuation effects are minimum-phase. The transmission response of a layered medium can also be shown to be minimum-phase (Robinson and Treitel, 1977). Therefore, if the original pulse is minimum-phase, the effective wavelet can be considered minimum-phase, and minimum-phase deconvolution can be applied to effectively remove the embedded wavelet.
However, the filtering effect of crosscorrelation can become a problem when minimum-phase deconvolution is applied to vibroseis deconvolution. The minimum-phase nature of earth attenuation causes two separate effects, both of which can be problematic. One of the problems involves the amplitude spectrum and the attenuation of higher frequencies. This causes the spectrum to appear as non-white, usually requiring that the data be whitened by some spectral flattening program. The second problem involves the phase spectrum. In the case of the phase, the minimum-phase earth filtering replaces a zero-phase wavelet, k(t), with a mixed-phase wavelet, k(t)*e(t). A solution to this problem was advocated by Gibson and Larner (1984) who examine the use of the minimum-phase equivalent of the Klauder wavelet to remove the problems associated with the mixed-phase embedded wavelet. This method converts the Klauder wavelet to a minimum-phase equivalent and subsequently uses minimum- phase deconvolution to remove both the Klauder wavelet and the earth attenuation, leaving a zero-phase result. Modelling of this method for non-linear sweeps indicated that there are problems associated with accurately determining the minimumphase equivalent of the Klauder wavelet. This method requires a white noise (prewhitening) factor to handle zeros in the amplitude spectrum. This factor can vary significantly and modify the minimum-phase equivalents. Cambois (2000) recommends not using the white noise factor, but proposes using an alternative method to adjust the low frequencies of the sweep, obtaining a better minimum-phase equivalent.
The inability to obtain accurate amplitude and phase information in vibroseis processing can drastically affect the results for future processing techniques including AVO and time-lapse analyses.
Although crosscorrelation can be a robust technique for processing vibroseis data, do alternative methods exist for obtaining reliable bandpassed versions of r(t)? Our experience and the recent publication of Robinson (1999) indicate that such a technique does exist - it essentially involves the deconvolution of the seismic sweep from the recorded vibroseis traces.
Frequency domain deconvolution
To reduce some of the problems associated with crosscorrelation and increase the control on the final result, the method of frequency domain sweep deconvolution (FDSD) is introduced. The sweep is removed in the frequency domain in an attempt to remove the Klauder wavelet. In the frequency domain the convolution equation is

To remove the embedded sweep both the recorded trace and the sweep are converted to the frequency domain and the sweep is divided from the trace, such that
The random additive noise is amplified for all frequencies that are not in the sweep’s bandwidth. This effect can easily be reduced with the addition of a small stability factor to eliminate any possible divisions by zero related to the limited frequencies of the sweep. This is completed, altering the equation to:

where stab is the percentage of whitening chosen and Sstab(() is the stabilized sweep. This creates a result similar to that of crosscorrelation, with the exception that there is no Klauder wavelet in equation (5). The elimination of the Klauder wavelet causes the data to only be dependent on the bandwidth of the sweep and not the shape. This eradicates problems associated with a changing sweep over a seismic line or for different seismic acquisitions. The data is still limited by the bandwidth of the sweep, however synthetic modelling has shown that the phase-rotations caused by minimum-phase deconvolution are not as large or significant as for crosscorrelation. For the entire bandwidth of the sweep an accurate estimation of the embedded minimum-phase wavelet, a result of earth attenuation can be completed. There are still problems associated with the frequencies with no data, which does cause some inaccuracy in the embedded wavelet estimation. Nevertheless, we can estimate the reflectivity from equation (5) by using the minimum-phase deconvolution to remove the earth filtering effects.
Pikes Peak, Saskatchewan
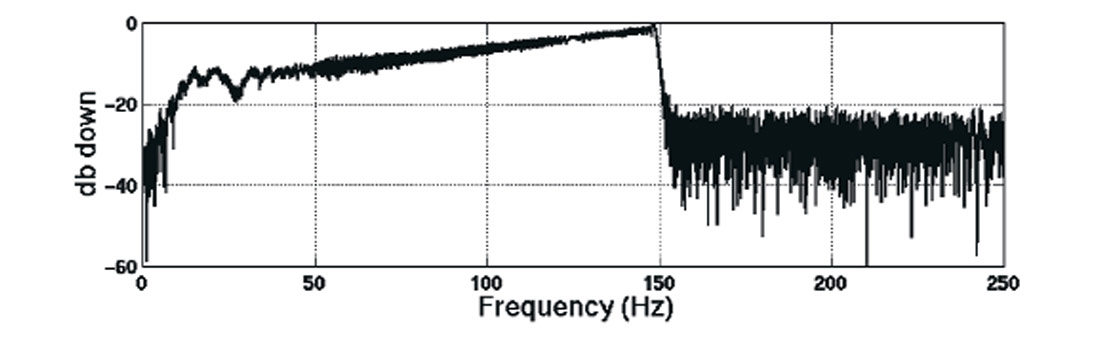
In March 2000, a 2D vibroseis line was acquired at Pikes Peak, Saskatchewan through the partnership of the University of Calgary’s AOSTRA funding and Husky Energy Inc.. Two vibrators swept four times at each source point with a non-linear 16- second sweep, two-millisecond sample rate and an 8 to 150 Hz bandwidth (Figure 1). The data was recorded unsummed and uncorrelated with the sweeps recorded as auxiliary traces. The sweep embedded in each trace was deconvolved with both crosscorrelation and frequency domain sweep deconvolution for comparative purposes.
The data can be compared at several different points in the processing flow; after the sweep deconvolution, minimum-phase deconvolution and the final stack. A phase analysis is completed to compare the two vibroseis deconvolution methods for a single shot record.
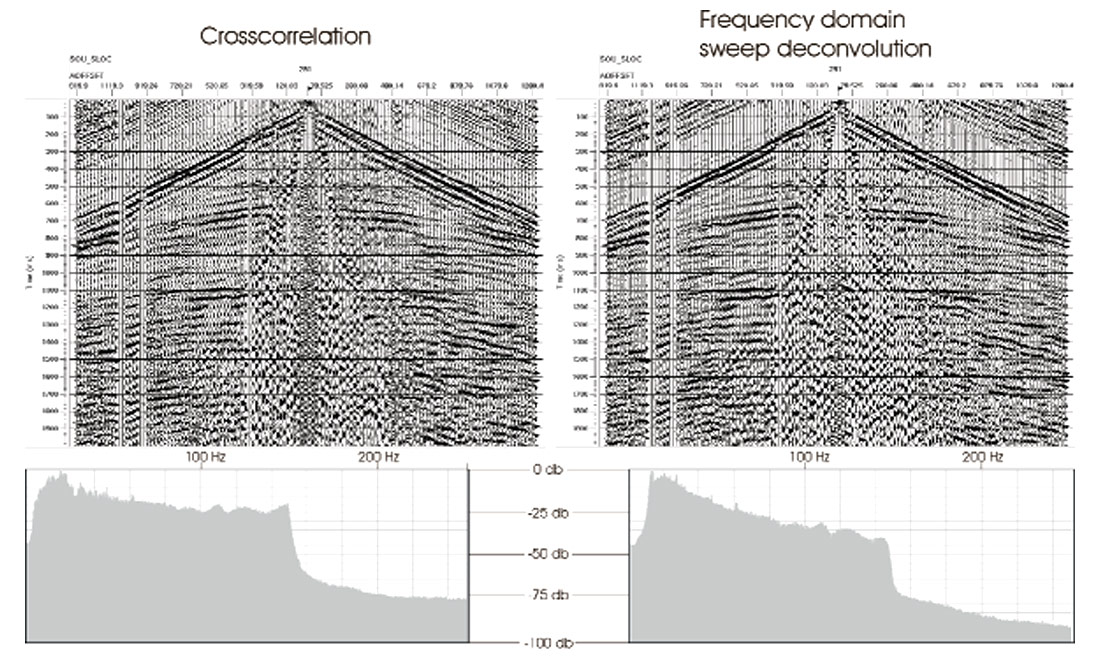
There are amplitude variations visible in the data after the initial deconvolution, a result of the earth attenuation (Figure 2). The Q values at Pikes Peak were calculated from the vertical seismic profile located on the seismic line. The spectral ratio method (Bath, 1974) was used to calculate the values of Q, which were found to range from 96 to 36 and have a significant effect on the data. The use of a phase match filter and visual examinations show no phase-difference between the two sweep deconvolution methods.
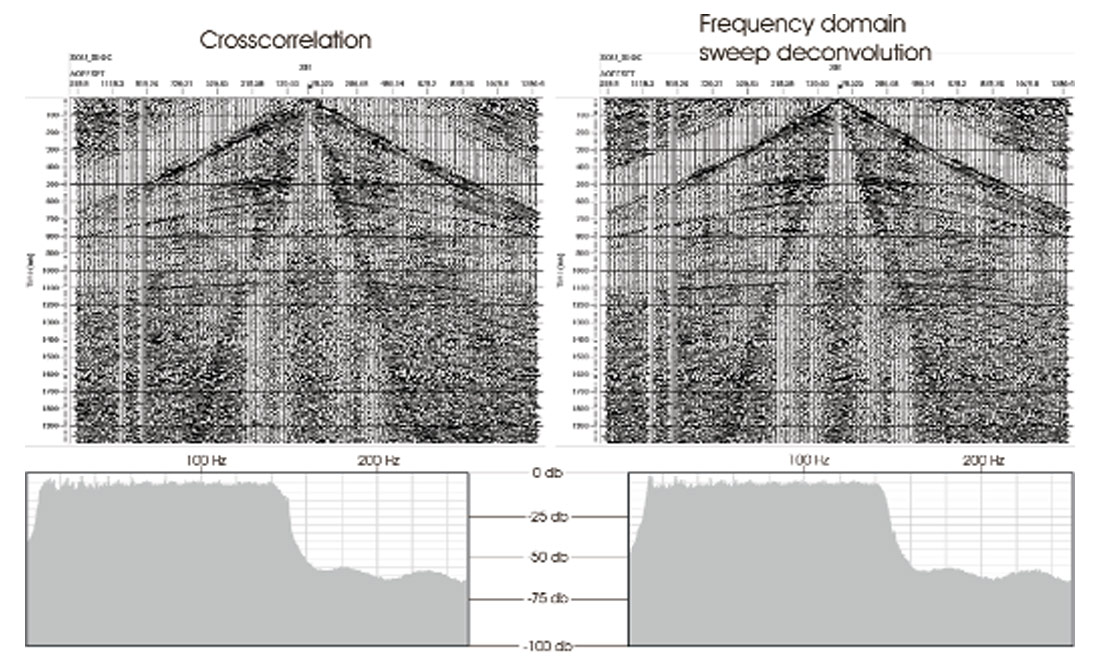
In an attempt to remove the minimum-phase earth attenuation and whiten the data, spiking deconvolution is applied, with the result shown in Figure 3. In both cases the amplitude spectrums have been whitened, however an average phase-difference of 37.5 degrees has been introduced into the shot gather. The phase-difference varies trace-by-trace, which can be a problem in any future data analysis.
The final comparison is for the entire seismic line, after the data have been stacked. A limited level of processing is used to obtain the best and most accurate comparison possible. The comparison of the lines (Figure 3) shows a slight phase-difference between the final results of the sweep deconvolution methods. The average phase-difference can be calculated as 7 degrees over the entire line, however similar to the previous comparison the difference does vary for trace-by-trace comparisons.
Final Comparison – VSP and well log synthetic
There is a small difference between the two vibroseis deconvolution techniques, however the comparison of these two methods can also be completed with the processed VSP corridor stack and a well log synthetic.
The reservoir zone in the Pikes Peak field is located at depth of approximately 500m and is visible on the seismic section at approximately 500 ms. A composite well log was created from several wells in the area to obtain the largest depth range for the data. The synthetic was created with a 10/15-140/150 Ormsby wavelet to match the bandwidth of the seismic data. A comparison of the reservoir zone (above the Sparky) indicates that neither of the vibroseis deconvolution methods provides a perfect tie (Figure 4). The better correlation does occur between the synthetic and FDSD. Some variation in the reservoir zone is expected due to the cyclic steam injection in the pool.

A comparison of the results with the VSP, acquired in September 2000 at the north section of the seismic line, provides a more accurate source for data analysis. The zero-offset VSP was acquired with a 10-200 Hz sweep and recorded unsummed and uncorrelated. This allowed the two vibroseis deconvolution methods to be used to process the data. A comparison can then be completed between the two methods for the VSP corridor stacks and the seismic lines (Figure 5). The best tie between the seismic data and the VSP occurs when both are processed with FDSD. However, the seismic line processed with FDSD also ties more accurately with the crosscorrelated VSP than the seismic line processed with crosscorrelation. The method of FDSD for the Pikes Peak data provides more accurate amplitude and phase information than that processed with crosscorrelation.

The use of the frequency domain to deconvolve the vibroseis sweep appears to assist the attainment of accurate amplitude and phase information. The limited dependence of the result on the initial sweep is also important for obtaining data for amplitude analyses and time-lapse seismic data.

Acknowledgements
We thank Scott Haffner of Veritas for suggesting the idea of vibroseis sweep deconvolution. We are also grateful to AOSTRA, CREWES, Husky Energy and NSERC for their support of our project.


Join the Conversation
Interested in starting, or contributing to a conversation about an article or issue of the RECORDER? Join our CSEG LinkedIn Group.
Share This Article