Why consider reprocessing seismic data?
Seismic data enables us to visualize the subsurface in three dimensions with sufficient vertical resolution to identify all but the thinnest of our oil and gas reservoirs. Using seismic data, interpreters map changes in reservoir depth, thickness and character between well locations, and identify the larger faults that create potential drilling hazards and disrupt reservoir continuity. Quantitative Interpretation projects follow with the goal of teasing out information about the internal structure of our reservoirs from seismic amplitude versus offset analyses. Year after year, multi-billion-dollar investment decisions are made, in part based on this information. Seismic data is thus undeniably a key component of the oil and gas industry’s core exploration and development businesses.
The seismic data we use on a daily basis for well planning and investment decisions should not be viewed as a static resource. Rather, continual improvements in the seismic processing workflow reveal material seismic imaging improvements over time frames of 3 to 5 years (with a good processing contractor who uses current processing algorithms and workflows), as described in this article. Companies that treat seismic data as a dynamic resource and invest in seismic reprocessing projects should expect to gain a competitive advantage over rivals who make decisions using information extracted from more out-of-date seismic volumes.
Permian Basin Imaging Challenges and Opportunities
The Permian Basin is a fantastically rich petroleum province. Considered a mature basin twenty-odd years ago, evolution of our play concepts and advances in our understanding of how to extract oil and gas from shale formations have created a smorgasbord of new production opportunities in the basin, and many companies have entered the basin over the last few years. Indeed, the richness of this resource base has made the Permian Basin one of the most resilient petroleum provinces in North America to today’s relatively low oil price.
Interpretation of legacy Permian Basin seismic data is difficult and may be of limited value when the quality of the available seismic stacks and gathers falls towards the lower end of the spectrum, as is often the case. This may be due to a number of reasons including:
- Acquisition of the seismic data with vintage low cost acquisition design schemes consisting of a coarse and irregular grid of shot points and receiver stations, and a restricted range of vibroseis sweep frequencies, particularly at the low end. In more extreme cases, this impairs our ability to apply modern processing workflows such as offset vector tile binning, and fundamentally limits the value of the information derived from the data, even after the best reprocessing workflows have been applied.
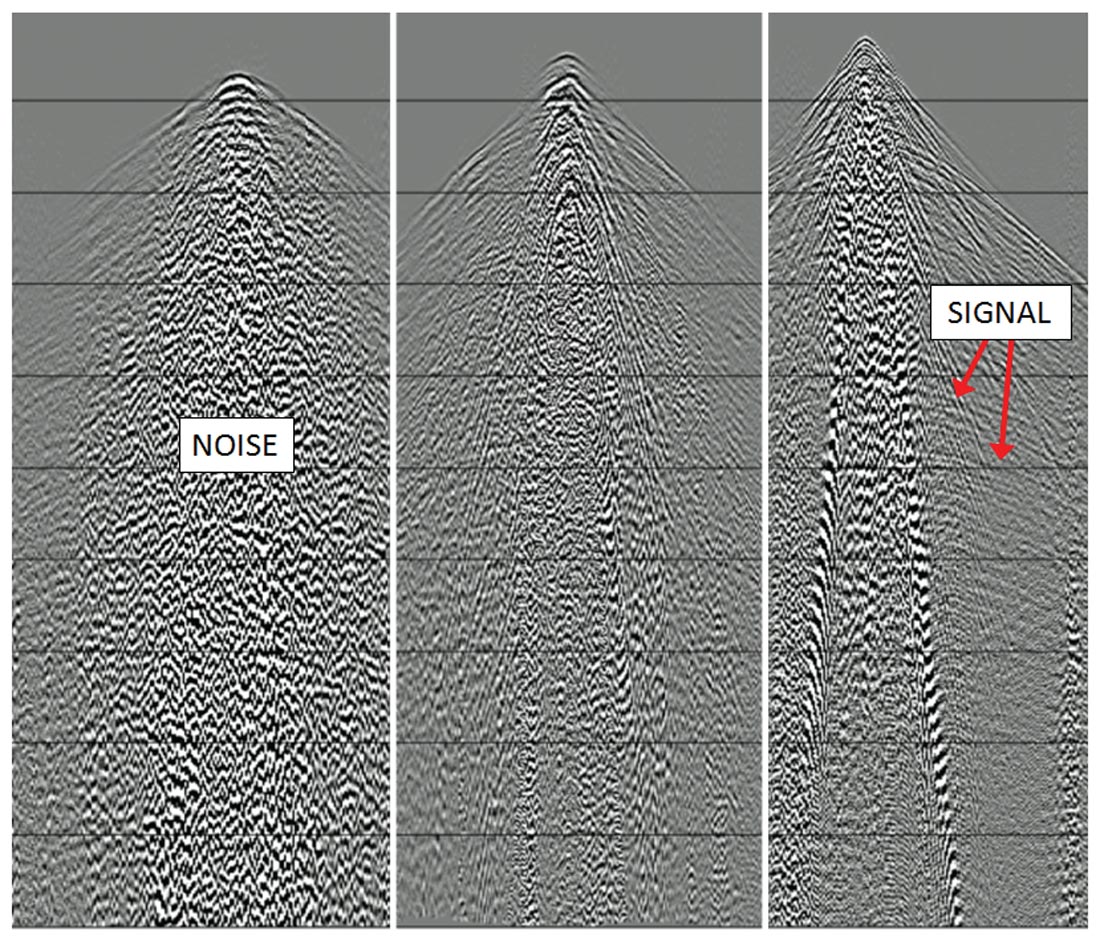
- Spatially-varying near surface complexity, which often puts a lot of disorganized noise into the raw seismic records and hinders our ability to easily process the seismic data (Figure 1).
- Application of obsolete seismic processing algorithms and workflows.
Over time, the seismic data processing workflow, which is applied to transform the raw shot records into migrated, interpretable images of the subsurface, evolves. As this workflow improves, so does the quality of our subsurface images. Recent processing advances have broadened the seismic bandwidth (Yates et al., 2017) enabling the imaging of thinner beds. At the same time, more accurate anisotropic depth migration algorithms have improved our imaging in areas with more complex structure. It should be acknowledged that seismic data has finite resolution and dip limits, and because of this certain imaging targets will never be resolved.
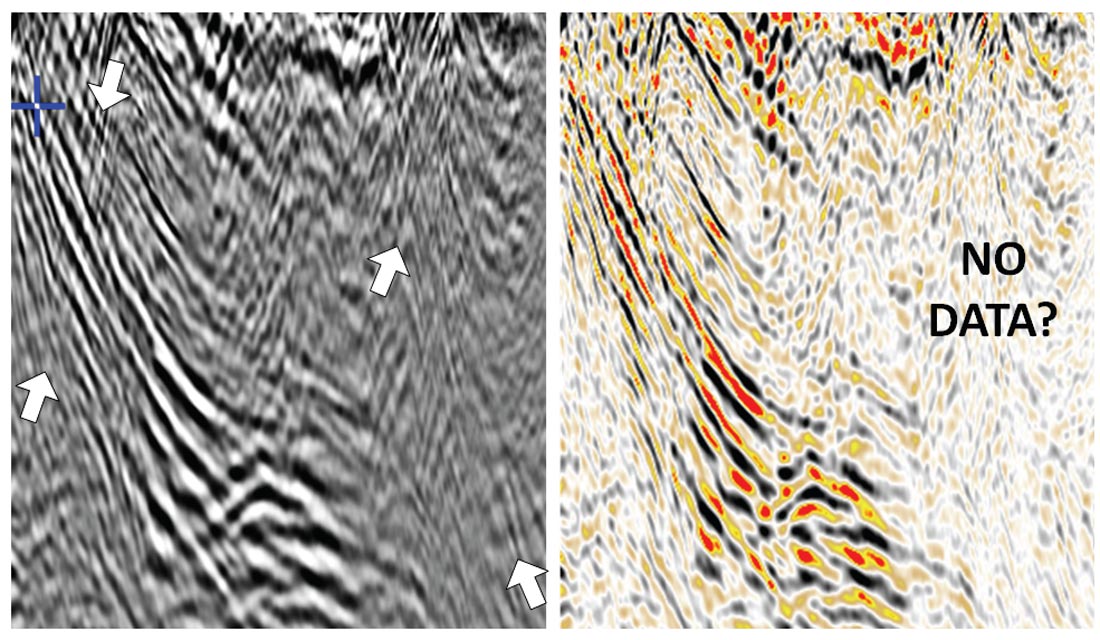
The best imaging improvements are achieved when well thought-out workflows are built with attention paid to even the smallest details. Without exception, we observe that upgrading workflows to benefit from a series of small incremental imaging improvements yields final images that are far superior to the images that would have been generated had these incremental improvements not been achieved. A good example of a best practice that can have an outsized impact is the choice of seismic display for Quality Control (QC). Compare the two images in Figure 2. They are of the same data set. One is shown using a gray scale variable density plot, the other with a standard color scale variable density plot. Steeply dipping beds are clearly visible when the seismic is viewed with the gray scale variable density plot, but not when the color scale is used. Even less detail would have been observed had a wiggle trace display been used. When processing parameter decisions are made based on displays that do not reveal the full richness and complexity of the data, they often result in sub-optimal parameter choices.
Key elements of a modern seismic reprocessing workflow
Introduction
Without divulging the details of Occidental’s favorite Permian Basin reprocessing recipe, it is hard to envision a good modern production processing workflow that does not include the following elements:
- Modern acquisition QC
- Current statics best practices (e.g. Diggins, C. et al., 2016)
- State-of-the-art noise attenuation workflows such as Cadzow noise attenuation
- Trace interpolation
- Offset vector tile binning (when enabled by the acquisition of seismic data with suitable patch geometries)
- Anisotropic PSDM
A few of the processes we have found important are described in more detail, next. They are by no means ground-breaking; however their application is at best patchy in standard industry seismic processing workflows.
Acquisition geometry analysis and correction
Without careful upfront QC, the impact of acquisition geometry errors will propagate undetected through the processing workflow and degrade the quality of the final images. Over time, specialized software and workflows have been developed to rapidly detect and fix acquisition errors such as shot and receiver positioning errors (Figure 3) and receiver polarity errors. The older the survey, the greater our chance of detecting significant acquisition errors. In some parts of the world, readers should be aware that equipment theft results in receiver positioning errors that change from one day to the next!
Attenuation compensation
Q correction should be applied before deconvolution to reduce the amplitude and phase effects of attenuation on the wavelet. Whilst the loss of high frequencies cannot be fully compensated for, the time-varying phase rotation of the wavelet can be largely removed. Due to challenges normally encountered when estimating Q, values in the range of 70 (stronger) to 90 (weaker) appear to do a fair job, and should be used in the absence of other information. As with anisotropy, applying some degree of attenuation correction, no matter what, is better than not applying any correction. Figure 4 illustrates how correcting for attenuation boosts the high frequency content of this data set and rotates the wavelet, thereby improving both the vertical resolution of the seismic image and the well ties.
Interpolation
I am conflicted about the use of trace interpolation in the modern seismic processing workflow. Good interpolation workflows take into account variations of the seismic data with both offset and azimuth, and generate traces that, whilst perhaps reasonable, are never a perfect substitute for real data. To be sure, infilling acquisition holes with interpolated traces that even moderately resemble the true wavefield reduces migration swing noise.
In my opinion, the necessary simplification of the wavefield during interpolation is a double-edged sword. When the energy removed during interpolation is noise, as may well be the case when using interpolation in noisy data areas, applying interpolation should result in a cleaner migration. On other occasions, particularly when working with relatively clean, less-structured data, we observe that interpolation damages the subtler features in the data such as small faults, channels and karsts. This is most clearly seen after migration. In some instances, interpolation will unfortunately enhance noise in the data at the expense of weaker or less coherent signal.
The following guidelines are recommended when applying interpolation:
- Avoid replacing real data with interpolated data – i.e. using interpolation to “regularize” the seismic data.
- Test interpolation carefully before applying in production. QC interpolation test data after migration, as migration focuses the imaging and reveals the subtle features of interest.
- Use more aggressive interpolation schemes in noisy data areas (as a last resort), and in areas of structural complexity and poor imaging.
- In good data areas, use interpolation only to fill in holes in the acquisition coverage (thereby reducing migration swing noise).
Cadzow noise attenuation
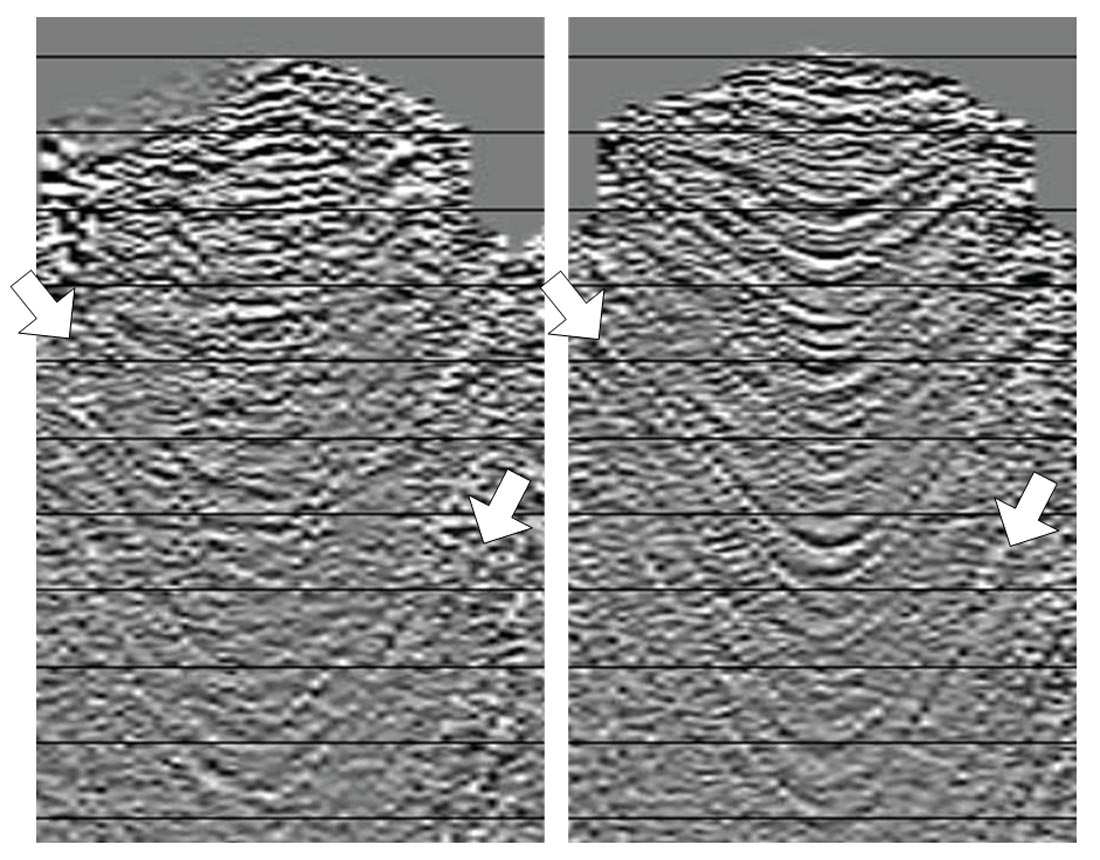
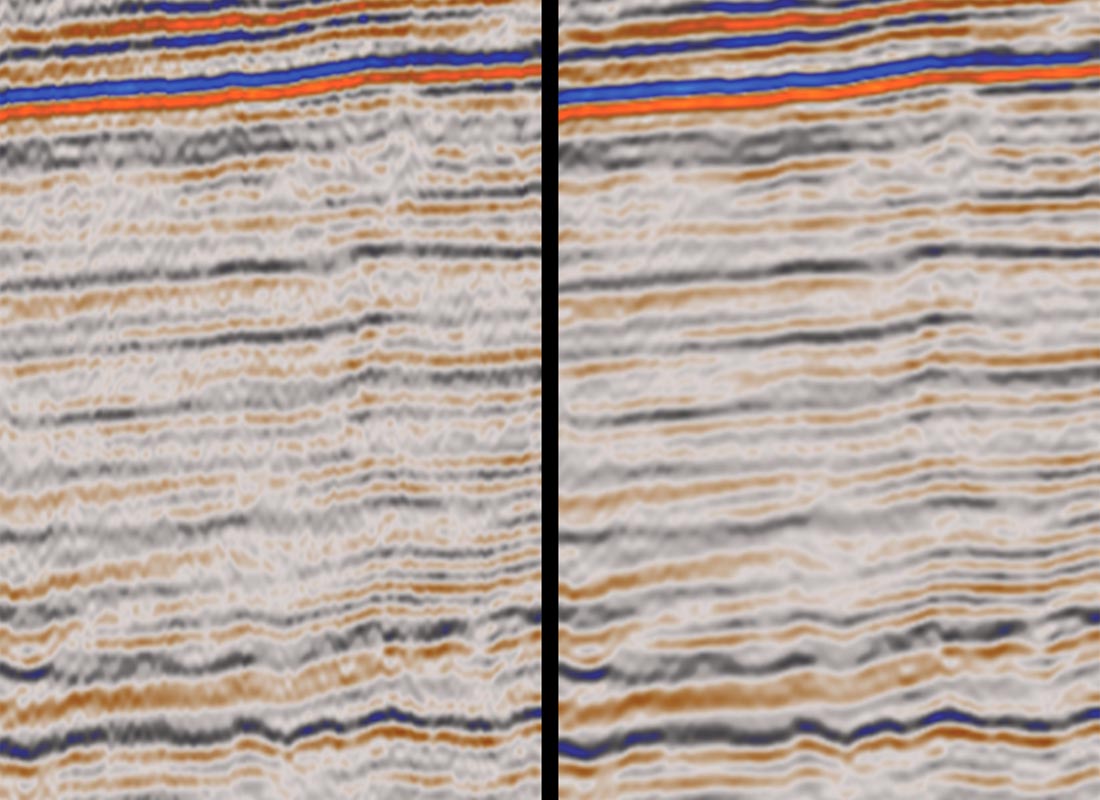
Cadzow rank reduction noise filtering (Trickett & Burroughs, 2009) has become an integral part of many good processing workflows, and may be applied before and after migration. Note that this technique needs to be applied carefully, and QC should be run on both unmigrated and migrated data, as too enthusiastic an application will damage subtle features of interest such as faults, karsts and channels. Figure 5 shows an application of Cadzow noise attenuation after migration to decrease noise at the reservoir level, enabling faster and more confident interpretation of key horizons.
Trim statics for residual gather flattening
Time-varying trim statics optimally align reflections before stack. Trim statics require a guide, or pilot. Use the best stack rather than near offset traces within the gathers as the guide, as this gives a more stable trim statics solution and less stack jitter. The impact of trim statics on the stack is often significant.
Roadmap for a successful seismic reprocessing project
In addition to selecting contractors with good processing workflows, algorithms and people, it is critical that the reprocessing projects are overseen by a representative of the oil company who has a complete and expert understanding of the entire processing workflow, a vision of the ‘ideal’ processing workflow, and a detailed understanding of the reprocessing objectives. With this background, the representative will steer the processing contractor towards the optimal workflow. Whilst the key elements of a good processing workflow are roughly constant, the precise workflow that yields the best imaging will vary from project to project, as well as from basin to basin.
Best practices when working with third party seismic data processing contractors to achieve the highest quality imaging include:
- Get the best seismic data processor at the best processing contractor working on your project. There is no substitute for experience, enthusiasm and the right tools.
- Develop a detailed project plan, then fully discuss this plan and the top imaging priorities with the contractor before the project starts.
- Set project management and timeline expectations in advance of the project starting.
- Share detailed geological information about the reservoir and other imaging targets with the contractor.
- Share the last processed version of the seismic data with the contractor, so that their processor has a readily available comparison data set – an imaging target to beat.
- Use a standard set of QCs throughout processing – inlines, crosslines and time/horizon slices (particularly when trying to image channels and small faults). Generate before / after / difference QC images at each step in the workflow.
- Ask the processor to output post-stack time migrations for in-house QC early in the project. This has the additional benefit of providing the asset geophysicist with data sets that can be interpreted as the project progresses.
- Document meeting notes and capture key QC images, as well as action items. Track each action item through to completion.
- Hold weekly processing meetings. Meetings held less frequently than this leave fewer opportunities for workflow intervention.
Examples of seismic imaging improvements from recent Occidental projects
It is our expectation that improved imaging is an achievable goal for every well designed and executed seismic reprocessing project. A few images from recent Permian Basin reprocessing projects demonstrating imaging uplift are shown next.
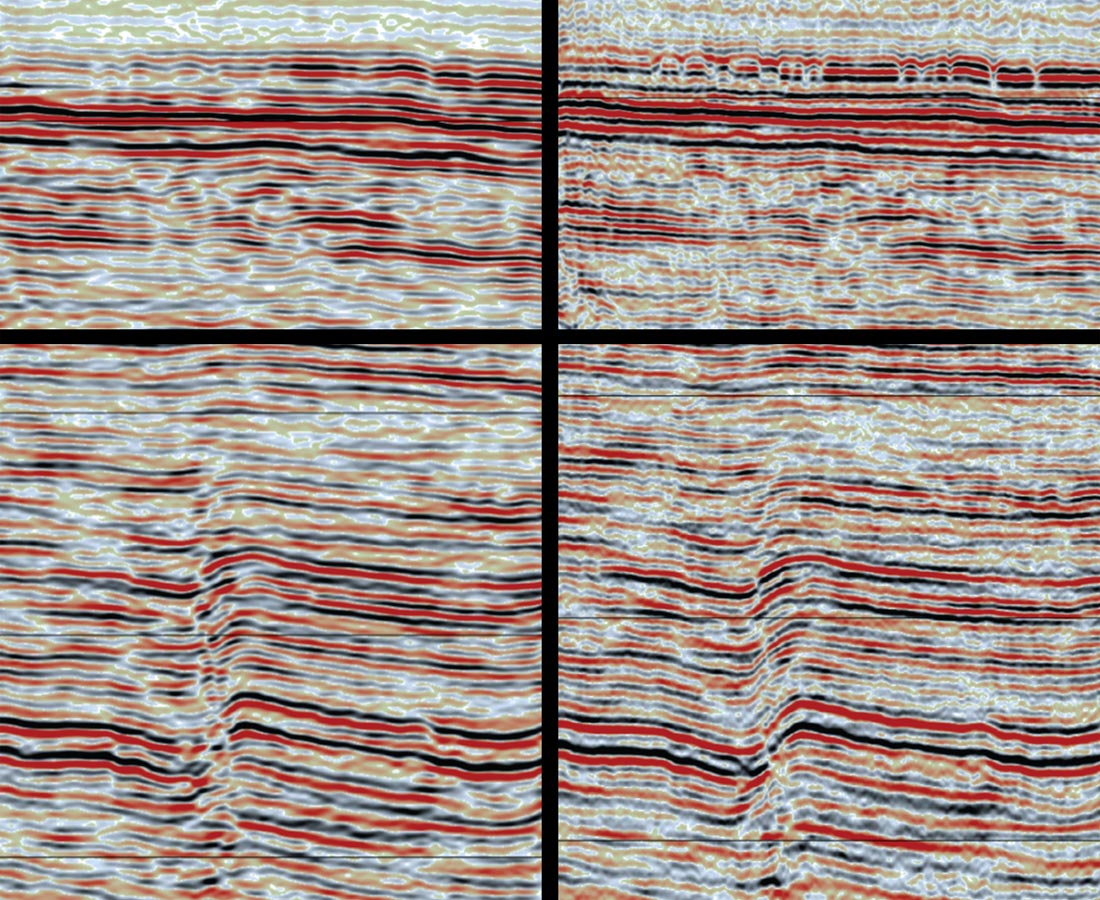
Example 1: From a 3D Reprocessing and Merge Project
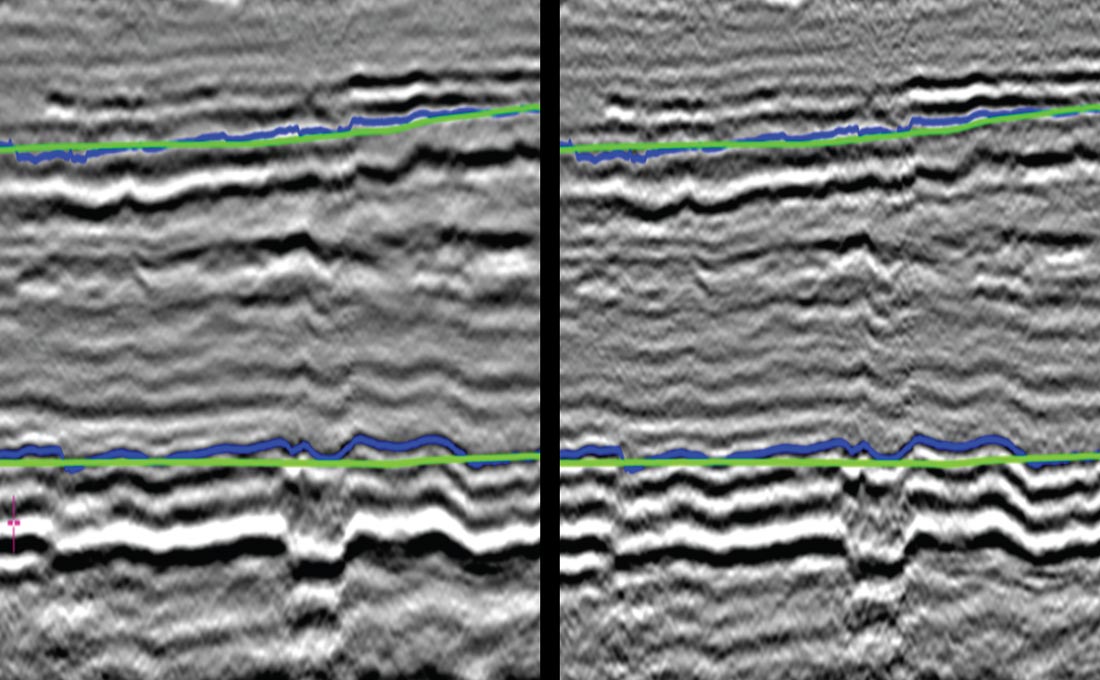
The primary objective of this project was to generate a seamless merged volume of ten coarsely-acquired narrow azimuth seismic surveys for regional interpretation. Whilst the project is still underway, the intermediate QC image shown in Figure 6 demonstrates that the project objectives have already been realized. Naturally, our expectation is that the final imaging will be even better!
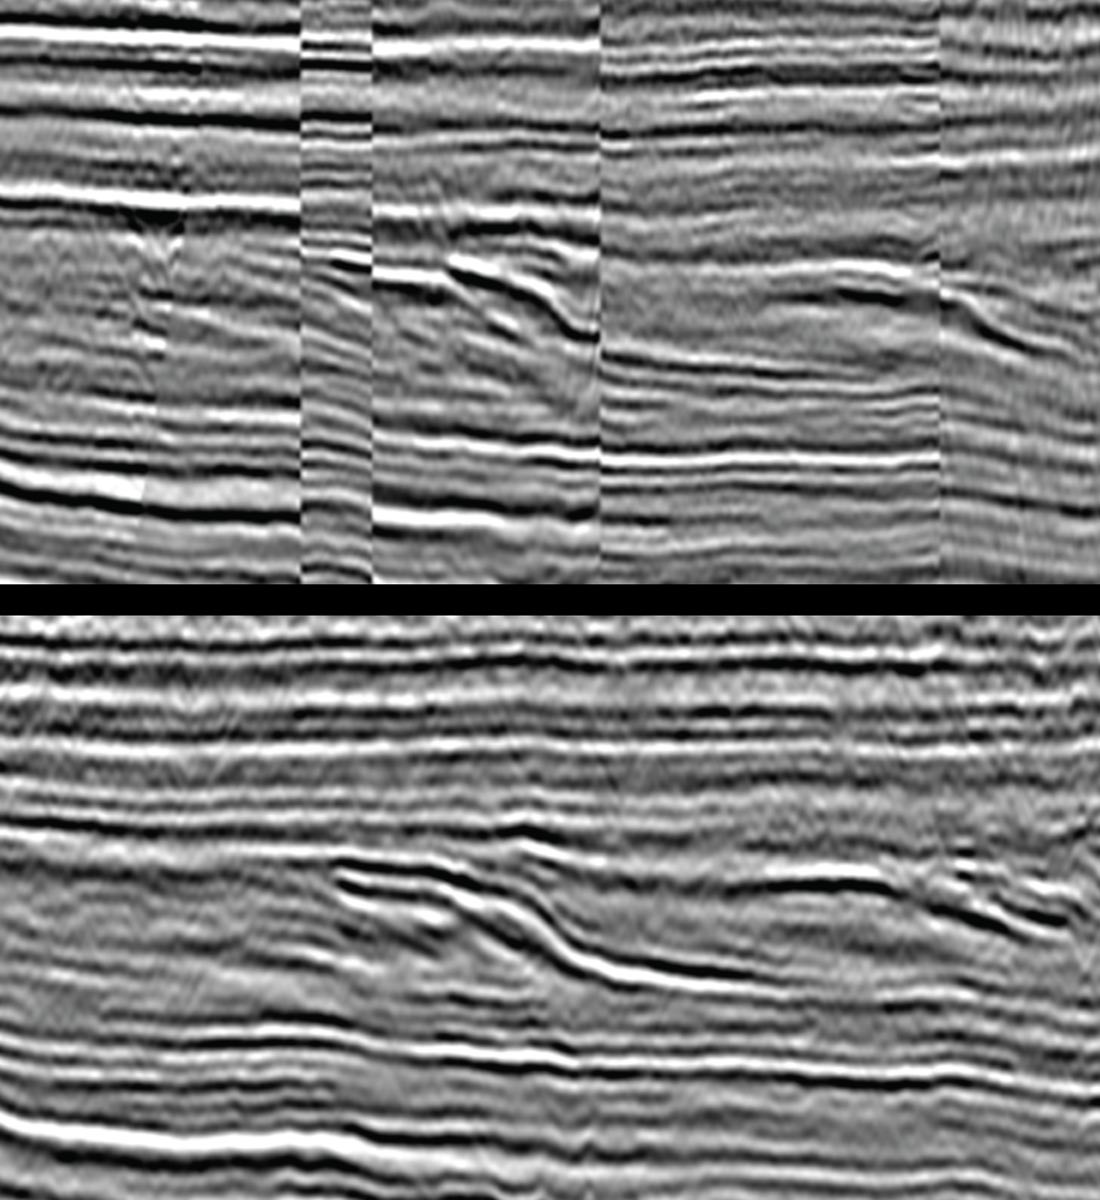
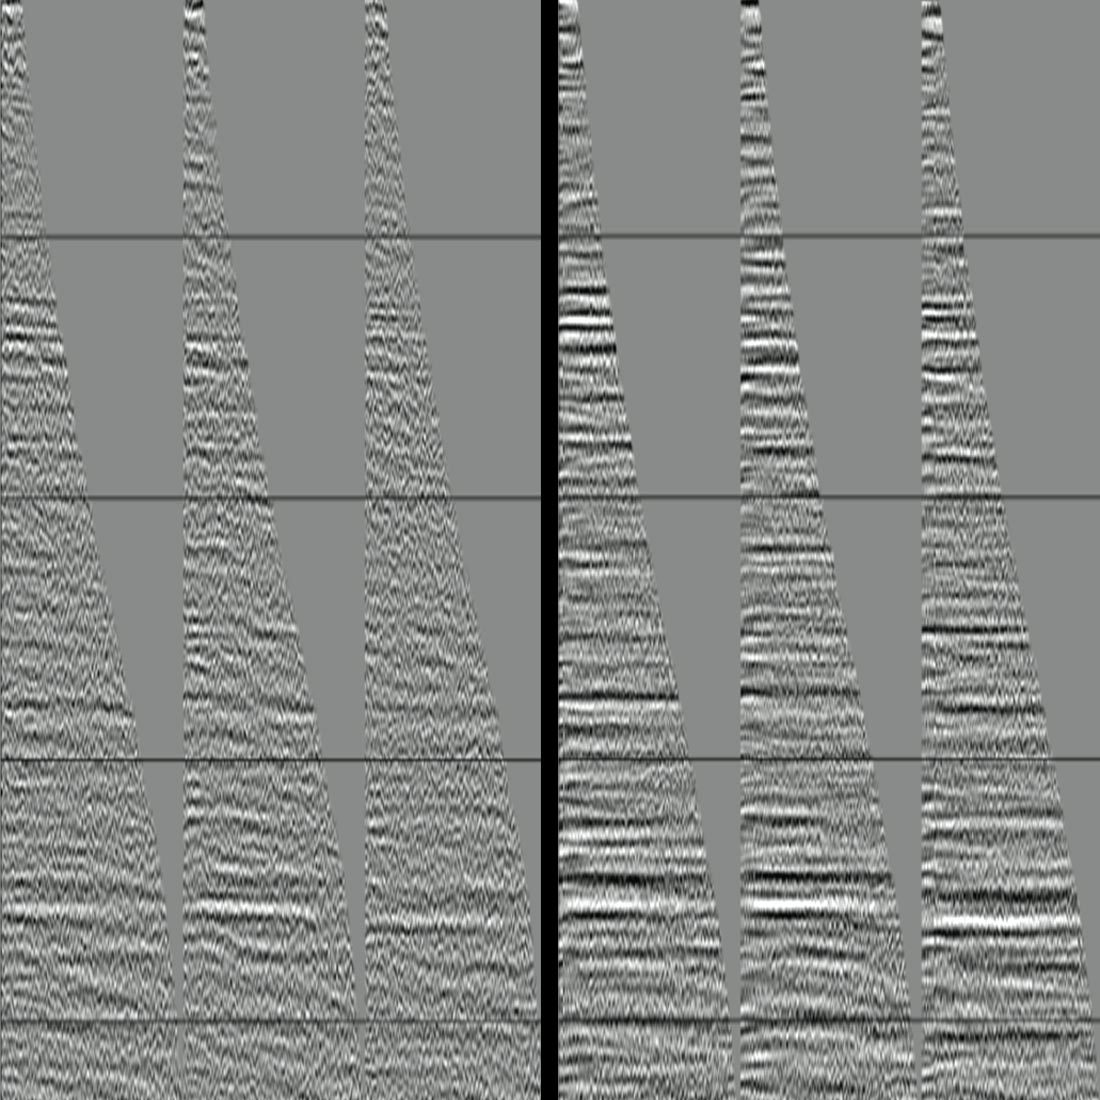
Example 2: From a 3D acquired in a very noisy data area
Our second example comes from a reprocessing project in an area characterized by strong near-surface shot generated noise, where the seismic was acquired with a relatively modern high fold acquisition design. Careful reprocessing, using an up-to-date workflow that takes advantage of the multiplicity of the data, has yielded significant pre-stack and post-stack image improvements (Figures 7 and 8 respectively). The pre-stack improvements are particularly important as we take this data into reservoir characterization studies.
Opportunities for future imaging improvement
You need go no further than to open the pages of the current edition of Geophysics to see that most imaging research is focused on improving migration imaging technology (RTM and LSM) and velocity model building (FWI). These techniques are slowly maturing, and are already having an impact offshore. Onshore imaging is considerably more challenging, due to noise, statics, multiples and other factors, and it will therefore be a while before these techniques are applied during standard onshore processing projects.
In the meantime, I recommend processing companies develop ‘optimal stacking’ workflows to improve onshore imaging. Optimal stacking workflows have significantly improved deep water subsalt images, as discussed by Manning et al. (2007, 2008), Tyzon et al. (2015) and others. I see no reason why we cannot develop semi-automated optimal stacking workflows that take advantage of offset and azimuthal variations in the signal-to-noise ratio to extract higher fidelity images in noisier parts of the Permian Basin, particularly when our data has been processed using offset vector tile binning schemes.
Summary
The seismic data we use on a daily basis for well planning and investment decisions should not be considered as a static resource. Rather, continual improvements in the seismic processing workflow which creates the images we interpret in support of billion-dollar investment decisions year after year, requires us to consider seismic data as a dynamic resource.
Recent seismic reprocessing projects reveal material imaging improvements over time frames as short as 3 to 5 years from the date of delivery of the previously processed seismic volumes.
Acknowledgements
Many thanks to:
- Our valued seismic data processing partners who generated the improved images shown in this article – DUG (Houston), Fairfield- Nodal (Houston), NEOS (Denver) and WesternGeco (Denver).
- Seismic data owners (FairfieldNodal and WesternGeco) for permission to show their data.
- Occidental: I am most grateful to Occidental for creating a workspace staffed by extremely competent technical and managerial professionals which enables me to work with our processing partners to develop better onshore imaging workflows. Many thanks to Occidental’s Chief Geophysicist, Klaas Koster, for his support and guidance; and to Occidental for permission to publish this article.


Join the Conversation
Interested in starting, or contributing to a conversation about an article or issue of the RECORDER? Join our CSEG LinkedIn Group.
Share This Article