Geophysics rocks! If you are a geophysicist and you’re reading, this you know what geophysics can offer, but does your team know that too?
It is fair to say that over the past ten (10) years, the E&P industry has seen a step increase in seismic acquisition and processing, especially with respect to onshore unconventional plays. These advances in geophysical techniques have proven to be valuable and reliable tools which result in recoverable resources and reserves. The advances however drive the need for integrated solutions to accomplish the objectives of maximizing well performance deliverability and recovery rates. As you have seen in many of the articles published in the VIG edition of the RECORDER, the reliability of these integrated approaches has made tremendous improvements in reducing uncertainty and enhancing accuracy.
However, the application of integrated techniques varies dramatically from company to company and from play to play, each with varying results. So how reliable have we proven geophysics to be?
With unconventional resource plays, searching and producing hydrocarbons is largely driven by engineering initiatives. As it is expensive to liberate the hydrocarbons using horizontal drilling technology and fracking, cost cutting measures often dominate the business climate, with any expenditure often facing tough economic hurdles. Heck, almost every aspect of the E&P industry is facing tough economic hurdles right now. With the current low oil price environment, even oil sands developers and unconventional oil based resource play companies will face difficult economic hurdles. Some exploration and development companies have retreated from some of the tight oil and gas reservoir plays or they have diluted their working interest, to share the burden of financial investment and / or marginal return on the investment. But industry still moves forward with great strides in plays previously thought to be commercially uneconomic. Unconventional oil or gas plays share an advantage. The resource is known to be present. There is little to no risk associated with discovery. The risk is more weighted to the financial feasibility of horizontal drilling and fracking techniques despite the downward trends in cost recently. This cost cutting mentality has often led companies to oversimplify the sub-surface and base decisions on homogeneous formations and not use enough integrated geological and seismic derived products to say otherwise. Corporations wanting to beat industry type curves for production will do their technical homework, looking for new insights to help predict reservoir heterogeneity and optimize their drilling or completion techniques. After all, beating the type curve for production is one way to become an investor darling on Bay Street. Yet, despite the obvious benefits of doing this sub-surface homework, have the achievements resulted in optimization of resources and reserves additions? Have there been a few surprises along the way? What have we learned? And what do we need to do to improve?
Content
The use of geophysical data, referring mostly to seismic data and its derivative products for this article, is an integral tool in the petroleum industry’s toolbox, used to evaluate the quantity and quality of oil and gas available from exploration to full production. It is also used in conjunction with other disciplines to perform detailed reservoir characterization of a producing field. This means all geophysical, geological, petrophysical and engineering data need to be integrated. This does not diminish the importance of potential field data, magneto- telluric, spatial data, LIDAR data or any other geophysical methods in a more regional setting, however the seismic method is still the predominate method used to more exactly delineate the resource and best mitigate drilling risk. It is imperative that subsurface experts understand the complexities associated with the five (5) key geological risk factors of source, migration, trap, reservoir and seal. Understanding these key risks and mitigating them, is key to a successful exploration or development programme as it permits well-informed investment decisions. Geophysically, our challenges are only getting more and more complicated. We are always being challenged to create images of the sub-surface that are clearer, less ambiguous, and with thinner and thinner vertical resolution expectations. In the March 2015 VIG edition of the RECORDER, David Gray’s article, Rock Physics Driven Seismic Data Processing for the Athabasca Oil Sands, Northeastern Alberta, as well as Lee Hunt et al’s paper, Value Oriented Quality Control in Seismic Processing, both illustrate the need to tailor processing techniques towards specific interpretation goals drastically improving the relevance and reliability of seismic. Whether our challenges are onshore or offshore, we are constantly asked to do more with less, collapse cycle times associated with acquiring, processing and interpreting seismic data and provide more definitive results. Geophysics can and has reduced risk and uncertainty through increased image clarity and accuracy, not just in an exploratory or development mode, but as a tool to describe and characterize a resource on a reserve audit basis.
So, how do we do that in our everyday work? How do we get this message out there? How do we educate other related disciplines and business professionals? Lee Hunt’s March 2015 RECORDER article, Articulating the Time, Cost, and Benefits of a Seismic Processing Project, sheds some light on this issue when he expresses the importance of conveying the seismic project as a business investment proposal.
Readers beware! This article does not pretend to suggest a workflow for data integration but instead attempts to share some examples of previous work that showcases the value added using geophysics.
These examples can be divided into conventional and unconventional plays and they are taken from the CGF reserves document and other public domain resources to reinforce how integrated geophysical data products adds value and how reliably they contribute to producible reserves. Discerning where and when these techniques are suitable for a specific issue or problem is key to the effectiveness of the methods deployed. Fortunately, there is more than one way to address the issue in order to add value.
To quote from the CSEG CGF’s document on Geophysical Applications – Using Geophysics for Hydrocarbon Reserves and Resources Classification and Assessment, “Many workflows are deterministic in nature and are still valid for resource and reserve determination so long as there is some assessment of uncertainty. Probabilistic methods such as stochastic simulation use random sampling of a repetitive process to calculate multiple deterministic realizations from which the uncertainty of the property being modeled is defined.”
To quote the CGF reserves document, “Geophysics, particularly seismic, allows interpolation between wells with greater confidence because it has good areal coverage; however, in its most commonly used form, its vertical resolution is restricted by the bandwidth of the seismic wavelet. All-in-all, geophysical data can provide a huge improvement over maps made with wells only, thereby decreasing uncertainty. Newer methods, such as stochastic inversion and spectral decomposition attempt to redress the vertical resolution of seismic methods. Note how the poor areal coverage of well data is complemented by the larger areal sampling of the geophysical methods”, Figure 1.
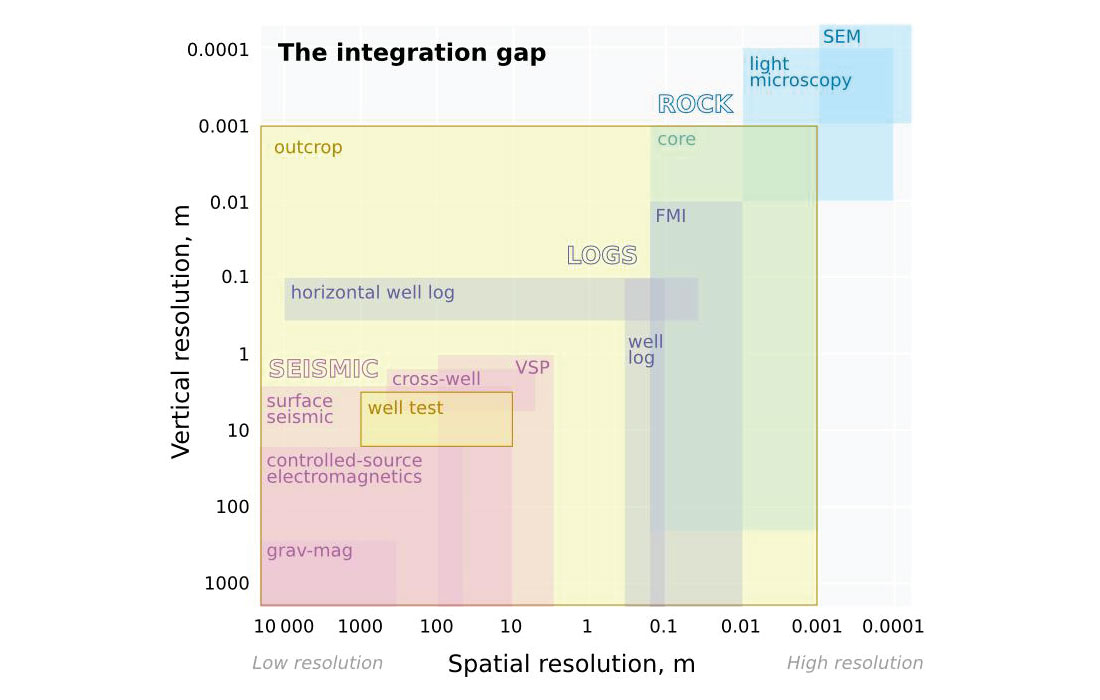
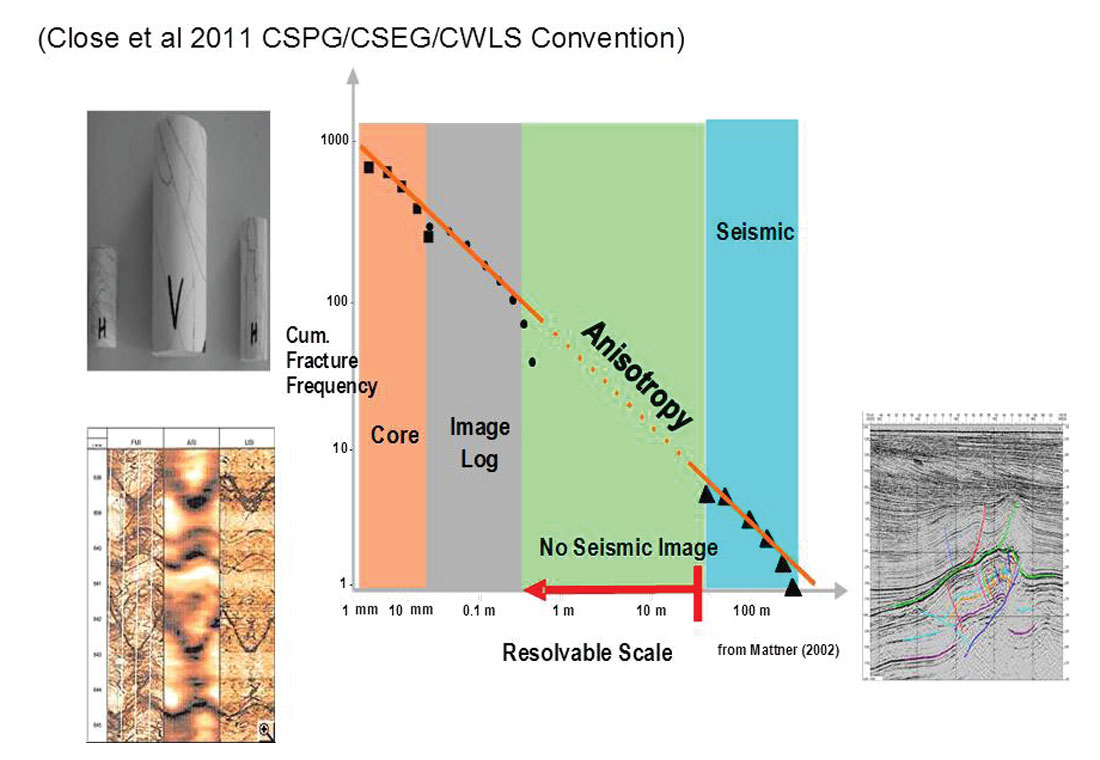
Another example of spatial resolution is illustrated in Figure 2 which shows the relationship of anisotropy as seen in core versus seismic scale.
A further quote from the CGF Reserves document indicates that “Prediction of natural fractures from seismic calibrated to well data is essential to optimize development of fractured or stressed reservoir plays and to aid in estimation of EUR (estimated ultimate recovery).”
Knowing what the differences are amongst the scales of the data used in any capital project can help us to understand the risks and uncertainties for that investment.
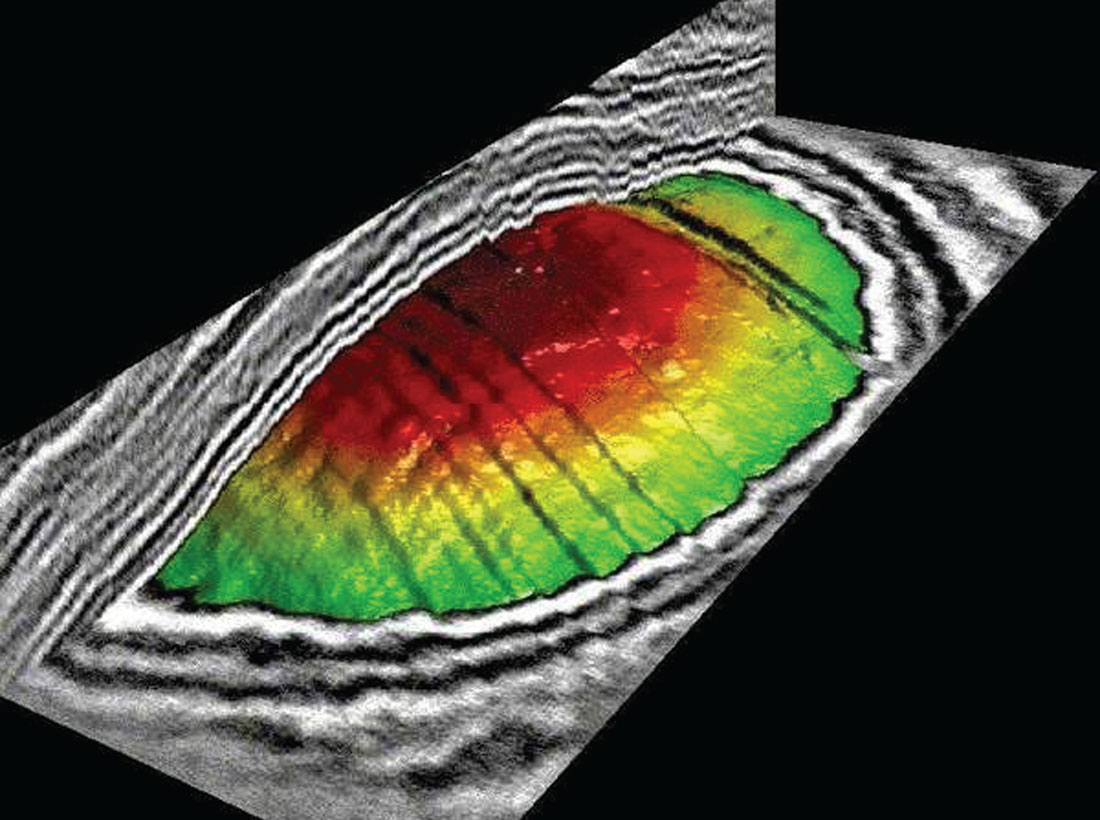
In conventional plays, geophysical data is often the first product used to map and define a potential trap with well data tied to the interpretation. Well cross sections in-filled with seismic data helps to complete the interpretation gaps with a higher degree of clarity. The use of seismic amplitudes, isochronal mapping and isopach mapping are often methods that accompany that workflow. This can be done with 2D and 3D seismic data. 3D data is often used for the full detailed analysis because of its spatial sampling. Ultimately, when a trap is defined and deemed prospective, the next step in a workflow is to determine its size by determining gross rock volume (GRV). Figure 3 illustrates a good example of a faulted anticlinal structure that can be used for that GRV estimation.
Many factors surrounding the seismic and well data can affect the interpretation outcome. There are uncertainties inherent within the well logs, seismic data acquisition and processing that involves data integrity. This necessitates having a handle on those uncertainties with the well and seismic data, be it the accuracy of the accompanying spatial survey data, seismic bandwidth, resolution, attenuation, anisotropy, velocity and their variations, for increased reliability. Reservoir characterization and seismic inversion analysis is an important part of that further work to define both lateral and vertical variations within the target reservoirs. Seismic inversion often reflects a non-unique solution but utilizing a stochastic approach can help to capture the possibilities and assess the range of probabilities. This will be demonstrated by Fred Mayer in his paper in the May 2015 issue of the RECORDER, Resistivity and Density Estimation from Multicomponent Seismic Data: Case study from the Lower Cretaceous McMurray Formation, Athabasca Oil Sands, when he illustrates how PP-PS inversion for density and resistivity are tested and verified to produce superior reservoir characterization products.
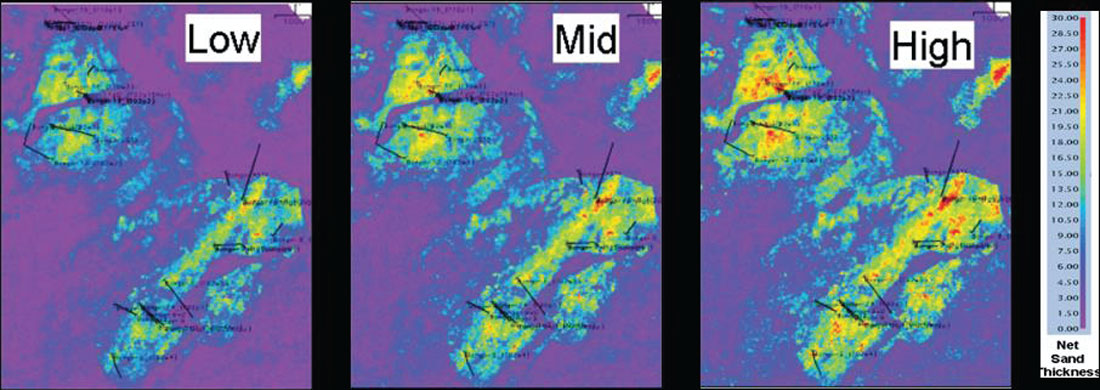
Figure 4 is also an example from the CGF document and it shows a probabilistic output from a seismic inversion illustrating a low, mid and high net sand distribution based on seismic mapping and well data. All three maps are constrained by the well data in their respective outcomes. On a prospect basis, these three maps help to define the thickness of sand for the P10 upside potential, the P50 case and the P90 case that is most likely certain. On a reserves basis, these three maps define the level of certainty associated with the P10/P50/P90 probability of a reserve being present.
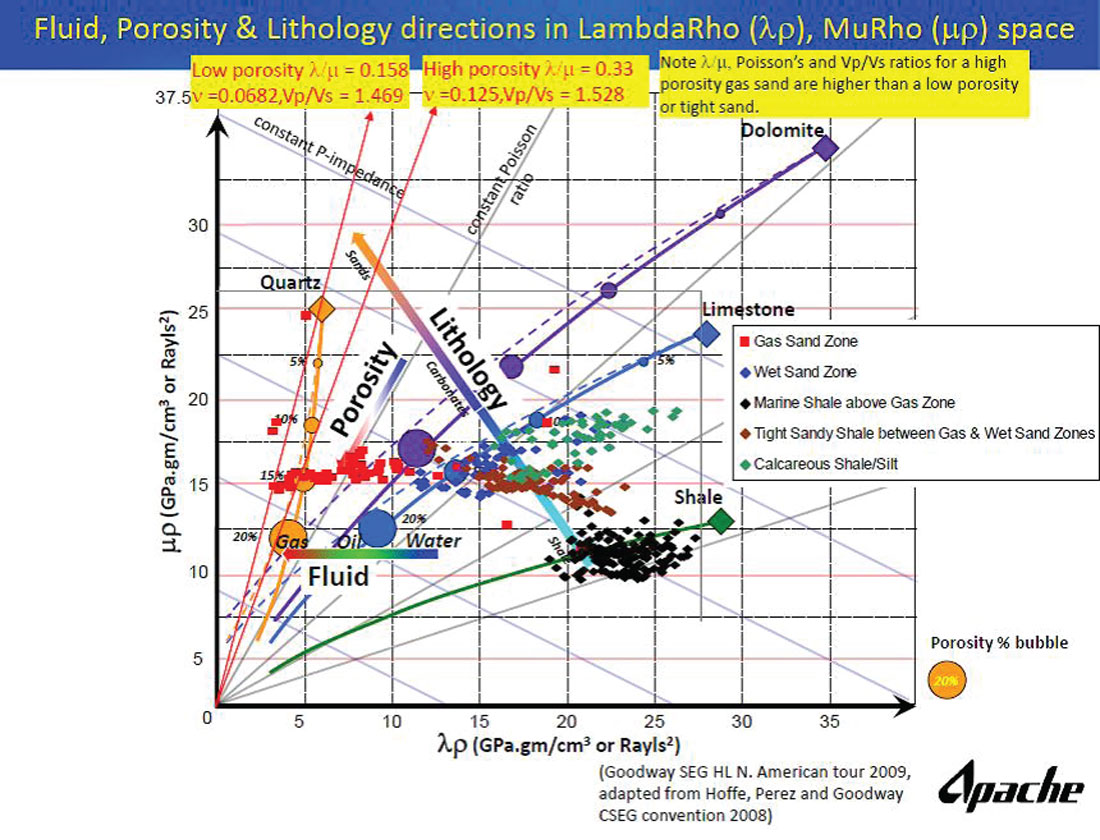
Further work into elastic properties estimated from well and seismic data will continue to evolve as industry improves upon technology. Figure 5 is an example from Bill Goodway’s work indicating the ability to cross plot data for fluid, porosity and lithology utilizing LambdaRho and MuRho space. Many rock properties can be derived using petrophysical well and geo-mechanical methods to describe rocks in many ways. Parameters such as density, acoustic impedance, MuRho, LambdaRho, Poisson’s Ratio, and Young’s modulus, are but a few of the ways rocks can be described and analyzed. These properties can be calibrated to seismic data to create derivative products and ancillary seismic volumes for interpretive purposes. This level of interpretive sophistication requires integration of geology, petrophysics and geophysics.
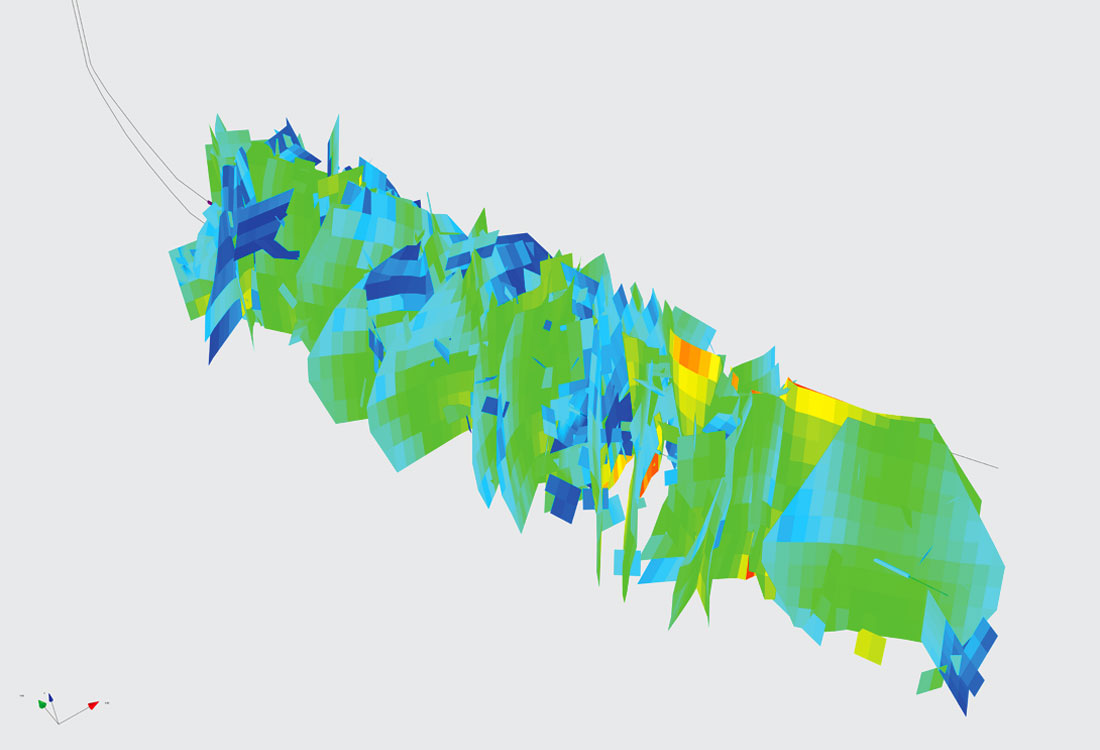
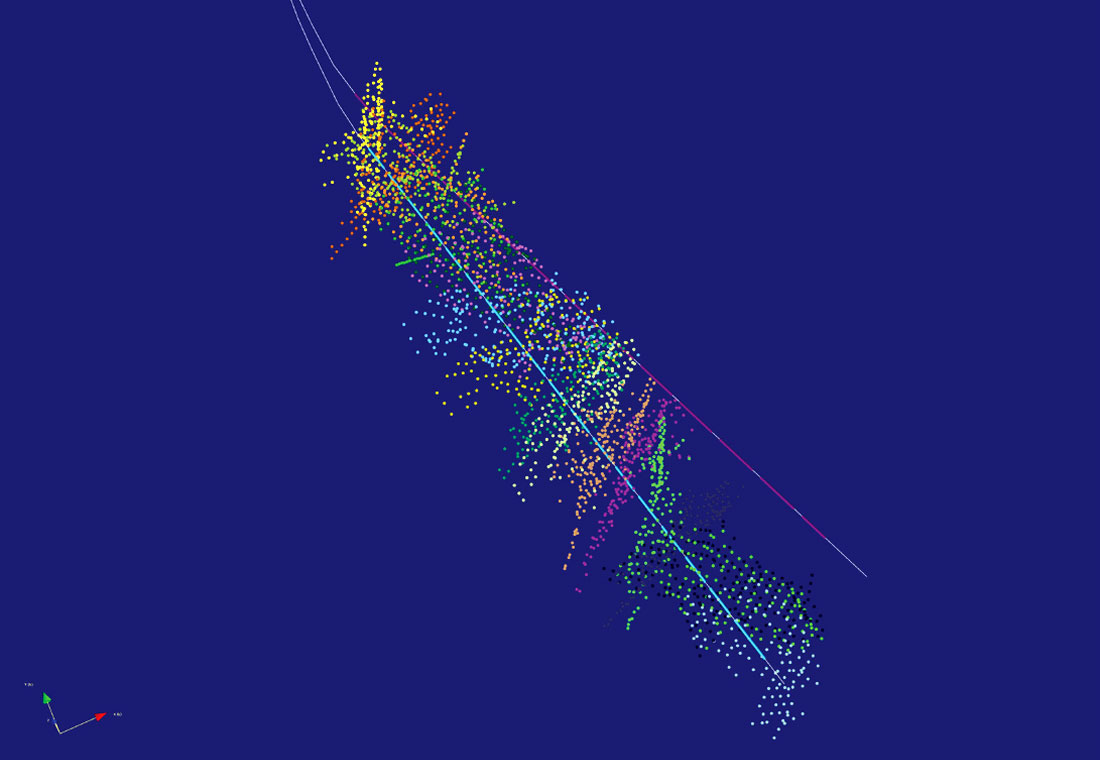
Simon Emsley et al in SPE171608-MS shows that an enhanced understanding of reservoirs, their performance and completion strategies can be achieved through the integration of data that allows for forward modelling and optimization of well design. Simulation of the completion process allows for the analysis of stimulated rock volume (SRV) and the computation of drainage volume and the storage aperture; the later may be considered as a proxy for propped volume. It is considered that an SRV estimated based on the size or extent of the micro-seismic cloud is an overestimate and that the drainage volume estimates may be more representative of the producible part of the resource. Figures 6 – 10 are from the Marcellus play. Figure 6 illustrates storage aperture from forward modelling of a hydraulic fracture stimulation process; where the warmer colours show higher values and may be indicative of larger propped volumes. This modelling also allows for the simulation of micro-seismic event generation and an example of this can be seen in Figure 7; which shows the results for one well where the real pumping parameters were used in the simulation process. The events are coloured by stage and shows that there is a lot of overlap from stage to stage; in some cases the events generated by one stage completely overlap the events generated by the preceding stage. This implies that stages could be placed further apart which should have resulted in the same stimulated rock volume for less effort and cost. This is particularly the case in areas where the local stress direction has rotated and is no longer at right angles to the well. The events also show the curvilinear nature of a lot of enhanced, generated and natural fractures.
These events are coloured by stage and show that there is a lot of overlap between stages. Therefore the stages could have been placed further apart resulting in the same stimulated rock volume, thereby saving money for the same production level. Perhaps lower pump pressures or a lower volume of fluid could have been used to more cost effectively fracture the reservoir. This insight could substantially lower the number of wells drilled and positively impact project economics.
Fracture characterization can be imaged in the P-wave domain by correcting for HTI anisotropy and in the S-wave domain by shear wave splitting. These seismically driven, geologically calibrated products are not only important for tight reservoirs. This technology can be applied in a multitude of areas such as caprock integrity, waste water injection into potentially fractured reservoirs; not just to find and develop hydrocarbons. The list goes on as industry improves and uncovers more unanswered questions.
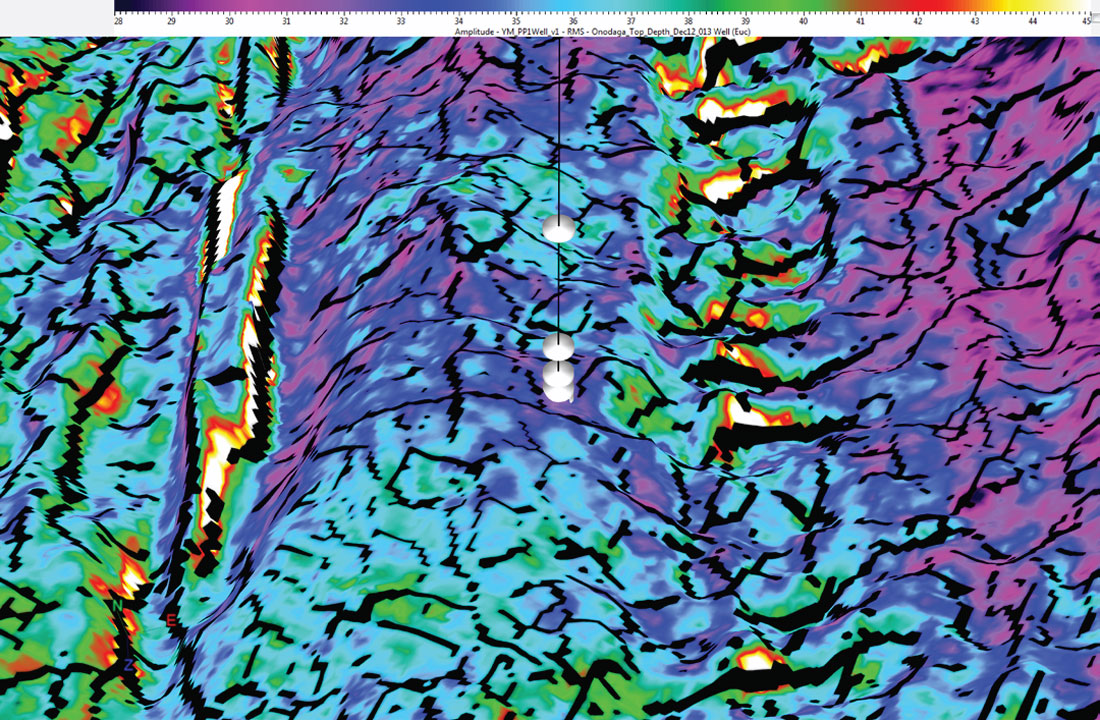
Figure 8 from the same Marcellus data indicates shear stress from seismic data to evaluate fracture information. Stress prediction provides important information for lateral well placement. This map shows a low stress profile (cooler colours and short azimuth vectors) within an anticlinal target. This type of analysis can be important for well placement, the number of wells needed and the type of fracturing.
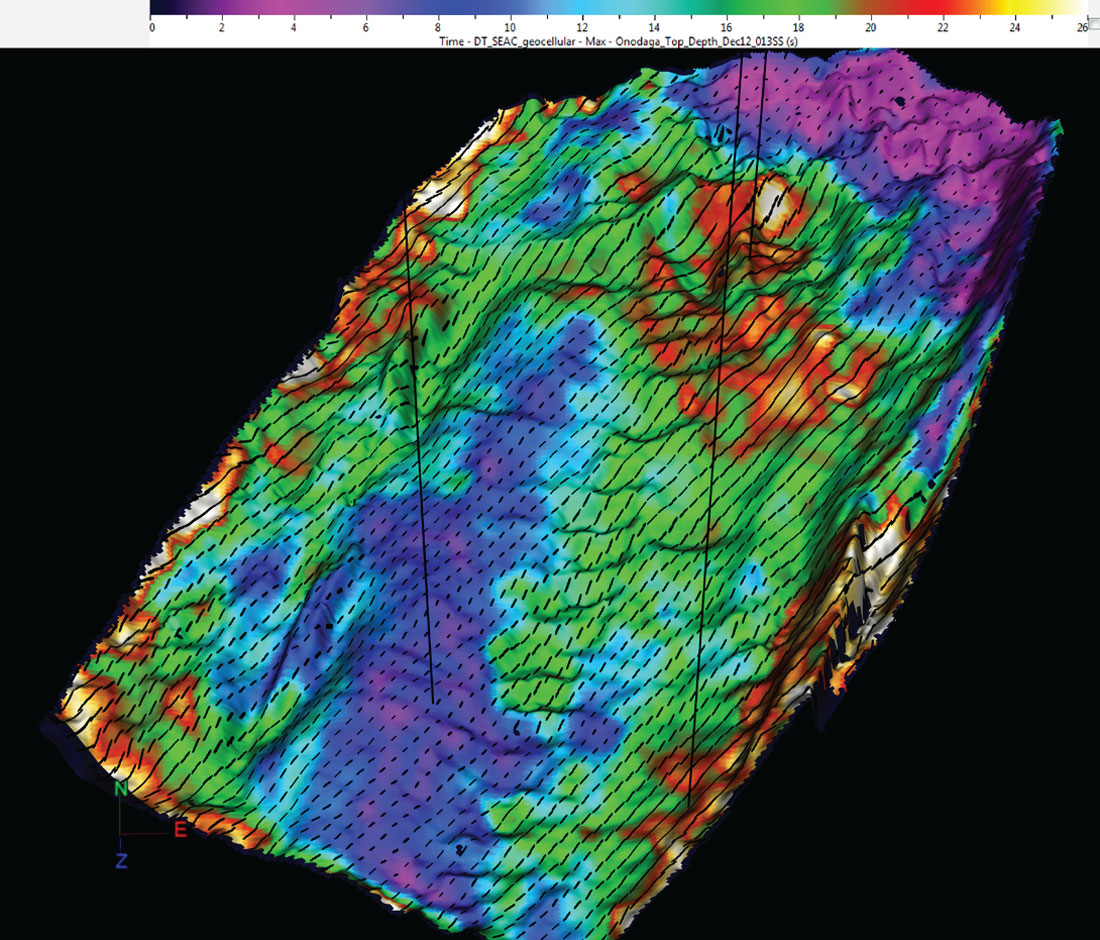
Figure 9 illustrates the calculated Young’s Modulus or the elastic modulus which is the measure of stiffness of an elastic material and defined as the ratio of stress to strain. The well trajectory indicating Poisson’s Ratio is a measure of the relative contractional strain to the extensional strain. The rocks within this reservoir possess local stress variations that have altered the rock properties. This has an implication to frack design and well completion as rocks within one stress regime may respond differently to rocks within another stress regime.
Taking the anisotropy and stress direction to the next level of calibration can be seen in Inks, et al URTeC 1922505 paper, Comparison of Marcellus Fracturing Using Azimuthal Seismic Attributes versus Published Data from Outcrop Studies.
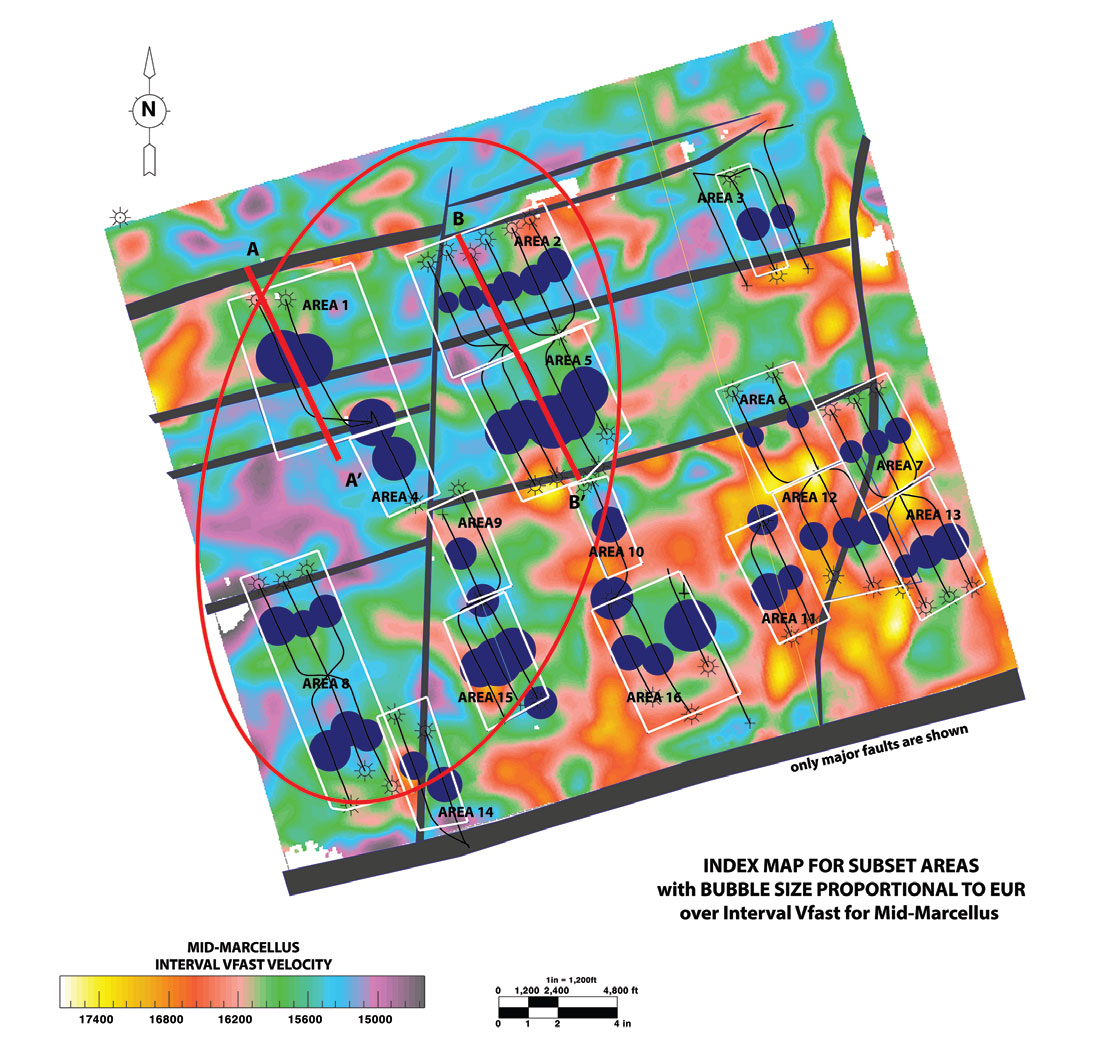
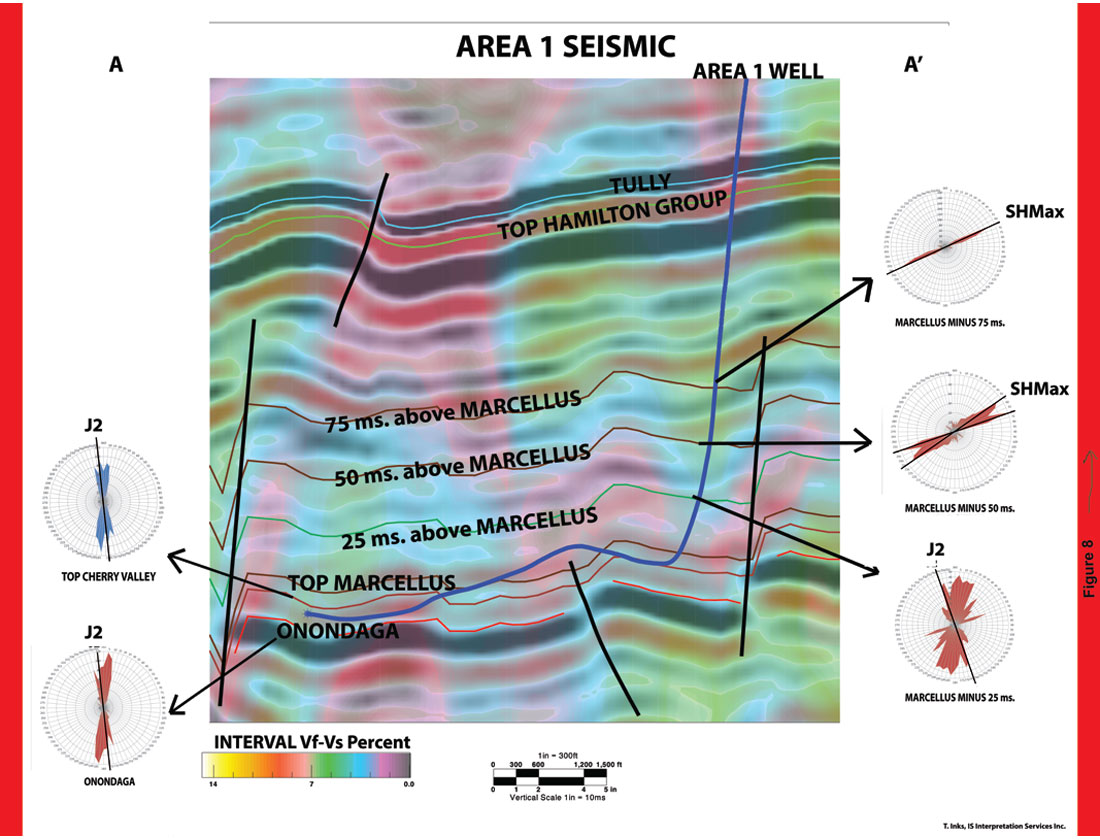
For this Marcellus study, Fig. 10 shows that the Interval Vfast velocity is generally low in the area with higher EUR (represented by larger bubbles.). Area 1 has the highest decline gas EURs and may be showing a strong influence from J2 joints above the Marcellus which have been attributed to more prolific gas generation, open fractures, and higher TOC. Seismic cross section A-A’ (Fig. 11), rose diagrams for the Onondaga, Cherry Valley, Marcellus and 25 milliseconds (ms) (~61m = 200 ft) above the Marcellus show lower anisotropy overall and an azimuth of Vfast in the J2 direction. From 50 milliseconds above the Marcellus and shallower intervals, the azimuth of Vfast shows a NE trend, which is in the range of azimuths attributed to the direction of the current maximum stress, SHMax. It can be shown that areas with better production have lower Interval Vfast velocity, a dominant azimuth of J2 and less heterogeneity, while areas with lower EUR have higher Interval Vfast velocity, mixed azimuths and more heterogeneity.
Conclusions
There is a plethora of technical articles on geophysical applications so this article doesn’t pretend to be an exhaustive example list. But some good questions to consider are:
- Are we getting the message about the value of geophysics out to our asset teams, other professionals, other professional societies and publishing in additional technical publications? Some folks are already doing this but what are we contributing with our technology, and capabilities?
- Have any of us submitted something to be published in APEGA PEG magazine? What is each of us doing to spread the word about the reliability of geophysics?
We haven’t done enough yet, but the authors and contributors to the VIG are trying hard to do more. For instance, we intend to send an amalgamation of this article and the previous The Value of Geophysics: From Prospecting to Reserve Audits (February 2014 RECORDER, vol. 39, issue No. 02) to the SPE’s JPT and the APEGA PEG publications to further our reach. We’re probably not doing ourselves any favours if we just publish in geophysical journals and not in other cross-professional journals. But don’t stop there. Publishing is not the be-all and end-all. It’s just another form of the all-important conversations that need to happen more regularly than not within oil and gas companies every day.
It would be nice when we get to the point where team communications on a project or collaboration on reserves and resource evaluations within an asset team are not just referencing engineers and geologists. While success can be measured by analyzing project economics on a netback basis, success can be measured at a human interaction level. It is when the drilling operations guy walks into your office and asks you to pull up that coherence / semblance volume so that you can both double-check to see where that fault is located because he had to skid the surface location. Perhaps it is when the completions engineer walks into your office to see what type of Poisson’s Ratio rock you landed in this time. When these types of interactions are occurring regularly, that’s an indication that geophysics is playing an integral role within a project.
We need to not only stand up and be counted but also deliver on increasing reliability as geophysicists. So when your team member or manager says something like, “Is that right? Well, prove it to me”. Don’t take that as a personal threat but as an opportunity to share and improve upon what geophysics can do in the integrated solution to improve reliability. Keep looking forward; envision great strides in geophysics and work to make it happen for you and the industry.


Join the Conversation
Interested in starting, or contributing to a conversation about an article or issue of the RECORDER? Join our CSEG LinkedIn Group.
Share This Article