(This is the third part in a series of articles written looking at price changes for oil, the unconventional plays, and now it looks at the price of natural gas and the demand for it. The first two parts are: “Oil below $20 USD per barrel – what caused this?” and “What’s the Future for North American Oil and Gas? A Perspective”.)
We acknowledge that the scope of this paper may include some forward-thinking ideas some may disagree with. We welcome your insights and perspectives. It’s precisely the fact that so many variables, most of which are uncontrollable, some unforeseeable (e.g., COVID-19), makes working in and following the world’s most important industry so fascinating for so many of us. Thank you for your interest.
Abstract
Natural gas prices in 2020 have been hammered. A warm winter globally in 2019-2020 saw minimal withdrawals from full storage in the U.S. A similar glut in Europe and Asia has affected the liquefied natural gas (LNG) market and has caused cancelled orders in June, July, August, and September. Not surprisingly, the price of LNG to Japan fell to $2.2 / McF in May 2020 (U.S. Energy Information Administration (EIA), 2020a).
Myriad factors have converged to drive the price drop - oil demand is down, as are oil prices. Oil and gas wells are shut in, drilling in many areas has come to a virtual standstill (the prolific Powder River Basin of Wyoming reported no rigs running for a period in August), and the decade-long profitability and resulting debt struggles of many companies now have some declaring bankruptcy or unable to drill and complete due to cashflow issues. All this has caused the amount of natural gas exported from Canada to the U.S. to decrease by 1.0 BcF/d, while the amount of gas production in Canada has dropped by 1.29 BcF/d.
U.S. natural gas production has decreased by 7.8 BcF/d of gas (EIA, 2020b) and there has been a drop in the importation of natural gas through LNG and pipelines of about 0.9 BcF/d. Combining all these factors creates a 8.7 BcF/d drop, which is significant.
Atop challenging market conditions, there are political concerns as well as the U.S. and Canada move towards reducing the amount of greenhouse emissions to meet the Paris Accord (acknowledging that, as of the summer of 2020, the U.S. is not a signatory). Policies incentivizing broader use of renewables have some predicting a global peak for natural gas around 2030.
Europe is moving towards a hydrogen economy, driving expectations for increased demand for hydrogen or ammonia as a fuel. This will cause an increase in the demand for LNG especially as Asian nations such as China, South Korea and Japan follow suit.
Further, in the geopolitical arena, the U.S. and Canada continue to compete with Russia and the Black and Caspian Seas for European gas markets, while in China we have competition from a pipeline from Siberia to China and from Central Asian gas-producing nations.
We also see India expanding into the use of natural gas for energy as it improves its gas infrastructure and strives to reduce emissions. India is investing $60 billion in gas infrastructure, including setting up cross-country pipelines and LNG import terminals to connect gas-starved regions to supply hubs (Verma and Mukherjee, 2019).
Turkey and Russia are having difficulties in Syria and Libya causing Turkey to consider U.S. as a source for LNG rather than Russia, who has built pipelines into Turkey to provide them with LNG.
Going forward, the drop in production, a La Niña winter, and hope for economic recovery lead many to predict stronger prices in 2021.
Introduction
As noted above, many variables make predicting natural gas prices exceedingly difficult. We will look further into those variables below. We hope to show how complex it is to predict the price of natural gas leading to difficulties to manage assets and resources.
For instance, there is a degree of interdependency between the Canadian and U.S. markets. Both countries are both producers and consumers of each other’s natural gas. Both are amid a transition in energy with considerable headwinds - pressures to conform to the Paris Accord, investors upset on the return on investment with many unconventional operators being cash flow negative and carrying large debts, and pressures to reduce our impact on the environment. How we manage our assets, resources and public debate during this transition is key to the survival of the companies we work for and the industry.
Downturn 2020
A warm winter globally in 2019-2020 stunted natural gas demand so withdrawals from storage were low compared with previous years. Gluts in Europe and Asia were exacerbated by the COVID-19 lockdowns. Even attempts to export natural gas with pipelines to Mexico and Eastern Canada and efforts to bolster LNG exports did little to reduce this global glut (Richter, 2020).
Looking at natural gas drawdowns from storage (Figure 1) we also see the United States has three seasonal peaks (EIA, 2020g):
- Winter months, where the wintry weather leads to more demand for heating in the residential and commercial sectors.
- Spring-fall months, both considered “off-season” for demand due to milder temperatures and thus periods for replenishing storage. It is also referred to as the “shoulder season” because demand for electricity for air conditioning is declining, but the heating demand is not there (Paraskova, 2020d).
- Summer months where hot weather drives demand for air conditioning and, in turn, more demand for electricity generated by natural gas. In short, winter and summer are drawdown periods in the U.S., with replenishing stores occurring during the spring and fall.
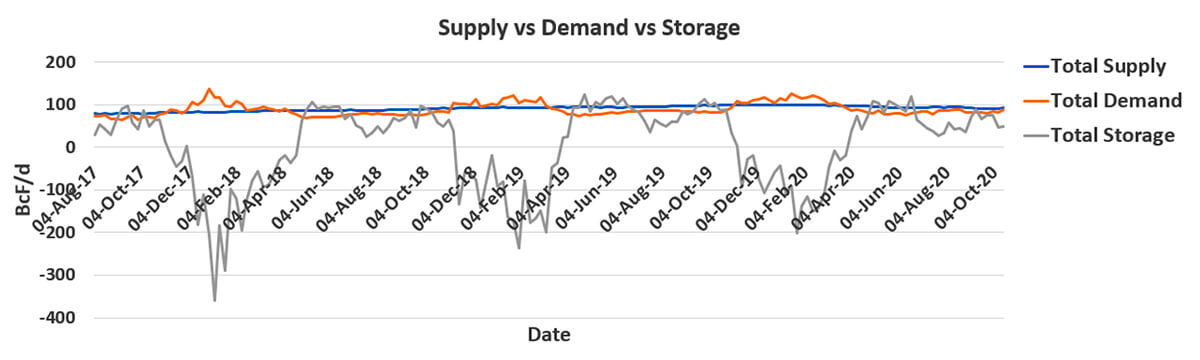
Just like oil, if the storage runs out, the price of natural gas will fall. The impact of this was on full display this spring when oil prices went negative on April 20.
This glut formed due to many unconventional operators drilling oil wells at a rapid rate to maintain or increase their oil production due to 70% of the well being depleted within the first year of production (Schulte, 2020), and with these oil wells there was associated natural gas but there has been a lack of pipeline capacity exiting these basins.
The abundance of natural gas in these oil basins has also driven down the prices nationwide especially in the Marcellus and the Utica formations which has caused major players like Chevron to pull out of the Marcellus and Utica shale plays (Phillips, 2019).
As the price of natural gas began to fall, operators began to move away from dry gas assets towards liquid- rich gas for the natural gas liquids (NGLs) and condensate or pentane+ which is used as a diluent for heavy oil in Canada. The price differential between NGLs and dry gas boosted their profitability (Dewar et al., 2019).
Pipeline capability, negative prices, and flaring
Without pipeline capacity, the prices for natural gas have become negative in some areas like the Waha natural gas trading hub in the Permian Basin, because operators need to either pay others for space on existing pipelines or stop drilling or to flare the gas. Most do not want to stop drilling because of the price of oil though they do know they don’t have the capacity on the existing pipeline to deal with the natural gas so they opt to ask from the Railroad Commission of Texas permission to flare.
It is this lack of pipeline capacity that is the underlying reason why there has been an increase in flaring in the Permian and other oil basins (Robinson, 2020). Already we expect flaring in the Permian to increase even more with the delay in the building of new pipelines such as the Pecos Trail and Permian to Katy pipelines due to the downturn (Cunningham, 2020).
Flaring
Those that tend to flare are smaller operators who have a limited budget and are more concerned about producing the oil which fetches a higher price. Operators in these oil-rich basins should include in their plans to drill a rigorous well and site design to minimize over-pressurization of tanks and takeaway gathering lines, commit capital and pre-planning to make sure wells either have access to pipelines or onsite strategies for using associated gas in their operations to minimize their flaring (Layden, 2019).
With many advocates against the oil and gas industry due to the amount of greenhouse gases (GHGs) we emit and to reduce this, we need to look closer at flaring. Companies like BP, Shell and Total have signed onto a pledge to eliminate routine flaring worldwide by 2030.
The Canadian oil industry has reduced its carbon footprint through regulations inhibiting the venting and flaring of natural gas. If the entire world adopted Alberta’s regulations, it would cut the GHG emissions from the oil and gas industry globally by 23% (Weber, 2018; Schulte and Lyatsky, 2019).
Shut-ins 2020
Currently, two-thirds of U.S. dry-gas production comes from unconventional oil plays in the form of associated gas (Dewar et al., 2019). The precipitous fall of oil prices in 2020 prompted fast and widespread shut-ins, causing declines in the production of natural gas.
Factors in natural gas pricing
With natural gas prices untethered from the price of oil, the price of natural gas now depends upon:
- Production or supply
- Demand (commercial, industrial, residential, power generation)
- Availability of pipelines
- Storage space
- Weather
- Seasonality
- Demand for export (LNG and pipelines)
Push to meet the Paris Accord
With many nations trying to meet the Paris Accord to reduce greenhouse gases emissions, there is a drive to move towards electric vehicles (EVs) and hydrogen-fueled vehicles. The impact of the policy has some projecting the oil demand will peak around 2035; demand for natural gas remains to be seen.
Regarding renewables, it is expected that two-thirds of the electricity will be generated from renewables such as hydroelectricity, solar, wind, geothermal, and biomass. In the U.S., in 2019, 62% of electricity was generated by fossil fuels (38% natural gas, 23% coal, 1% petroleum: EIA (2020h)). It is also expected many other nations will also look to increase the use of renewables’ share of their respective energy portfolios, decreasing the demand for natural gas as an export. As with any commodity, lower demand for natural gas will have a negative effect on its price.
Bearish perspective
Most forecasters predict demand for U.S. natural gas from domestic sources and exports, along with supply, will rise rapidly until the late 2020s. This is because many see natural gas serving as a bridge in the global transition from fossil fuels to renewable energy for electricity generation (Adomaitis, 2019; McKinsey and Company, 2019).
Some cite the declining costs for renewable energy and battery storage, as well as the decarbonization of heating in buildings, as factors driving a decrease in demand for natural gas in power generation for both residential and commercial buildings. These developments suggest a price plateau in 2030 (Dewar et al., 2019). Dewar et al. (2019) also note that growth in the demand for natural gas exports will be lower as well.
Demand is expected to increase, however, in the industrial sector, where natural gas is used as a source of heat and power and is the feedstock for petrochemical applications and manufacturing (e.g. glass, drywall, fertilizers, etc.) (Dewar et al., 2019).
Some speculate a form of an EU Green New Deal could cause the loss of some 45 billion cubic meters of natural gas demand, or 12 percent from current annual demand, by 2040 (Slav, 2020a).
In the face of lower demand/cost trends for natural gas, many expect producers to continue to cut their costs and improve recovery rates by applying new digital technologies that increase efficiency and boost recovery rates to lower their breakeven cost of gas extraction.
Bullish perspective
There is a growing international consensus that hydrogen will play a key role in the transition to lower-carbon energy, but the argument comes back to green hydrogen versus blue hydrogen.
Green hydrogen is made solely from renewables and requires massive investment, not only in money but also in land acreage, and the mining required for the minerals required for wind and solar infrastructure.
Blue hydrogen is created using Steam-Methane Reforming. It involves reacting natural gas with high-temperature steam and with that reaction a mixture of hydrogen, carbon monoxide, and a small amount of carbon dioxide is created and captured. The carbon monoxide is then reacted with water to produce more hydrogen. At this stage, the hydrogen can be compressed and become compressed hydrogen. Hydroelectricity could be used to generate the steam, further reducing the amount of energy used and the greenhouse gases emitted.
The blue hydrogen can be used to fuel hydrogen cell vehicles. Toyota and Honda have created commercial hydrogen fuel cell vehicles; BMW has committed to building its own hydrogen vehicle.
Tesla’s competition Nikola has built a factory in Arizona to build hydrogen fuel cells to replace diesel trucks by the latter half of 2023. They say its first truck will be produced in Europe in 2021 (Paraskova, 2020a). Europe’s push to hydrogen could potentially boost demand for either LNG or hydrogen.
Supply of natural gas
Yes, there ARE technically “oil wells” and “gas wells”. It sounds very simple but when we drill a well, we don’t just produce a single fluid, but we produce all the different types of fluids (oil, field condensate and gas) with initial separation being done at the wellhead.
Further separation of the gas into NGLs such as propane, butane, ethane, and pentane+ (plant condensate) is done during the processing of the natural gas, usually by centrifuge.
Natural gas – Western Canada
If we look at the production of natural gas in Western Canada (BC, Alberta and Saskatchewan) in Figure 2 and compare it to the natural gas exports to the U.S., we see that both exports and production have been decreasing.
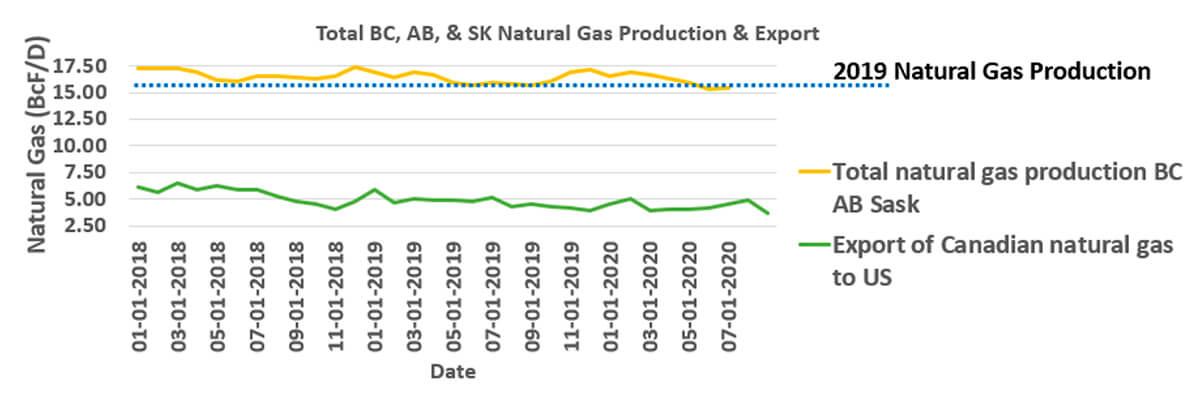
A 30% reduction in drilling in 2019 from 2018 in Western Canada saw a corresponding 31% drop in capital spending to $18.9 billion (Healing, 2020). This drop in drilling was due to a lack of foreign investment in Western Canada’s oil and gas industry. Production dropped.
The amount of natural gas exported from Canada to the U.S. has decreased from 2018 to 2020 (Figure 2). We are also seeing declines in the natural gas production in Western Canada that is below 2019 levels, we are producing on average for 2020 - 57 MMcF/d less compared to 2019 (Figure 2).
Change in AECO
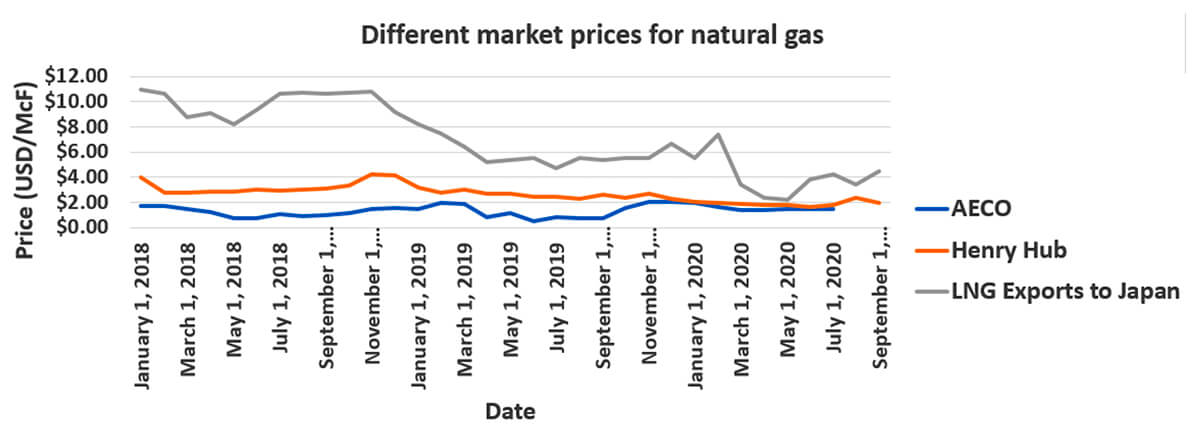
This drilling cutback and a rule change on a key Alberta pipeline system in 2019 by TC Energy Corp. changed temporarily the tariffs on its NOVA Gas Transmission Ltd. pipeline network, or NGTL. It also gave natural gas producers increased access to storage during periods of maintenance on the system, which dampens the pricing volatility during the often-turbulent summer and fall seasons (Orland, 2020).
This caused a convergence between Henry Hub and AECO price for natural gas (Figure 3).
Drop in capital spending 2020
It is expected that capital spending in Western Canada will decrease in 2020, ranging between $14.1 billion and $16.4 billion; that is a drop of 30% from 2019 (Healing, 2020). This will affect our drilling and completion activity. Currently, we have drilled about half of the wells we drilled in 2019 over the same period.
Many oil and gas companies are using their cash flow to pay dividends, even if the dividends are slashed, and to reduce debt.
In the past oil and gas companies have paid high dividends and have always tried to pay the dividends despite what was happening in the market in terms of the price of oil and gas.
Now in this current market economy where the price of natural gas and oil are so low, some oil and gas companies are considering changing from a fixed rate to a variable rate. Variable rates are determined by a percentage of the previous four quarters' free cash flow. The change to variable dividends protects their cash flow in times of low price of natural gas or oil. It also prevents oil and gas companies from going into debt to pay the fixed dividends.
Oil sands production 2020
After the Saudi – Russia price war, COVID lockdowns, and the price meltdown, producers shut-in 1 MMBOPD (Figure 4). The amount of crude oil shut-in later rose to 1.2 MMBOPD due to the maintenance of the upgraders (refineries where the bitumen is upgraded to synthetic oil) being moved forward to take advantage of the downturn in the price (Healing, 2020).
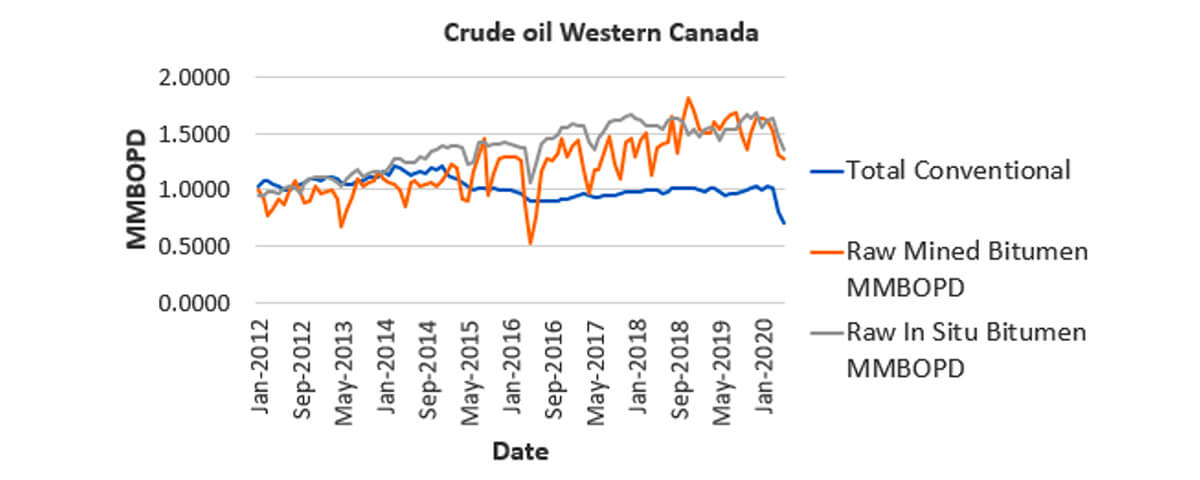
In July 2020, oil sand producers began to restore 20% of the 1 MMBOPD production curtailed due to strong prices for WCS (Paraskova, 2020b).
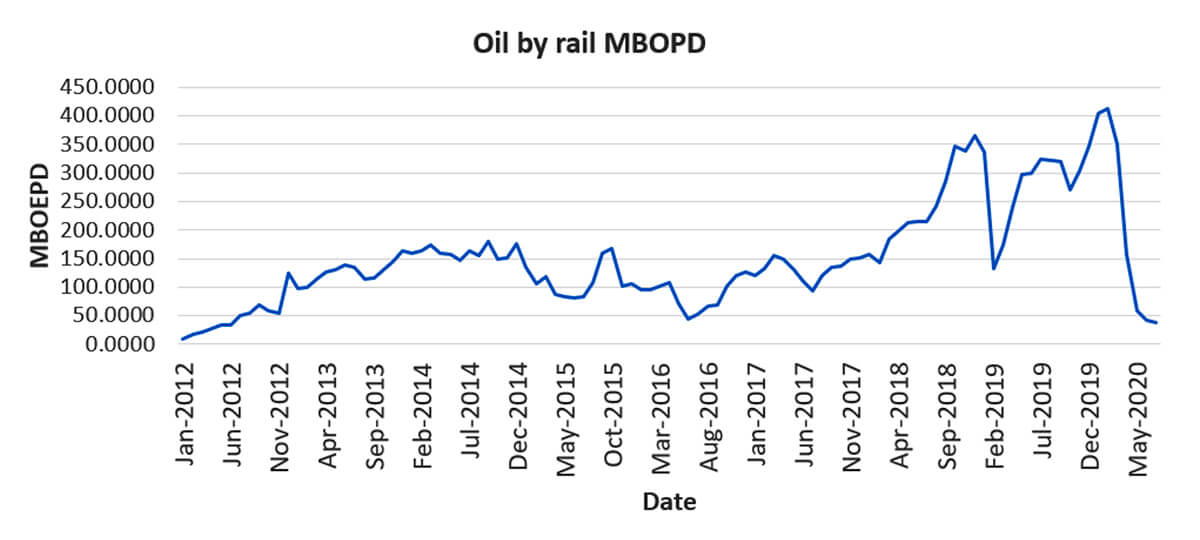
During this time the amount of oil shipped by train (Figure 5) decreased significantly and the issues about pipelines have gone to the back burner as we tackle other issues like re-starting the oil and gas industry.
There also has been an unexpected demand in heavy-sour crudes such as Canada’s bitumen. High-sulphur oil prices in Singapore flipped into backwardation (i.e., spot price was higher than the forward price) in early July. We seen shipments typically bound for Singapore from Europe and Russia diverted to the U.S. for refinery feedstock. The issue is countries that produce high-sulphur crudes like Canada, Saudi Arabia and Iraq curtailed their production (Low et al., 2020).
Why there is such a demand for heavy oil is because refineries produce more gasoline / diesel / kerosene per barrel of heavy crude oil than do per barrel of light crude oil. As a bonus the complex heavy refineries produce a lot less waste petroleum coke per barrel which also reduces their costs (Muir, 2020).
The existing Trans Mountain pipeline, which runs from Alberta to Burnaby, B.C., has been running full throughout this downturn because there is demand in the Pacific Basin for heavy oil (Morgan, 2020).
Rig and well counts in Western Canada
The number of wells drilled in Western Canada in 2019 from January 1 – October 16 was 4312 wells compared with 2214 drilled in the same period in 2020, a decrease of about 50% (Table 1). Most of this decrease in drilling is due to lower Henry Hub prices, companies reducing their CapEx in response to their stocks being devalued due to the Saudi – Russia 2020 price war, and companies focusing on using operational cash flow to drill.
| 2018 (January 1 to October 16) | 2019 (January 1 to October 16) | 2020 (January 1 to October 16) | Percentage difference between 2019 & 2020 | |
|---|---|---|---|---|
| Table 1. The number and types of wells drilled in the last three years over the period January 1-October 16. We do know 2019 had a drop in production, corresponding to the number of wells drilled (BOE Report, 2020a). Extrapolating from this, if we keep going at this rate, 2020 will see approximately 50% of the wells drilled than there were in 2019, with obvious impacts on production heading into 2021. | ||||
| Crude Oil | 3079 | 2018 | 918 | 55% |
| Gas | 953 | 603 | 323 | 47% |
| Crude Bitumen | 1125 | 898 | 382 | 57% |
| Undefined | 659 | 399 | 281 | 22% |
As noted previously, gas wells are not the only source of natural gas. There is associated natural gas with oil wells, the implication being that shutting in “oil wells” impact gas production from those wells.
On March 20, 2020, the number of rigs operating in Western Canada dropped significantly with the amount of oil rigs drilling being less than the gas rigs (Figure 6) and this was the case until about July of this year when the price of WTI oil stabilized around 40 USD / barrel.
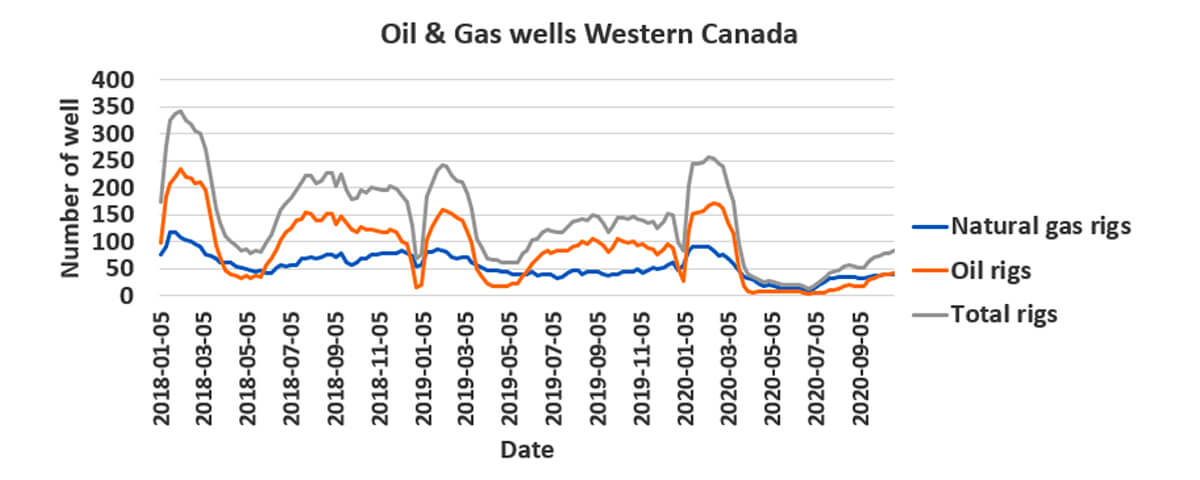
In mid-June the number of rigs operating in Western Canada bottomed out at only 11 rigs but since then our operating rigs have been increasing with a significant increase in July (27), September 2020 (19) and so far for the first half of October an increase of eight rigs.
What we are seeing is as the price of oil increased and stabilized, there was an increase in activity in oil rigs and if we look at the wells drilled we see the focus has been the Viking. This increase in oil rigs accounts for the rapid increase in the number of rigs operating in Western Canada lately.
During this same period (March 20, 2020 to October 16, 2020) we have seen the number of gas rigs remaining relatively the same and most of the drilling activity is in:
- Montney (66 gas wells, 82 undefined or natural gas liquids, and 10 oil)
- Spirit River (28 gas wells)
- Duvernay (24 gas wells).
Gas storage in Western Canada
Due to the drop-in in the price of oil from lack of demand compounded by COVID lockdowns, production of oil in Western Canada dropped 22% from 4.5 MMBOPD to 3.5 MMBOPD (Alberta Government, 2020c; Saskatchewan Government, 2020b; British Columbia Government, 2020b).
The 2019 demand for natural gas for the oil sands was 3.79 BcF/d, but if we lower this by 22%, we see we only need 3 BcF/d. Therefore, the amount of natural gas is increasing in storage (Figure 7) despite only half the wells having been drilled in Western Canada compared to 2019. Note that 2019 was already a low production year (Evans and Frey, 2019).
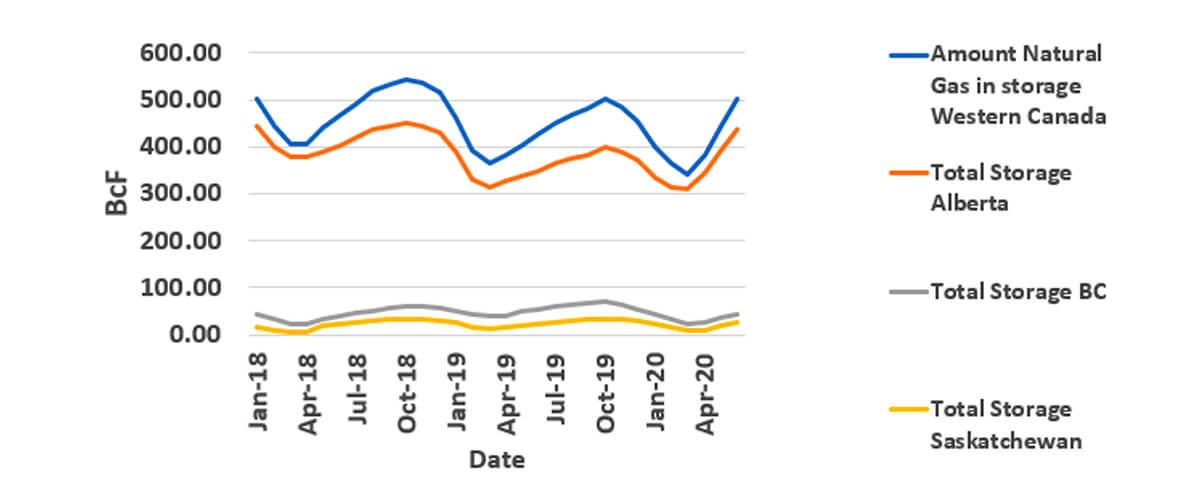
There are concerns that Alberta is on track to reach maximum working gas capacity in its underground storage before the end of the shoulder season at the end of October. Just like the Henry Hub, these concerns of running out of storage may put downward pressure on the AECO hub price before the winter demand. It would also cause producers to be forced to shut in to prevent the price from falling (Evans and Frey, 2020).
There is uncertainty around this prediction because we are in a La Niña cycle which causes in the winter months wave-like jet stream flow across the United States and Canada, typically bringing colder and stormier than average conditions across the north, and warmer and calmer storm conditions across the south (Obergfell and Lashley, 2012). We have already had snow on the ground and daytime temperatures hovering around 0°C.
A colder winter will increase the demand for natural gas both in Alberta and in the U.S.. We are also seeing with the low gas production in 2019 and now in 2020 that supply is not out-balancing demand. Some predictions have the Alberta benchmark spot price being above $3.00 CDN / Gj (it is currently $1.62 CDN / Gj) over the 2021 winter (Seskus, 2020).
Some that are bullish with their predictions, believe that there will be an increase in the price of AECO over the winter. It is expected that gas producers will also continue to focus on drilling what they are obligated to and to work the gas wells they currently have so there probably will not be an increase in drilling in gas wells this winter despite the increase in natural gas prices (Seskus, 2020).
Drop in overall natural gas production in BC, Alberta, and Saskatchewan
If we compare the overall production of 2019 to 2020, we see there was a drop in natural gas production of 39.51 MMcF (Table 2).
| Province | 2019 | 2020 | Comparison Production 2019 to 2020 (MMcF) | ||||||
|---|---|---|---|---|---|---|---|---|---|
| Min (MMcF/d) | Max (MMcF/d) | Average (MMcF/d) | Predicted Production (MMcF) | Min(MMcF/d) | Max (MMcF/d) | Average (MMcF/d) | Predicted Production (MMcF) | ||
| Table 2. Production of natural gas over 2019 and 2020. Notice that only in B.C. the predicted natural gas production has increased by 116.5 MMcF while in Alberta and Saskatchewan it decreased by 144.1 MMcF and 11.9 MMcF respectively. Overall, we are seeing a total reduction in natural gas production of 39.5 MMcF. Data from Alberta Government (2020a); British Columbia (2020a); Saskatchewan Government (2020a). | |||||||||
| Alberta | 9.7278 | 10.5419 | 10.1627 | 3709.3814 | 9.1687 | 10.1803 | 9.7678 | 3565.2549 | -144.1265 |
| BC | 5.1951 | 6.2800 | 5.6929 | 2077.9159 | 5.6436 | 6.2321 | 6.0122 | 2194.4449 | 116.5290 |
| Sask. | 0.4589 | 0.5005 | 0.4887 | 178.3578 | 0.4057 | 0.4813 | 0.4560 | 166.4436 | -11.9142 |
| Total | 15.3818 | 17.3224 | 16.3443 | 5965.6551 | 15.2180 | 16.8937 | 16.2360 | 5926.1433 | -39.5117 |
Better wells being drilled in Montney
The number of wells drilled in B.C. over the period of January 1 to July 31 over the years 2019 to 2020 is shown in Table 3, and we see that the number of wells decreased and the total production of natural gas in B.C. increased between 2019 to 2020.
| Year | Total number of gas / undefined wells January 1 to July 31 | Total Production (BcF/d) | Drilled in Montney | Percentage in Montney |
|---|---|---|---|---|
| Table 3. Comparison of the number of wells drilled in B.C. between January 1 to June 30 for 2019 and 2020. Data from BOE Report (2020a); British Columbia (2020a). | ||||
| 2019 | 273 | 5.68 | 169 | 62% |
| 2020 | 175 | 6.04 | 103 | 59% |
Roughly 60% of the wells drilled in B.C. were in the Montney Formation and this suggests that we are seeing improvements in the Montney drilling program due to factors like (Belanger et al., 2020; Schulte and Felton, 2020; Rachal, 2019):
- Increased experience, and continual improvement in drilling
- Completion designs (increased stage count, tighter stage spacing and longer laterals)
- Improvements in planning and scheduling through the use of geomodels and incorporating new ideas in seismic (seismic inversion, Poisson ratio, Young’s Modulus, brittleness, fracture density and orientation, closure stress from seismic, etc.), geomechanics, petrophysics, geology
- Reduction in non-productive time, increase operational efficiency
- Adopting simultaneous operations
This will increase our Internal Rate of Return (IRR) in the Montney.
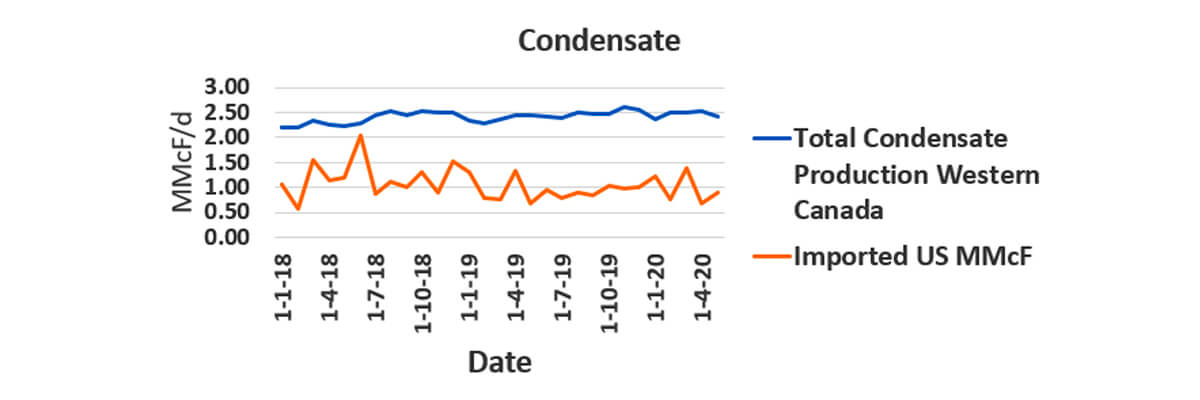
Condensate production
The condensate is mixed with heavy oil as a diluent to facilitate flowing. It usually trades at about the same price as WTI making it very valuable in Western Canada since Western Canada’s heavy oil tends to be discounted (i.e., a differential is applied, making it lower than WTI).
Condensate supply shortages in the past have prompted condensate imports from other places such as the Eagle Ford and Permian through the Southern Lights diluent pipeline from Chicago to Alberta to meet demand.
With oil sands production down 21%, one would expect condensate to be reduced by the same amount; the graph below (Figure 8) shows it has not. It has dropped by only 5%. Further, condensate imports have not been significantly reduced. There appears to be no other alternative other than to put excess condensate into storage.
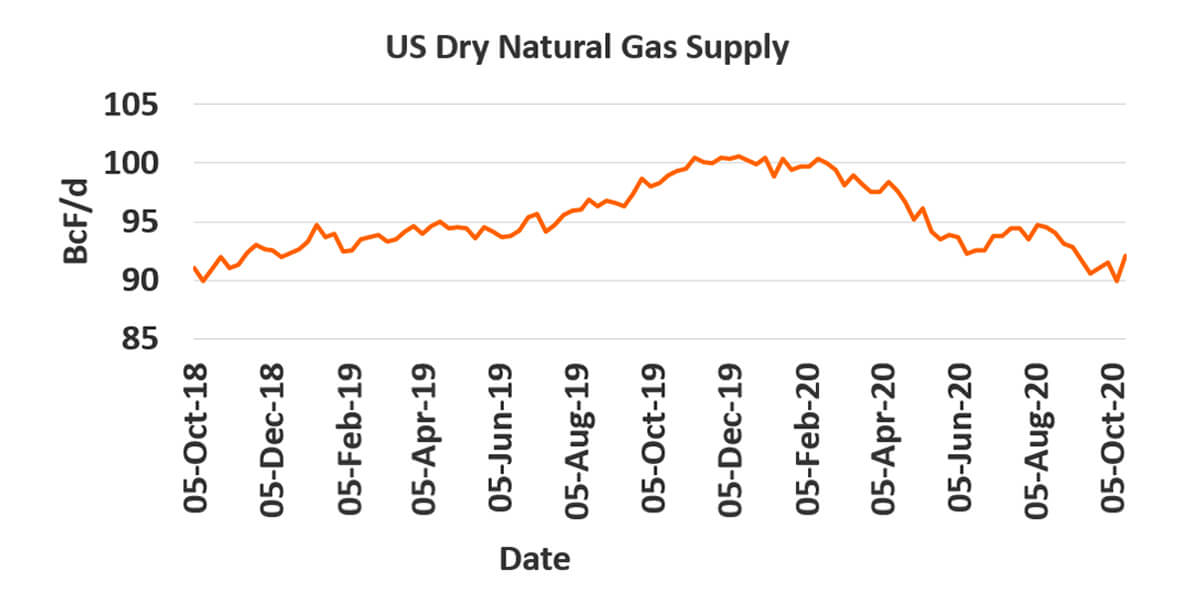
U.S. total supply - natural gas
Natural gas production in the U.S. is decreasing (Figure 9). Production has decreased by about 7.8 BcF/d (Table 4).
Unconventional plays
In the seven unconventional basins, we saw the production of natural gas reach its lowest in August 2020 but then it began to increase until October 2020 and it is projected to fall slightly in November 2020 (Figure 10).
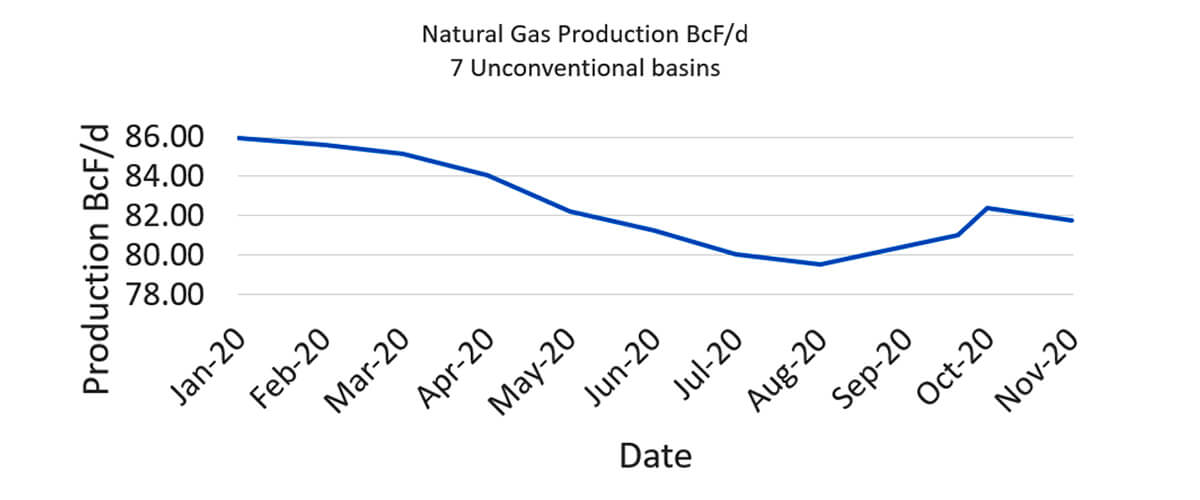
Unlike the natural gas, the oil production for the seven unconventional basins was at its lowest in July and has been increasing until October but it too is expected to fall slightly in November. This drop in natty in November may be tied with the expected drop in oil production.
Reasons for this drop in production in the unconventional basins:
- Shutting in of oil and gas wells
- Mass dropping of rigs means fewer wells getting drilled
- Increase in DUCs
- Days of reckoning for debt-heavy companies saw them stop drilling and completing wells companies
- Pipeline capacity constraints
- Less natural gas demand driving lower imports to the U.S.
Since the oil price has stabilized, we are now seeing production of oil and natural gas returning in the Permian and also the Bakken. We also see the number of DUC’s in these two basins decreasing so the production is coming from completing previous uncompleted wells.
The least amount of changes in production has been in the Appalachia and Haynesville which are predominately natural gas plays.
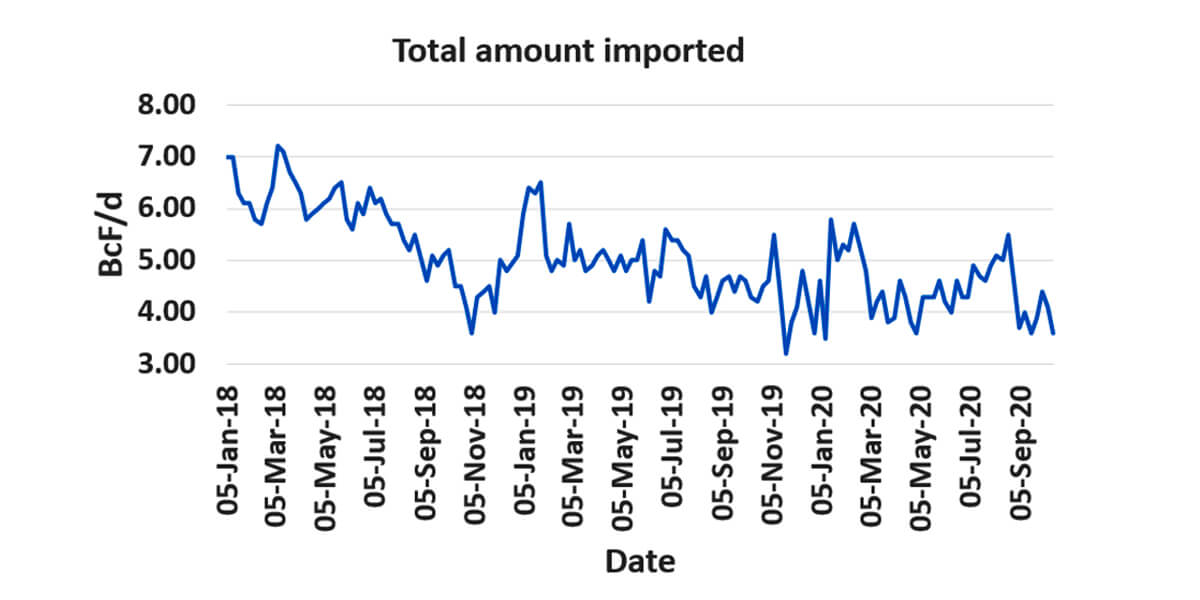
LNG and pipeline imports
We see a drop in natural gas imports through LNG and pipelines of about 0.9 BcF/d (Figure 11). While not large in and of itself, when added to the drop in production it becomes 8.7 BcF/d, which is significant.
Summary of supply
We see both the amount of natty produced and imported into the U.S. decreasing (Table 4) as we are in this shoulder season which is good news. We are projecting in November in the unconventional plays for natty to continue to decrease so we should see production to continue to decrease.
With a decrease in temperatures, concerns about a La Niña, we are seeing an increase in demand for LNG and soon we should see the inflection point for the natty going into storage. This will ease concerns about storage confinement.
| 01-01-2020 BcF/D | 01-02-2020 BcF/D | 01-03-2020 BcF/D | 01-04-2020 BcF/D | 01-05-2020 BcF/D | 01-06-2020 BcF/D | 01-07-2020 BcF/D | 01-08-2020 BcF/D | 01-09-2020 BcF/D | 01-10-2020 BcF/D | |
|---|---|---|---|---|---|---|---|---|---|---|
| Table 4. The total amount of available natural gas or supply has been decreasing since the start of the year with a decrease of 7.8 BcF/d until September in production and 0.9 BcF/d in importation of natty by LNG and pipeline from Mexico and Canada (EIA, 2020e; EIA, 2020l). | ||||||||||
| U.S. Natural Gas Production | 94.9 | 94.6 | 94.1 | 93.4 | 90.4 | 88.5 | 89.3 | 89.1 | 87.9 | 87.2 |
| Total importation | 4.8 | 5.3 | 4.1 | 4.2 | 4.2 | 4.3 | 4.7 | 5.1 | 3.8 | 3.9 |
| Total Amount natural gas available | 99.8 | 99.9 | 98.2 | 97.6 | 94.6 | 92.8 | 94.0 | 94.1 | 91.7 | 91.0 |
Gulf of Mexico – shut-ins due to hurricanes
The hurricane season in the Gulf Coast this summer and fall (Fedschun, 2020) has been very active because we are currently in a La Niña event which increases the hurricanes in the Gulf of Mexico. This is because wind shear is increased over the Pacific and reduced over the Atlantic (The Associated Press, 2010; Schulte and Lyasky, 2019). The lack of a strong wind shear in the Atlantic causes more hurricanes in the Atlantic to form. During El Niño, the shear is increased in the Atlantic and reduced in the Pacific prohibiting tropical storms from forming.
There has been 23 named storms of the Atlantic season and we have already seen in the Gulf of Mexico one tropical storm (Cristobal) and five hurricanes (Hanna, Laura, Marco, Sally, Beta) by the start of October (Seba, 2020). The storms that affected production, LNG facilities and refineries in the Gulf of Mexico were Hurricanes Laura, Sally and Beta.
Over the years the amount of natural gas and oil that is produced has been significantly reduced especially with the popularity of the unconventional plays (Figure 12).
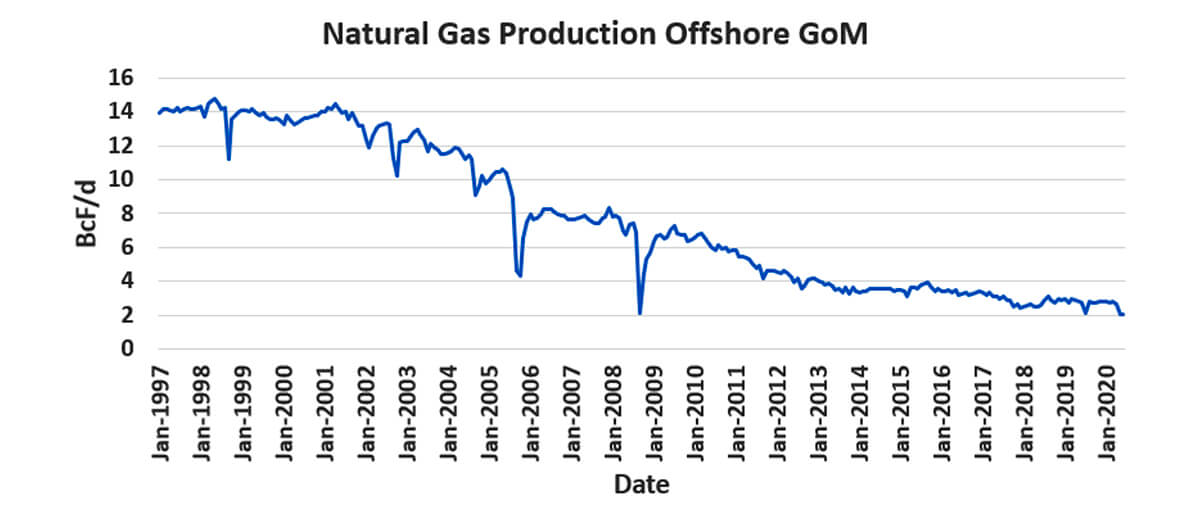
These storms will temporarily affect the production of natural gas and oil, but the Gulf of Mexico only produces 5% of all the natural gas in the U.S. and 17% of the oil production (Seba, 2020). Ten years ago, the amount of natural gas was 10% and the oil production was 30%, so the temporary shut-ins of production will not be as significant as they have been in the past.
Hurricane Laura
Hurricane Laura caused the shut-in 84.3% of the oil production in the Gulf of Mexico (1.56 MMbbl/d) and 60.95% (1.65 BcF/d) of the natural gas production (Davis, 2020; Greenwood, 2020). Oil and natural gas production were also affected in South Louisiana and the Haynesville Shale (natural gas basin).
This caused for the last week of August the oil production fall by 1.1 MMBOPD to 9.7 MMBOPD and the production of natural gas drop 700 MMcF/d (EIA, 2020e).
All of this caused the Henry Hub future prices to rise to above $2.50 (Cocklin, 2020).
It caused the shutdown of major refineries, that are centred in the Beaumont/Port Arthur and Lake Charles regions, shutting-in in advance of the storm, resulting in 2.4 MMBOPD of domestic capacity, or 13%, to be offline (Davis, 2020).
It caused Sempra Energy’s Cameron LNG and Cheniere Energy Inc. Sabine Pass terminal both in Louisiana to shutdown. Shipping traffic was also shutdown at Port Arthur, TX, Lake Charles, LA, and Houston Ship channels so no LNG vessels were loaded (Cocklin, 2020).
Cameron LNG was offline till October 5, 2020, right before Hurricane Delta (Gonzales, 2020; Nikolewski, 2020).
This shutdown in Louisiana and the shutdown of two processing trains at Chevron’s Gorgon liquefied natural gas (LNG) plant in Western Australia has caused a shortage in the supply of LNG and an increase in the futures for the Japan-Korea Marker (Figure 3). Traders are now trying to secure cargoes before the price rises too much (Stapczynski et al., 2020a; Paul and Jaganathan, 2020).
Hurricane Sally
Hurricane Sally made landfall in Alabama, and it caused 500,000 bpd and 759 MMcF/d of natural gas to be shut-in in the Gulf of Mexico.
Due to the uncertainty of Hurricane Sally some investors bought back the natural gas options they borrowed to sell short to cover their orders (short covering) especially with the Henry Hub price down to $2.31 / MMBtu (Hyerczyk, 2020a). When Hurricane Sally hit the price did rise to $2.36 / MMBTU then it fell quickly afterwards.
Hurricane Beta
Hurricane Beta caused rigs and platforms in the Western part of the Gulf of Mexico to shutdown and Sabine Pass, Galveston Bay, and Corpus Christi Bay where there are oil and liquefied natural gas (LNG) terminals and infrastructure were affected by this storm (Paraskova, 2020c).
Hurricane Delta
Tropical storm Delta made landfall on October 9, 2020 near Creole, La. roughly south-south east of Lake Charles (Golembo et al., 2020).
Before Delta hit there was more than half of dozen LNG tankers waiting to enter the U.S. export plants as the LNG facilities temporarily shutdown causing some loss of LNG.
Hurricane Delta just narrowly missed the Cameron LNG facilities so there should be no need for any extended shutdown or extensive repairs and if LNG demand remains solid then we will see higher natural gas prices (Hyerczyk, 2020b; Oil & Gas 360, 2020).
Drilled wells
Since January 2020, this is the number of wells in five unconventional basins:
| Eagle Ford | Appalachian | Permian | Williston | DJ-Niobrar | |
|---|---|---|---|---|---|
| Table 5. Table showing the minimum and maximum number of rigs from January 2020 to now (BOE Report, 2020b). Notice the number of wells did not drop as much in the Appalachian as it did in the Permian which is an oil play | |||||
| Maximum rigs | 82 | 83 | 488 | 61 | 32 |
| Minimum rigs | 9 | 31 | 124 | 10 | 4 |
With the shutting-in of wells in the unconventional oil basins around March 2020, the rigs and frac spread activity increased in the Appalachian Basin. In Table 5, the Appalachian rig count was cut by 63%, which is the least percentage change between the unconventional basins, while the Permian rigs were cut by 75%.
Summary of wells drilled in the U.S., DUCs, and production for 2020 to date
The well rigs operating had been falling since the start of 2019 partially due to investors demanding companies to fund their operations (i.e. CapEx) with the cash generated by their operations/assets and new well productivity per rig (e.g. longer laterals) due to consolidation of acreage.
Then we had the Covid shut-ins, drop in the price of oil and natural gas, companies reducing their CapEx, causing the number of rigs in the U.S. to fall to their lowest in mid-August 2020 (244 with only 172 oil rigs and 70 gas wells).
Frac spreads, like the rigs operating, also saw a large decrease in 2020 with the frac spreads beginning the year with 358 and they continued to decrease until mid-May when it hit only 45 (Figure 13).
Frac spreads are important because it tells us the production that is coming online especially with the completion of DUCs which function as storage in the subsurface.
Lately there has been an increase in frac spreads (Figure 13) and are up to 134 as of October 24, 2020. We also see the number of DUCs have been decreasing over August and September in all basins but the Haynesville.
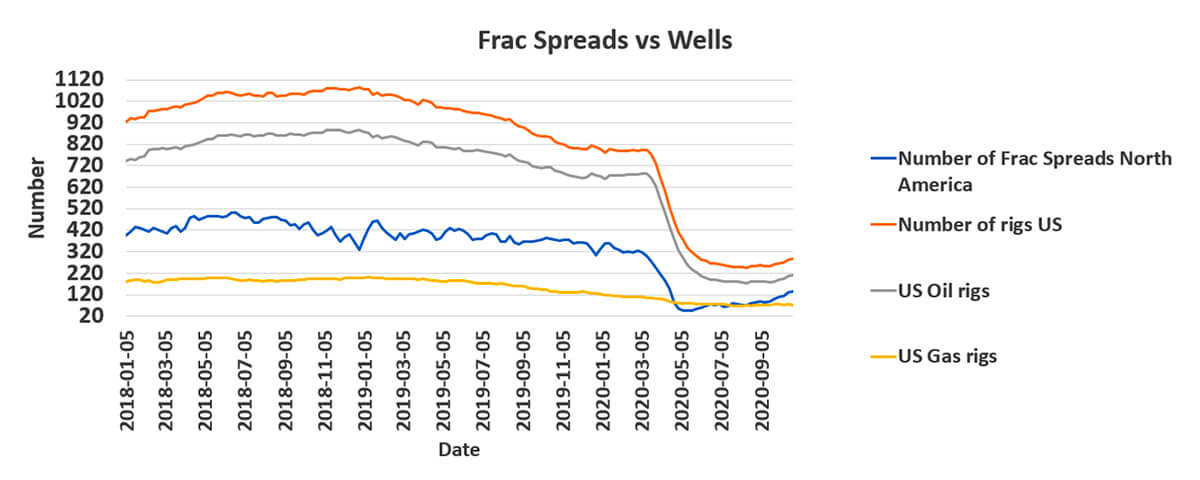
Not all DUCs will be completed because some are out of zone or are not economical.
With this downturn in frac spreads Schlumberger made an extraordinary exchange of their fracking unit, OneStim, and their fracking business for 37% of Liberty Oilfield Services’ equity (Starks, 2020). This is following Schlumberger’s move towards more asset-light software and services-driven businesses and getting rid of asset heavy businesses (Khan, 2019).
We are seeing more service companies, like Schlumberger, focusing on digitization and the use of data analytics, machine learning, artificial intelligence (AI), cloud-based technologies to provide solutions that keep costs low without compromising workplace safety.
We are seeing an increase in frac spreads (Figure 13) and the oil rigs, but the gas rigs are decreasing. The increase in frac spreads is showing operators are starting to bring their DUC’s online and minimizing the number of wells they are drilling; drilling only those wells they are required to drill to hold the lease block or for contractual obligations.
The DUCs can provide a sufficient supply of wells for completions and production for the short term until drilling picks up further.
Way forward for new wells
For the rest of the year we will be seeing operators using innovative ideas of completing some new wells with a combination of new drills and DUC wells, conducting workovers and refracturing to optimize existing wells, and other tactics to manage their decline curves (Johnson and Rossano, 2020).
These decisions of what to do are based upon pipeline takeaway or midstream commitments, capacity availability, hydrocarbon mix (NGLs versus gas), offsetting well performance, end-use markets, realized prices and basis differentials, hedge portfolios, etc. (Johnson and Rossano, 2020).
Demand for natural gas
Summer 2020 was hotter than usual by most accounts. As a result, there were less natural gas put into storage (Figure 14) because of the amount of natty required to produce power for air conditioning (Figure 17). Coupled with lower production, prices strengthened over the summer.
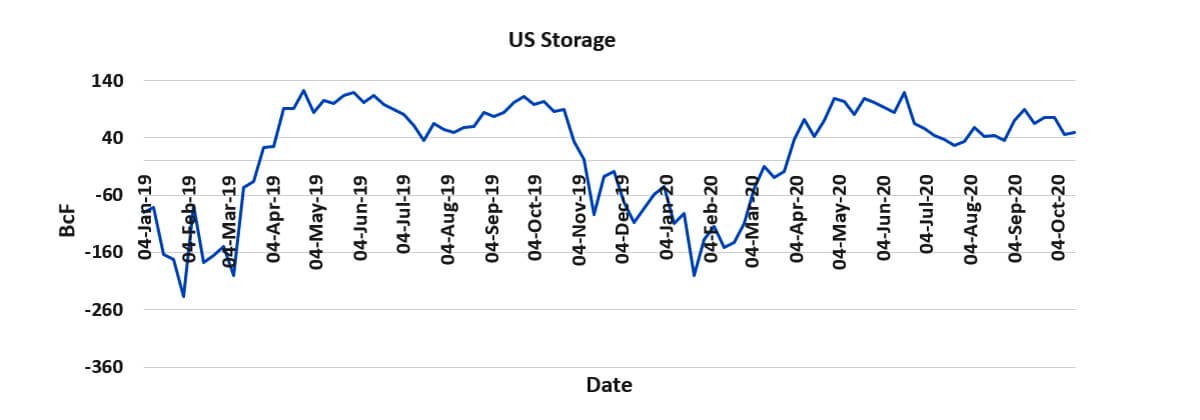
We are currently in autumn and the temperatures are getting colder. Traders are looking closely at the build-in storage and the cancellation of any LNG cargoes during this shoulder season.
The concern is about storage overflows especially as storage is nearing record levels in some regions, and this will pressure prices since producers may start to dump natural gas in the spot market at below-market prices (Hyerczyk, 2020c).
Exports
Just as much as the production or the supply of natural gas affects the price of natural gas, so do exports to international markets. Exports reduce the risk of gas gluts in North America.
LNG has helped make natural gas an international commodity like oil. Before the ability to export gas at scale, there was a glut of dry gas because of all the natural gas that was coming from the unconventional plays.
Unlike oil, there is no organization (i.e., Organization of the Petroleum Exporting Countries (OPEC)) controlling the production of natural gas, which made natural gas markets particularly vulnerable to imbalances in supply and demand.
The total exports of natural gas have been increasing lately especially since July 2020 after taking a big hit after March 2020 (Figure 15).
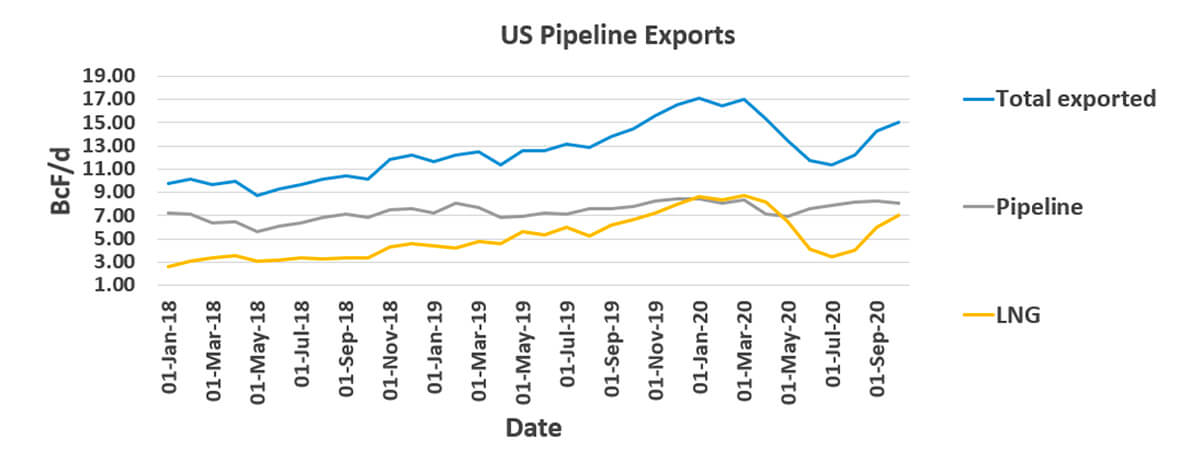
Notice the drop in Figure 15 of the total amount of natural gas being exported over the summer being driven by more than 96 LNG cargoes being canceled for June and July deliveries, 45 cargoes canceled for August deliveries, and 30 cargoes for September (Snyder, 2020; EIA, 2020p). Luckily, we are seeing the demand for LNG increasing again.
Pipelines
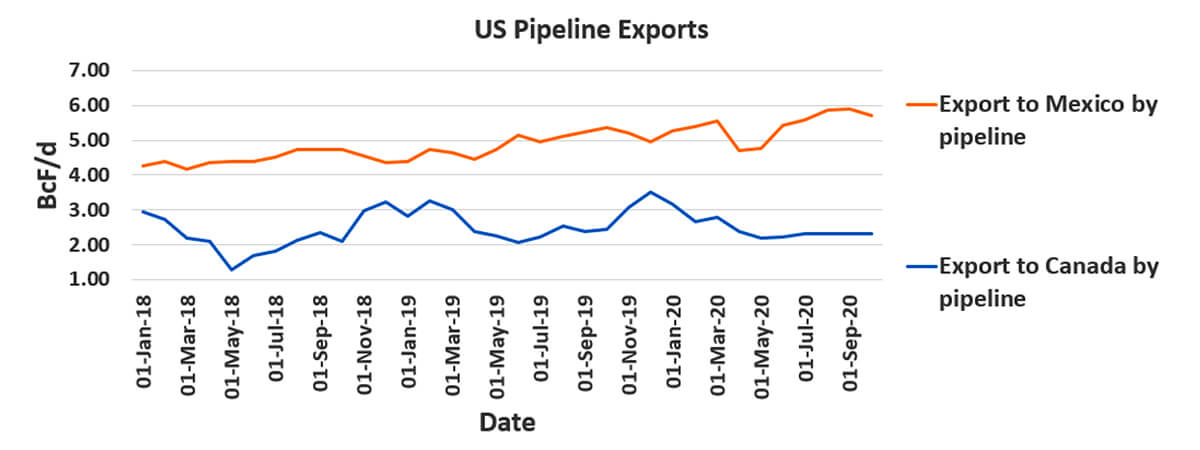
If we look at the amount being shipped by pipelines to Canada and Mexico, we see the amount being exported to Canada has been decreasing while Mexico is returning to levels before the oil price crash (Figure 16).
LNG
The U.S. ranks third in LNG exports in the world, behind Australia and Qatar, and is the largest producer of natural gas in the world.
| 2020 | 2019 | 2018 | Top Five 2018-2010 | ||||||||
|---|---|---|---|---|---|---|---|---|---|---|---|
| Country | Amount (BcF) | % | Country | Amount (BcF) | % | Country | Amount (BcF) | % | Country | Amount (BcF) | % |
| Table 6. The top five countries for U.S. LNG exports over the last three years (EIA, 2020n). | |||||||||||
| South Korea | 167.6 | 12.85% | South Korea | 266.4 | 14.64% | South Korea | 252.2 | 23.29% | South Korea | 686.3 | 16% |
| Japan | 140.1 | 10.74% | Japan | 201.1 | 11.05% | Mexico | 182.2 | 16.83% | Japan | 463.9 | 11% |
| Spain | 137.2 | 10.52% | Spain | 168.0 | 9.20% | Japan | 125.5 | 11.59% | Mexico | 342.6 | 9% |
| Turkey | 87.3 | 6.70% | Mexico | 143.4 | 7.88% | China | 90.5 | 8.35% | Spain | 295.9 | 7% |
| United Kingdom | 82.4 | 6.32% | United Kingdom | 120.9 | 6.65% | India | 57.6 | 5.32% | United Kingdom | 251.7 | 6% |
If we look at the countries that the U.S. have been shipping LNG it appears the top two countries are Japan, and South Korea (Table 6). It is also surprising that U.S. has been exporting LNG to UK and Spain. Japan and South Korea and the EU (Spain and United Kingdom) are planning to move to hydrogen and the U.S. should consider producing and exporting hydrogen as well as LNG in the future.
We also see in 2020 (Table 6) that Turkey has increased the amount of LNG exported from the U.S. Turkey is moving away from buying natural gas from Russia and Iran through pipelines and we have seen Turkey's LNG imports from the U.S. tripled during the first quarter of 2020 (Kimani, 2020). Part of the reason Turkey has moved away from Russia is because Russia accuses of Turkey of supporting terrorists in Syria and Turkey claims Turkish soldiers were killed in Syrian airstrikes in Idlib, one of the last rebel strongholds (Dorsey, 2020).
Turkey is also involved in Libya for historical (Libya was part of the Ottoman empire) and political reasons backing the Islamist Government of National Accord which is fighting the Moscow-supported rebels led by self-appointed Field Marshall Khalifa Haftar (Dorsey, 2020).
Turkey in the future could be joining Canada, Mexico, South Korea, and Japan as the top five nations that US exports natural gas to (Kimani, 2020).
World glut
U.S. exporters have most acutely felt the pain of this LNG supply glut. The gas glut in Asia led to storage filling up in Europe because Europe was already suffering from high gas storage levels due to reduced switching of coal-to-gas for power generation (Jaganathan, 2018) and the mild 2019-2020 winter. The flexibility of American LNG translated into cancelled cargoes from the United States.
Unlike oil, the gas market lacks a coordinated approach, allowing the current oversupply to drift unchecked (Stapczynski et al., 2020b) and top sellers like Qatar trying to decide between curbing the output or igniting a battle for market share which could cause European storage to near capacity and, like the nightmare of April oil prices going negative, likewise forcing gas prices negative (Ratcliffe and Shiryaevskaya, 2020).
At one point in May 2020, up to 11 tankers out of 15 floating with cargoes on board were piling up off the shores of Europe or were expected to deliver cargoes there. The vessels sitting offshore were being used as floating storage as the coronavirus pandemic stifled gas demand, leading to delays in tanker off-loading (Kravtsova, 2020).
China
China is attractive to many because it is the world’s largest energy consumer (Cohen, 2020). It is also under some domestic pressure to wean itself off coal (it is also the world’s largest producer of GHG). As such, China is at the center of LNG exporters’ business plans including the Canadian West Coast LNG at Kitimat, B.C.
Under President Trump, there have been trade disputes between the U.S. and China resulting in levies to be placed against American goods such as (Aizhu et al., 2019):
- LNG – 25% duty
- Methanol, monoethylene glycol – 25% duty
- Propane – 30% duty
- Crude – 5% duty
This explains why China is not in the top five importers of U.S. LNG.
On January 15, 2020, there was Phase One of a trade deal between China and the U.S. where China would buy $200 billion in U.S. goods and services including $50 billion in U.S. energy exports (Cohen, 2020).
Since Phase One was signed, U.S. energy imports to China are still far lower than they should be under the agreement. China’s imports of all-American goods fell by 13.5 percent in May in value terms or $600 U.S. million worth of covered energy products against a target of $10.5 US billion (Bermingham, 2020).
Increasing numbers of people are expecting further non-compliance by China with tensions mounting. Some are calling for the cancellation of the deal because of tensions between the U.S. and China. Two aircraft carrier groups in the South China Sea symbolize the increasing tensions.
As noted above, China’s huge market as an LNG importer has attracted plenty of competition:
- 3000 km pipeline from Siberia to Northern China. The main reason why the Siberian Pipeline was built is because of sanctions levied on Russia by the U.S. following its annexation of Crimea. Because of the sanctions, Russia needed capital from elsewhere and China was an eager partner to supply it (Ferreira, 2019). Russia has also surpassed the U.S. in exporting LNG to China due to it being a buyer market and Russian LNG is lower in cost (Slav, 2020b).
- Central Asia-China pipeline which transports natural gas from Turkmenistan, Uzbekistan, and Kazakhstan (Caspian Sea) to Shanghai.
Europe
The biggest competition U.S. LNG has in Europe is from Russia. Russia has at least 17 pipelines to Europe (Wikipedia, 2020a). President Trump has repeatedly upbraided his European allies, particularly Germany, for their allowing themselves to be beholden to Russian supplies.
Black Sea
One of the hottest natural gas plays in Europe is the Black Sea with natural gas being found in the Romania, Ukraine, and Crimea portions. It is believed Russia invaded Crimea to stop the production of natural gas by Western companies to secure their positions in the European market (Yanchenko, 2018). Vladimir Putin has been using Russian oil and gas as a geopolitical and economic weapon since he came to power.
Imports from Caspian Sea
There is also a network of natural gas pipelines from the Caspian and the Middle East regions referred to as the Southern Corridor, which was built to reduce Europe’s dependence on Russian natural gas. It is composed of three segments (Wikipedia, 2020b):
- South Caucasus pipeline - from the Shah Deniz gas field in the Azerbaijan sector of the Caspian Sea to Turkey through Georgia (Wikipedia, 2020c). There is an eastern extension being built which will connect it to Turkmenistan and possibly Kazakhstan
- Trans-Anatolian Natural Gas Pipeline – connects with the South Caucasus pipeline and goes across Turkey (Wikipedia, 2020d)
- Trans Adriatic Pipeline – connects with the Trans-Anatolian Natural Gas Pipeline and goes across Greece, Albania, Adriatic Sea and ends in Italy, and there are plans to further connect with South Eastern, Central and Western Europe (Wikipedia, 2020e)
There are also plans to build a subsea natural gas pipeline from offshore Israel (eastern Mediterranean) that would supply Europe. The project, called Leviathan, is the largest energy project in the history of Israel. It may have been one of the reasons Chevron bought Noble.
India
We are seeing international companies preparing to set up an alternative to China by investing in India. We have seen earlier in 2020 Google investing $10 billion into India. This investment followed the banning of Chinese Apps in India (Mukul, 2020).
In 2018 India only had four terminals to receive LNG but has decided to build another 11 terminals over the next seven years raising their import capacity by 3.5 times (Jaganathan, 2018). It will also spend $60 billion in gas infrastructure building a cross-country natural gas grid.
This is in line with India’s plans to raise the share of natural gas in the national energy mix to 15% by 2030 from the current 6.2% to reduce pollution (Verma and Jaganathan, 2020a).
India also has plans to supply electricity to the 240 million who currently do not have electricity and it also plans to reduce its use of coal for power generation. The electricity is needed to supply power to electric vehicles, which India plans to account for all new car sales by 2030 and they are also pushing for more scooters and motorcycles to run on compressed natural gas (CNG) (Jaganathan, 2018).
Petronet LNG, India’s top gas importer, plans to move away from long term LNG contracts with fixed pricing such as its deal to annually buy 7.5 million tonnes of LNG from Qatar and move towards shorter contracts with lower volumes and more flexible terms. India is doing this because it is searching for cheap gas for its price-sensitive consumers (Verma and Jaganathan, 2020b).
Future for LNG
India represents the future of LNG as nations work to bring power to 240 million people and we strive to lower our GHGs emissions. The inability to access electricity prevents people from taking part in the modern economy.
There will be a combination of natural gas and renewables as energy sources. EVs, hydrogen fuel celled vehicles, and CNG will compete in the marketplace as fuel for tomorrow’s vehicles.
We will probably have gasoline internal combustion engines present especially in the developing nations until the developing countries re-do their electric grids to accommodate the increasing demand for electricity to recharge EVs.
Daily natural gas deliveries to LNG
If we look at the deliverables of natural gas to LNG facilities, late March 2020 was a record of 9.8 BcF/d, but by June the deliverables fell to 3.6 BcF/d, and in July and August will fall to 2.2 BcF/d due to cancelled orders (Duran, 2020).
EIA expects U.S. LNG exports to increase beginning in September and average 7.1 BcF/d from December 2020 to February 2021 as global natural gas demand gradually recovers (Duran, 2020).
There is also speculation based upon the spot LNG prices for Asia jumping to multi-month highs on increased demand and lower supply amid maintenance in Australia while Chevron complete repairs on LNG train 2 at their Gorgon plant and shut-in terminals due to storms and hurricanes in the U.S. Gulf Coast. We also have currently no cancelations of U.S. LNG cargoes for November (Paraskova, 2020d).
Demand – consumption, 2020 and 2021
If we look at the total consumption for September, we see it is decreasing because the power consumption has decreased with the cooling temperatures (Figure 17).
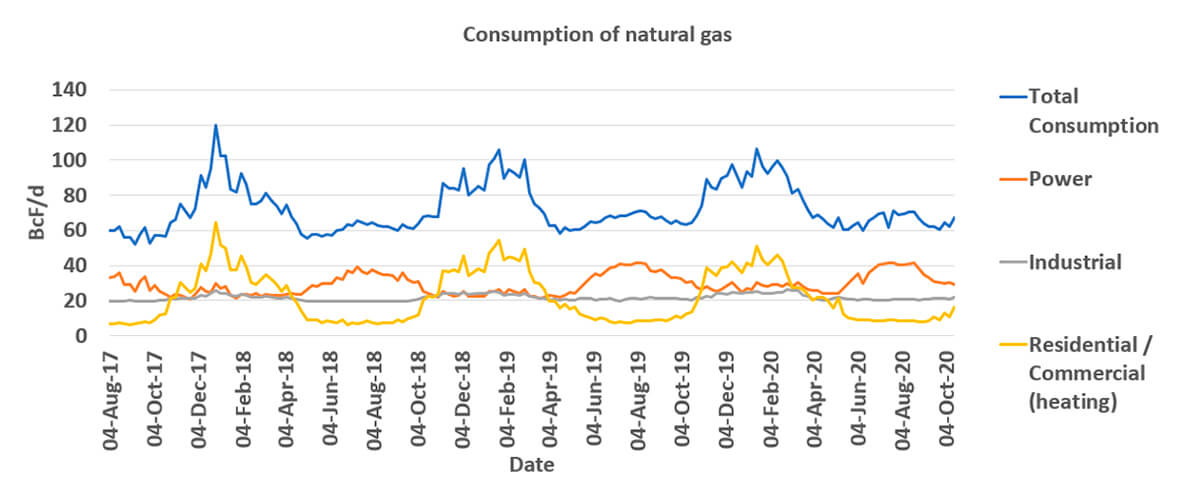
Natural gas consumption is expected to fall approximately 4% over 2020 which is 3.4 BcF/d, or to 81.6 BcF/d due to factors like (EIA, 2020o):
- Warmer-than-average temperatures in the first quarter of 2020 that reduced demand for heating
- Less manufacturing activity following COVID-19 lockdowns. Expected economic recovery supports renewed manufacturing activity, increasing demand and thus the price for natural gas (unless over-production again takes supply/demand out of balance).
In 2021, it is expected the natural gas spot prices will increase compared with 2020. This will make natural gas less competitive with renewables and coal for use in power generation and will cause a decline in the use of natural gas in the power sector consumption of about 14.3% (EIA, 2020o).
This “switching” has long been seen in the relationship between natural gas and coal prices for electricity generation. When the price of coal increase, electric companies switch to natural gas and vice versa. The effect establishes price ceilings for both commodities.
The EIA also expects natural gas consumption in the residential and commercial sectors to increase by 1.6% in 2021, based on a forecasted 4% increase in the demand for energy to heat a building in 2021 (EIA, 2020o). Legions of companies crowding the “smart building” space to heighten energy efficiency could affect the EIA’s prediction.
Effect of operators declaring bankruptcies
The second quarter of 2020 has had the largest number of bankruptcy filings in four years (Rahman, 2020).
Some of the largest companies that have filed for Chapter 11 in 2020 are:
- Chesapeake Energy (debt $9.2bn), with operations in the Marcellus, Haynesville, Eagle Ford, Mid-Continent, Powder River Basin, and Brazos Valley
- Ultra Petroleum (debt $5.5bn), with operations in the Green River Basin
- Whiting Petroleum (debt $3.6bn), with operations in the Bakken Formation and Three Forks Shale (Williston basin), and Niobrara (DJ Basin)
- Denbury Resources (debt $2.1bn), with operations in Jackson Dome and Cedar Creek Anticline
- Extraction Oil & Gas (debt $1.9bn), a Niobrara (DJ Basin) operator
Until recently, the U.S. onshore market has seen 14 mergers and acquisition deals this year, with only one transaction worth more than $1B (the Chevron purchase of Noble with a total market enterprise value of $13B- (Rahman, 2020)).
Companies have been reluctant to acquire other companies to date. This is in part because oil and gas companies are using their cash to sustain their balance sheet or to continue to pay dividends (Salzman, 2020).
While it’s obvious that larger acquisitions are more complex than smaller ones, that complexity is compounded today given that few investment banks will accept the standard practice of funding acquisitions or mergers with debt (at least in part). Thus, consummating such a deal would require a lot more in the form of an all-stock deal or cash, both of which come with their own set of issues. Depressed stock prices mean a lot more stock is required to do a deal, and most companies aren’t exactly cash flush.
Recent mergers
Now in October, we have seen two major deals structured similar to the Chevron-Noble deal.
ConocoPhillips has offered to buy Concho Resources (Permian pure play) for $9.7 billion and Pioneer Natural Resources has offered to purchase Parsley Energy for $4.5 billion. Both purchases are an all stock deal, and some are looking at Marathon and Continental as being the possible next deal (Turley, 2020).
At the same time in the Appalachia (natural gas), we see EQT Corporation has sent over a takeover proposal to CNX Resources Corporation. CNX Resources Corporation just recently announced plans to increase their free cash flow, resume previously curtailed production and use funds to further reduce their outstanding debt. Many see this acquisition as an opportunity to enhance operational and financial synergies since both companies significantly overlap in the Appalachia (Hammond et al., 2020; Zacks Equity Research, 2020).
Mergers are beneficial for mid-size unconventional operators due to economies of scale, lower overheads, increased bargaining power with suppliers and greater access to debt markets which is going to be pertinent in 2021 because of the more than 40 U.S. oil and gas operators that have file for bankruptcy this year (Turley, 2020; Crowley, 2020).
We also know that there have been too many operators in the unconventionals for many years (in 2019 there were 380 operators in the Permian), and we have the same issue in Western Canada in our various plays (Montney, Spirit River, etc.). This is going to lead to a consolidation of operators to be able to obtain contiguous leases in areas where we have a checker board of leases, achieve savings in debt repayments, and reduce operating costs lowering their breakeven costs so that the plays become profitable such as below 30 USD / barrel for oil or 1.65 USD / MMBTU for natural gas.
Other mid-size operators that have not made any deals yet include Diamondback Energy Inc., Cimarex Energy Co. and Ovintiv Inc. (Crowley, 2020).
Vulnerable companies
Other notable companies carrying heavy debts (e.g., Noble) who may be targets for mergers are Apache Corp., Gulfport Energy Corp., Consol Energy Inc., Laredo Petroleum Inc., Range Resources Corp., Occidental Petroleum Corp., Penn Virginia Corp. (van Doom, 2020). These distressed companies are reducing or even halting drilling and completion activity for 2020 and are focused on using their cash flow from their operations to reduce their debt. These are well-established companies; their lack of drilling and completing the wells will affect supplies in 2021.
Takeover targets find themselves in poor positions due to their heavy debt load, and as credit lines dry up due to the value of their reserves rapidly dwindling causing them to become “orphaned.” This is forcing companies to try to seek a merger or being acquired.
An example: Canadian Natural Resources Ltd. (CNRL) recently purchased Painted Pony Energy Ltd., acquiring their $350 million debt and $111 million in cash. CNRL purchased Painted Pony Energy Ltd. for its position in the liquids rich Montney natural gas region of northeastern B.C. (The Canadian Press, 2020).
Part of the reason for the sale was not because of debt but due to the lack of access to capital with little or no liquidity out there, whether it’s debt or raising capital in the public market. With the drop in prices for natural gas liquids, it has led to lower-than-expected cash flow levels, which deprived Painted Pony’s key assets of money needed to finance development (Varcoe, 2020).
We are also seeing companies desperate to sell assets to raise capital at discounted prices, almost pennies on the dollar compared to what the asset is worth. An example of this is EQT has put in an offer to purchase 800,000 acres in the Marcellus and Utica shale basins from Chevron. The offer was for $750 million and Chevron acquired these acres when they purchased Atlas Energy for $4.3 billion in 2010 (Nair et al., 2020). Chevron is losing 83% of what they paid in 2010.
Currently our investors are insisting on higher returns rather than higher production and this is causing companies to focus on fully developing their already existing assets to boost returns. We see in plays like the Montney we are drilling fewer wells but having higher production which indicates we are improving the quality of our wells.
Henry Hub prices and predictions
As noted, natural gas demand is soft due to the mild winter in the northern hemisphere for 2019-2020, resulting in quite a bit of natural gas in storage. Atop that, the global economic torpor from the COVID-19 lockdowns has further softened demand for natural gas and LNG. The amount of natural gas being piped into the U.S. from Western Canada has decreased by 282 MMcF/d.
We saw in the summer the amount of natural gas shipped to LNG facilities drop to only 3.4 BcF/d due to cancelled orders; it was at 9.6 BcF/d in March, a deficit of 6.2 BcF/d, but since then the amount of LNG has increased, and it is back up to 7.3 BcF/d (EIA, 2020e). We are also seeing 8.1 BcF/d natural gas being piped to Eastern Canada and Mexico so overall the amount of natural gas being exported is 15.4 BcF/d.
Risks remain. This year so far we have seen intermittent shut-ins due to pipeline shutdowns and tropical storms and hurricanes in the Gulf of Mexico.
We are now seeing a badly needed rally in natural gas prices exceeding $3 / MMBTU. This is due to a combination of:
- Signs of strengthening LNG export demand in September
- Excessive heat in the summer and now cooler temperatures in the fall
- Drop in natural gas production and importation
- Less natural gas going into storage
- An easing of storage availability fears
But now that we are in a shoulder season, there is instability in the build-in storage and concerns of running out of storage which may cause the price of natty to fall.
All of this is causing the price of natty to be volatile (Figure 18).
Changes in the amount being put into storage causing a rollercoaster ride with the Henry Hub pricing which reflects the volatility of natty currently, with the price changing on a daily basis based upon how buyers are currently interpreting the numbers on production, importation, LNG, storage and even weather predictions (Figure 18) (Paraskova, 2020d).

With all these factors the analysis is difficult. Therefore, predicting the price of natural gas in the short term is difficult.
The good news is we are in a La Niña cycle winter this year, which means we are about to have a winter much different than the past few. La Niñas tend to make for a cold and snowy winter for the Rockies, Great Plains, Midwest, Great Lakes and Ohio Valley. On the other hand, the East could see a mild winter (Unofficialnet, 2020).
Final thoughts
Like all commodities, the price of natural gas is the function of supply and demand. It is largely influenced by the amount of storage, what is being put into storage or what is being withdrawn.
We see in Figure 2 that supply, and demand are greatly influenced by the weather. In a recent study done by the Centre for Science and Environment (CSE) it was found that each degree rise in the heat index results in a 187 megawatt increase in electricity demand during COVID-19 lockdown, which was six percent higher than in 2019. This trend was driven by heat stress and cooling demand in the residential sector (The Economic Times, 2020).
This has implications for the demand for electricity in the future because we have been seeing the temperatures rising in the summertime over the last few years with many countries recording record highs.
Overall, with production shut-ins in unconventional plays, and from tropical storms in the Gulf of Mexico, the drop in importation of natural gas from Canada and Mexico, the shutting down of pipelines and infrastructure all add up to reduce the overall production of natural gas. In the spring-summer-fall months, it reduces the amount of natural gas that needs to be put into storage and alleviates our fears of the storage filling up and the price going negative.
Currently we are in a shoulder season and the amount of build in storage is being closely watched. Storage is currently sitting higher than the five-year average which is disconcerting (Shelor, 2020).
Many investors are waiting on the inflection point for this shoulder season due to the demand in LNG and the onslaught of colder weather. So currently we are expecting wild price swings based on weather forecasts, production and LNG feed gas deliveries.
The good news is the feed gas deliveries for Elba (island in Georgia) and Freeport (in Texas, south of Galveston) have hit new all-time highs this fall (Gonzales, 2020).
Other factors that are also in the background that will be looked at are (Hyerczyk, 2020c; Paraskova, 2020d):
- Drop in production for the unconventional plays for what is projected for November 2020 (Figure 10)
- Overall production decreasing (Figure 9 and Table 4)
- Importation of natty decreasing (Figure 11 and Table 4)
All of this is causing the price of natural gas to falter for a period then it begins to rally again (Figure 18).
2021 predictions
Beyond 2020, it is expected that natural gas production will decline as operators continue to hold back on drilling and completing wells as they focus on their debt and paying out their dividends. We could see natural gas production drop down by approximately 13 BcF/d, currently it has fallen approximately 7.8 BcF/d and it continues to fall. A hard winter and sharp uptick in economic activity would probably cause prices to spike.
We may see the same thing in Canada because even now from January 1st, 2020 to October 16, 2020, only 2222 wells were drilled. By way of comparison, there were 4312 wells drilled in 2019; in short, we are seeing a drop of about 50%. This will affect the production of natural gas and cause a drop in the natural gas that is exported from Canada. Unique to Canada, the oil sands require about 25% of the natural gas for the oil sands and their SAGD operations, which make up 80% of the oil sands operations.
We are also expecting a La Niña winter, so all of this is setting up for an increase in demand in 2021 while the supply continues to decline. This could cause the price of natural gas to go above $3.50 / MMBtu. We hope this paper has addressed the many variables that can affect such an outlook, but for natural gas producers, hope springs eternal.
With the mergers and acquisitions, we see companies following the recipe of it being an all-stock deal to reduce costs through synergies regarding their overlapping leases. It will be about reducing costs in production and optimizing returns by being able to drill better wells.
Some will switch to variable dividends which means in years with low prices for natural resources oil and gas companies will not pay out as much protecting their cash flows in difficult years.
Our investors want higher returns rather than higher production, so companies are focusing on fully developing their already existing assets to boost returns. Therefore, not many are interested in buying assets.
Money will be spent on innovative ideas of completing some new wells with a combination of new drills and DUC wells, conducting workovers and refracturing to optimize existing wells, and other tactics to manage their decline curves (Johnson and Rossano, 2020). This is reflective in the growing number of frac spreads.
Don’t expect the number of wells drilled to suddenly increase until the second quarter of 2021.
Hopefully with a demand for LNG due to a cooler winter globally because of La Niña, and reduction in production we will see the price of natty above $3.50 / MMBTU.
As to the increase in drilling many operators lack access to capital with little or no liquidity out there, whether it’s debt or raising capital in the public market especially with the number of companies currently seeking restructuring. This may hinder the increase in drilling we normally expect with a rise in the price of oil or gas.
This may lead to the sale of assets, or consolidation through mergers or acquisitions as companies find strength in economies of scale lower overheads, increased bargaining power with suppliers and greater access to debt markets (Turley, 2020; Crowley, 2020).
There are too many operators in some areas causing a checker board of leases and companies are striving to obtain contiguous leases to minimize field costs, optimize production, achieve savings in debt repayments, and reduce operating costs lowering their breakeven costs.
These mergers and acquisitions are beneficial to the industry but will see reduction in jobs as companies do more with less staff as companies try to increase their net income per employee (NIPE). Some successful operators have less than 200 full-time employees.


Join the Conversation
Interested in starting, or contributing to a conversation about an article or issue of the RECORDER? Join our CSEG LinkedIn Group.
Share This Article