Abstract
The Ontario Geological Survey (OGS), in collaboration with the Geological Survey of Canada, was one of the first jurisdictions to collect and distribute pre-competitive, regional-scale, geophysical data. Following the completion of province-wide coverage with low-resolution geophysical surveys, the Ontario Geological Survey is accumulating detailed data over much of the province. Several methodologies are used to obtain the maximum amount of high-quality data at the least cost. Once published, these high-resolution airborne survey data are used for mineral exploration, geological mapping and land use planning purposes. These surveys have proved especially popular with private sector companies and they have been shown to attract mineral exploration investment to the province.
Introduction
The utility of geophysical surveys for geological mapping and mineral prospecting was established in Ontario after a 1944 report by Dr. Arthur Brant, then a University of Toronto assistant professor reporting on the results of ground magnetic, gravimetric and electrical surveys carried out in various parts of the province over the previous six years. Among the several conclusions outlined in the report, he stated that, The usefulness of geophysics can best be developed by: compiling regional results in order that the full usefulness of the cumulative results may be realized
(Brant, 1944). Seventy-five years later, after which a great deal of geophysical data has been collected by government and private sector entities, this continues to be true.
Beyond applications to mineral exploration and geological mapping, regional-scale geophysical survey data are used in land use planning studies, particularly in remote northern areas where the geoscience knowledge base is often limited. An example of such an application is using geophysical information to help identify areas of high mineral potential that might otherwise be set aside for parklands.
History
Technological developments, namely the invention of the zero-length spring gravimeter (Thomas and Gibb, 1977) and the fluxgate magnetometer, enabled systematic, regional-scale geophysical data acquisition consisting of aeromagnetic and ground gravity surveys within the province, beginning in 1947 (Teskey et al., 1993 and Innes, 1960). The initial work was done under the auspices of the Geological Survey of Canada (GSC) and then with the collaboration of the Ontario Department of Mines. Shortly thereafter, the first hand-contoured aeromagnetic survey map of the Arnprior area was published (Geological Survey of Canada, 1949).
By 1967, the entire province had been covered with aeromagnetic surveys, flown at half mile (800 m) flight line spacing and at 1000ft (308 m) altitude. Widely spaced (10 to 15 km) gravity stations had been established across most of Ontario by 1964 (Ontario Geological Survey, 1999). Analogue magnetic surveys were subsequently digitized and compiled along with digital aeromagnetic to create a single, Ontario-wide master grid (Gupta et al., 1989). This grid was used to create a series of 1:1,000,000 scale total magnetic field and derivative maps, published in 1991, covering the province (e.g. Gupta, 1991). A similar compilation of the ground gravity data and derivatives was published in 1992 (e.g. Gupta, 1992).
Beginning in 1975, over a four-year period, the Ontario Ministry of Natural Resources and the Geological Survey of Canada jointly funded a uranium reconnaissance program consisting of airborne gamma-ray spectrometer and lake sediment surveys (Pye, 1991). The purpose of this program was to assist the mining industry in locating areas with high uranium potential.
After the completion of reconnaissance-scale aeromagnetic coverage of the province along with a network of widely spaced gravity stations, it was recognized that more detailed airborne geophysical surveys in high mineral potential areas would help to stimulate mineral exploration.
High Resolution Surveys
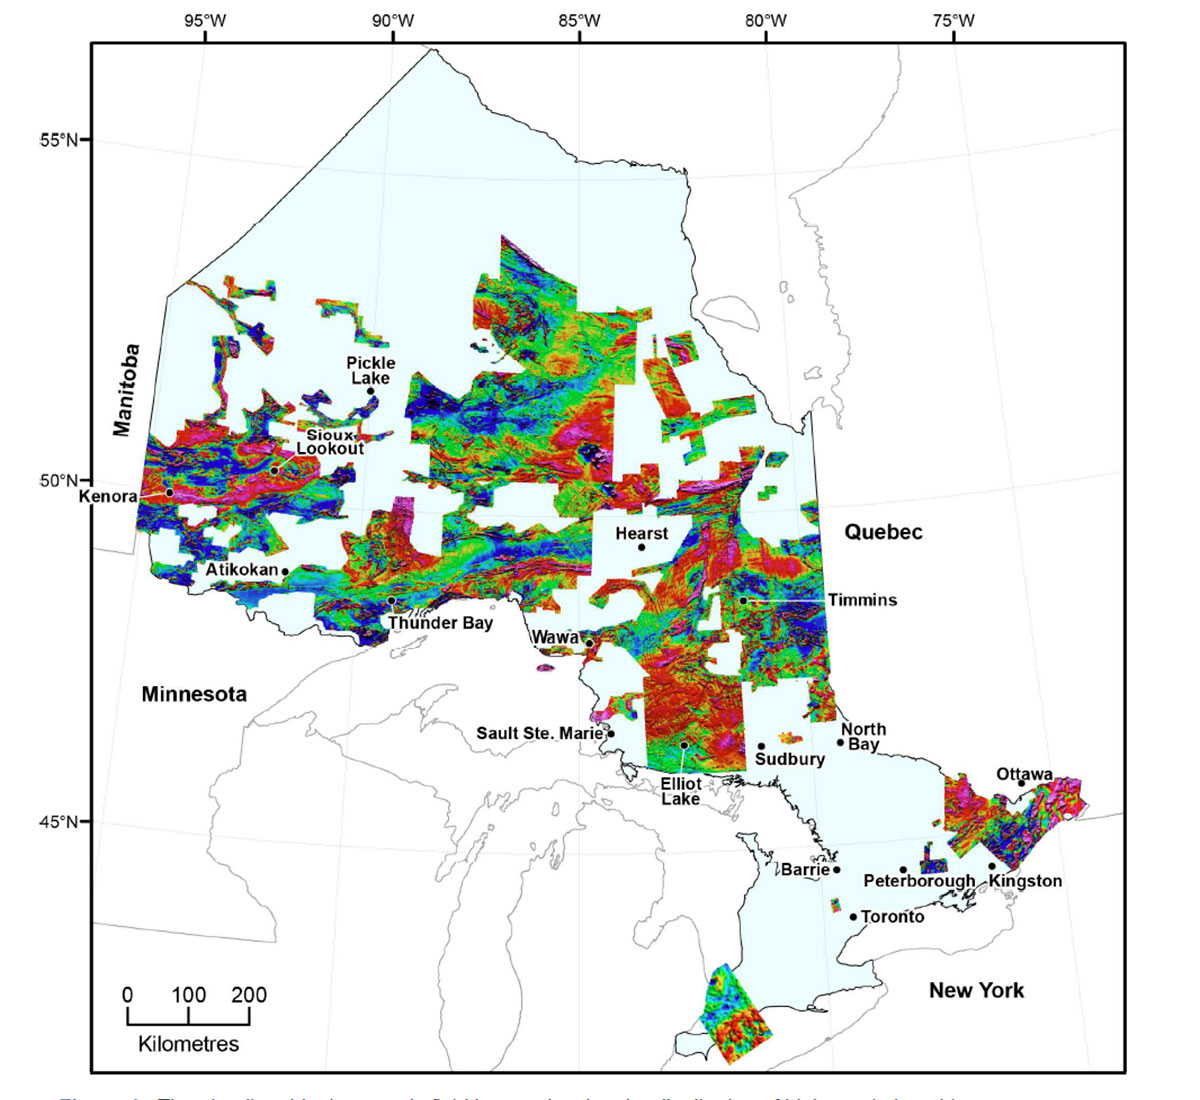
Although, at first, there was some ambivalence within both the OGS and the minerals industry as to whether a government organization should be involved in an activity that was entirely the domain of the private sector, the first high-resolution AEM/aeromagnetic survey was flown in 1975 (Pye, 1991). Since then, airborne geophysical surveys have become a central part of OGS activities. To date, 130 surveys have been flown or acquired and, each year, the highresolution coverage continues to be expanded across the province. Figure 1 illustrates the coverage of the high-resolution aeromagnetic data now publicly available in Ontario. The detailed surveys cover nearly 409,000 sq. km or approximately 38% of the province. The great majority of surveys have been flown at 200 m line spacing. Approximately 66% (34% by area) of the aeromagnetic surveys were flown with EM systems and about 9% (26% by area) with gamma-ray spectrometry. Summary statistics of high-resolution airborne geophysical surveys, currently publicly available in the province, are summarized in Table 1.
| Survey type | No. of surveys | Total line-km | Area (km2)1 |
|---|---|---|---|
| Table 1: Summary statistics of published high-resolution airborne geophysical surveys in Ontario. | |||
| Magnetic only | 29 | 798,759 | 183,725 |
| Magnetic/EM | 86 | 946,147 | 167,607 |
| Magnetic/Radiometric | 12 | 691,790 | 127,775 |
| Magnetic/Gravity | 3 | 37,461 | 14,174 |
| 1 Cumulative total is inclusive of survey overlap | |||
Ground gravity, supplemented by a few airborne gravity surveys, continues to be acquired in areas of high mineral prospectivity or for groundwater projects. These data are helping to infill the coarse, province-wide coverage completed in the 1970s.
Other Data
In addition to regional-scale geophysical data, other important data types are publicly available. Magnetic susceptibility data are gathered each field season by geological mapping crews for compilation and publication in GIS and other formats (Muir, 2013). Similarly, a specific gravity database, compiled from measurements on 26,079 samples collected for geochemical analysis, has been published (Rainsford et al., 2018). Seismic reflection transects and magnetotelluric (MT) data, acquired through various publicly funded or government/industry initiatives, are available in geographically limited and widely dispersed areas of the province.
Area Selection
With an area of slightly over a million square kilometres, Ontario is the combined size of Europe’s two largest countries (France and Germany). Because of the enormous area, systematically acquiring blanket, detailed geophysical coverage has not been feasible. Instead, the acquisition of high-resolution airborne geophysical data has been carried out strategically. Area selection has taken into account such factors as prospectivity, client input, funding opportunities and support for geological mapping.
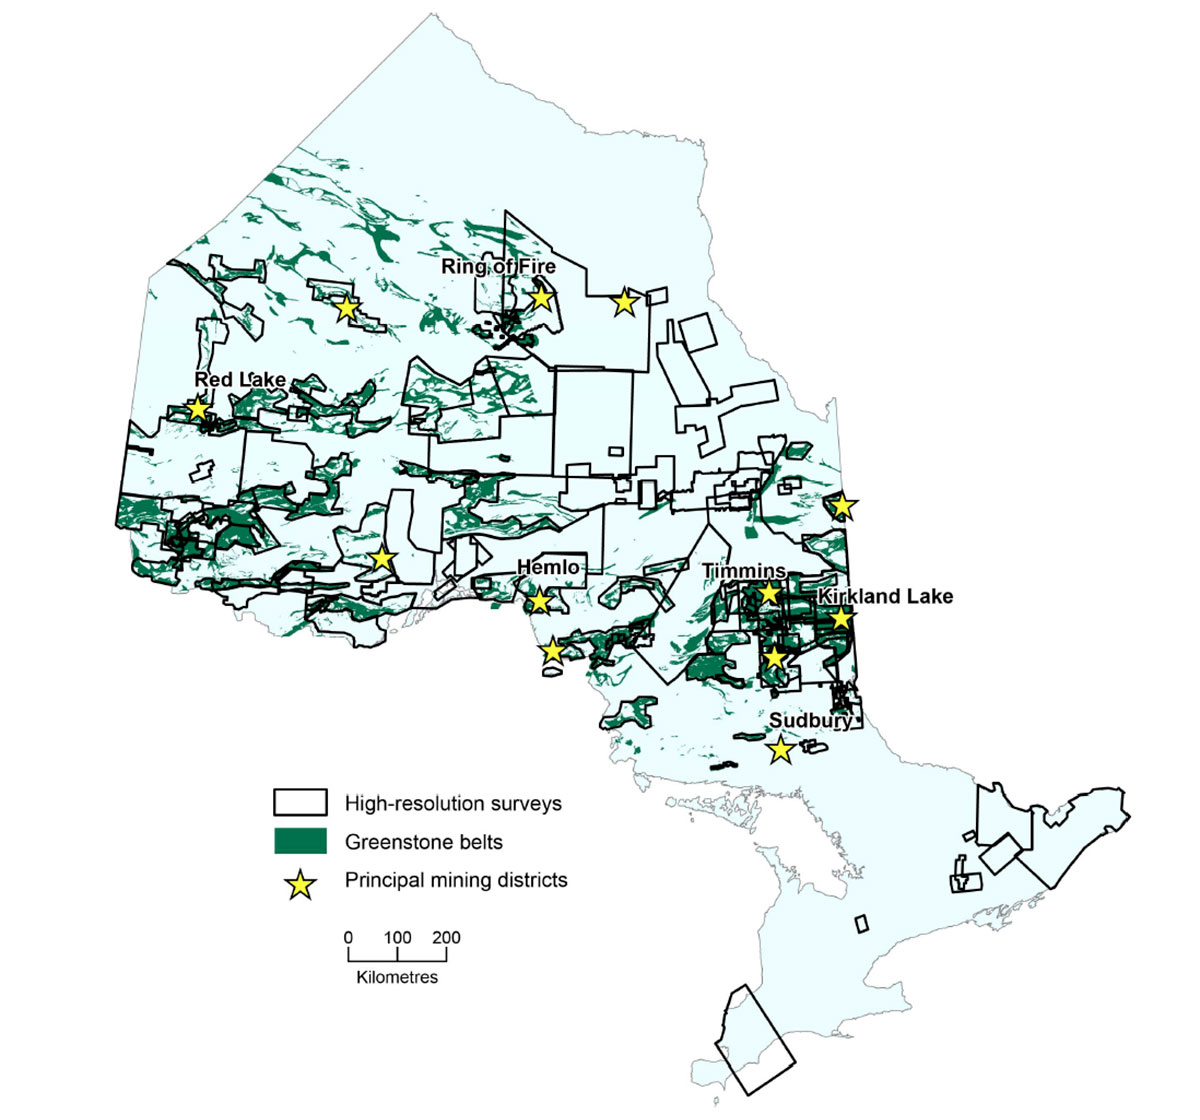
Mineral prospectivity is often the most important factor in deciding where to commission airborne geophysical surveys. Almost all of Ontario’s principal metallic mining districts are located in Archean greenstone belts. These greenstone belts are understood to be ancient island arcs, containing cycles of volcanic and sedimentary rocks, similar to the present-day Japanese archipelago (Taira et al., 1992). As can be seen in Figure 2, priority has been given to acquiring data over these greenstone belts. Note that the apparent absen00ce of greenstone belts, in the northernmost and northeastern parts of the province, is due to them being covered by younger Paleozoic sedimentary rocks. As the overlying sedimentary rocks are magnetically transparent (i.e. near zero magnetic susceptibility), the observed magnetic patterns of the basement rocks provide strong evidence of the presence of greenstone belts below the Paleozoic cover.
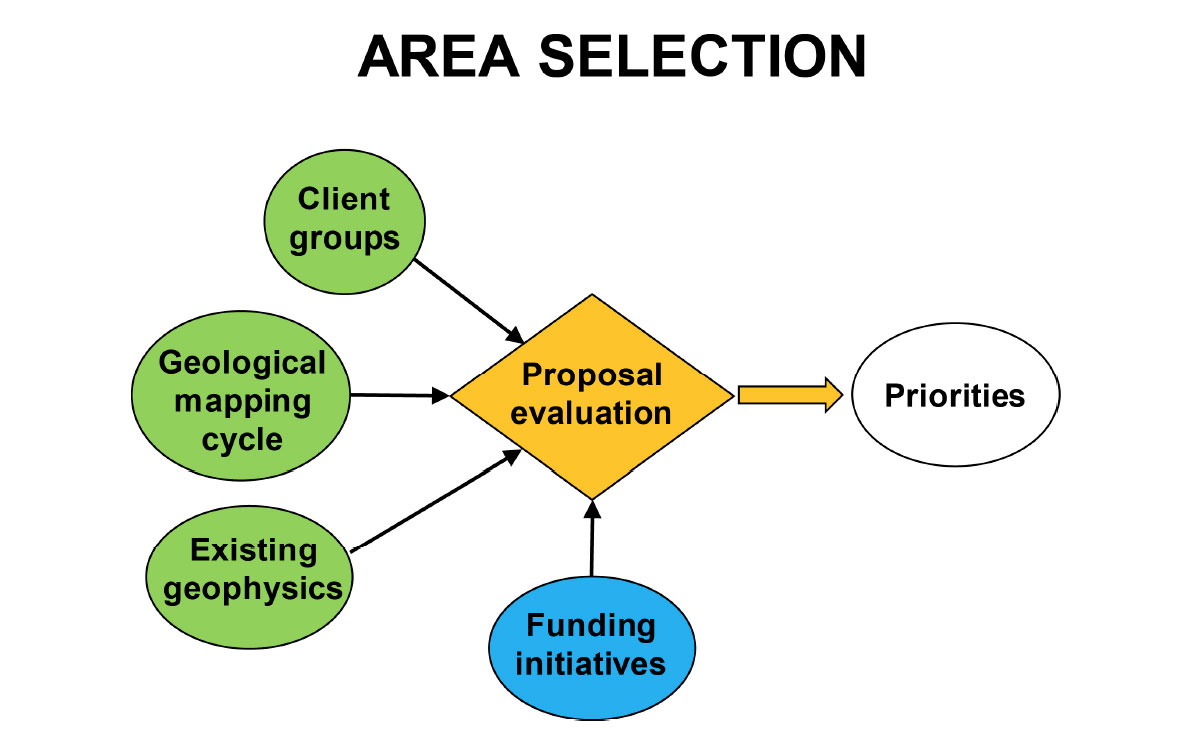
Beyond purely economic potential, areas are selected based on a number of factors summarized in Figure 3. Input from external client groups (minerals industry, local government and First Nations) as well as from internal ones (e.g. geological mapping projects and groundwater studies) is solicited. These needs are assessed against the type and quality of existing geophysical coverage to determine if further data acquisition is warranted. If external funding is available, this can be an overriding factor in area selection as funding is often regionspecific. All these factors are used to develop a standardized project proposal for each candidate area. The geophysical proposals are scored against the same evaluation criteria (e.g. geoscience need, likely benefits, client backing and risk) used for all other OGS geoscience proposals. Those proposals scoring highly are then added to a portfolio of airborne geophysical projects selected for future completion. Priorities of approved but un-flown surveys are reassessed each year. Should any externally resourced initiatives become available in the meantime, pre-screened surveys can be rapidly implemented to take advantage of new funding.
Acquisition Models
Several methods of survey acquisition are employed to minimize cost and maximize the data obtained. These methods are summarized in Table 2. Surveys commissioned and fully funded by the OGS allow complete control over the location and all technical details. These benefits are partially offset by the fact that the money to fly these surveys comes from the core OGS budget. Surveys, acquired via government/industry/community initiatives, have the advantages that they are funded externally and the OGS has substantial control of technical details (i.e. survey parameters, QA/QC and deliverables). Examples of externally funded initiatives are the Lake Nipigon Region Geoscience Initiative (Easton et al., 2007) and the Discover Abitibi Initiative (Ayer & Calhoun, 2005). As these initiatives are often partly politically motivated (e.g. to promote regional economic development), there is reduced control over the timing and location of surveys flown under these programs.
From time to time, the OGS solicits the minerals industry to purchase previously acquired, proprietary airborne geophysical data. Data are assessed for quality and whether they provide new coverage with respect to the existing OGS survey inventory. Those surveys that are accepted are purchased at a fully discounted rate that is roughly between 10 and 20% of the cost of commissioning a new survey. The purchased surveys are reprocessed and published as standard OGS airborne survey products. Although acquiring data this way is highly costeffective, the survey areas tend to be small and there is, of course, no control over the survey specifications.
The last of the acquisition models is the donated data category where companies or organizations have generously provided airborne survey data at no cost.
| Acquisition Model | Pros | Cons | |
|---|---|---|---|
| Table 2: Comparison of data acquisition models. | |||
| Commissioned | Full control over survey specifications, location and timing. | Funding from core budget. | |
| Government/industry/community initiative | External funding, little impact on core budget, substantial control of technical specifications. | Only partial control over survey location and timing. | |
| Data purchase | Low cost to acquire data, vendors can use proceeds for further exploration. | No control of survey specifications and location. | |
| Donation | No cost to acquire data. | No control of survey specifications and location. | |
Quality Control
Rigorous technical specifications are set for commissioned surveys and those acquired through externally funded initiatives. QA/QC at all stages of the surveys, including calibration, data acquisition, processing and the creation of final deliverables is generally assigned to a third-party consultant. Once received, the final deliverables, including digital data archive, map products and report are then subjected to additional in-house checks, for completeness, statistical verification, data formats and report content prior to publication.
Although technologies have evolved since high-resolution surveys began to be flown, and many different systems have been used to acquire the same data type, the OGS has maintained a standardization of products and formats to achieve consistency between surveys. The goal is to provide products that are ready to use, easy to integrate with other data, and in formats that are supported by a wide variety of processing and visualization platforms. Typical products resulting from these surveys are summarized in Table 3. These are the minimum deliverables for publication. In some cases, contractors have chosen to provide additional products which may then be included in the published data set.
The intent of the QA/QC process is to ensure that the published products are complete, meet robust data quality standards, are cartographically accurate, and are thoroughly documented. The documentation provides information on all survey parameters, calibration data, processing details and digital products. While many clients will find the grids, geotiffs, vector files and maps sufficient for their needs, the published geophysical data sets and documentation allow users to create their own customized products from the provided databases which include both processed and unprocessed data.
| Survey Product Type | Description | ||
|---|---|---|---|
| Table 3: Typical publication products. | |||
| Profile data (ASCII and binary formats) |
Unprocessed and processed channels of sensor data with positional and ancillary information, gamma-ray spectra. |
||
| Point Data (ASCII and binary formats) |
Gravity stations and reduced channels. | ||
| Anomaly Databases (ASCII and binary formats) |
Picked EM anomalies and derived parameters, kimberlite correlation coefficients. | ||
| Grids (ASCII and binary formats) |
Residual magnetic intensity and 2nd vertical derivative, horizontal gradients (magnetic gradiometer survey), apparent conductance/conductivity/ resistivity, EM decay constant, bouguer gravity, 1VD bouguer gravity. |
||
| Vector Files (DXF format) |
Flight path, Contours (gravity, magnetic, EM), anomaly symbols. |
||
| Geotiff Images | Georeferenced images of gridded products on topographic base. | ||
| Report | Survey logistics and processing report. | ||
| Map Products (PDF and paper copies) |
1:20,000 scale EM anomalies and contoured magnetic data, 1:50,000 RMI, shaded 2VD magnetic field, EM decay constant, apparent conductance/conductivity or resistivity, Bouguer gravity and 1VD Bouguer gravity, ternary Potassium-eThorium-eUranium. |
||
| Other | EM waveform database, Streaming EM data |
||
Merging of Surveys – “supergrids”
Over time, as the number of high-resolution aeromagnetic surveys increased and because many of them were clustered in high-priority areas, it became useful to merge them. This was achieved by first levelling the individual surveys to the Ontario magnetic master grid and then stitching the magnetic survey grids together in a process described by Reford et al., 1990. The near-seamless merging of magnetic data provides users with an expanded, high-resolution regional view without having to assemble the results from multiple adjacent surveys. These magnetic “supergrids” are updated from time to time so as to integrate newly acquired data. The most recent release (Ontario Geological Survey, 2017) comprises seven supergrids, incorporating the results of 109 surveys covering an area of 328,186 km2 or about one third of the province. Both merged residual magnetic intensity and second vertical derivative grids are included in the supergrid publication.
Merging of airborne EM grids (i.e. apparent conductance or conductivity) has not been attempted due to the variety of systems used and lack of a standard calibration.
Data Distribution
The first geophysical data set, issued on both a single CD-ROM and an 8 mm tape (ERLIS data set 1) containing the “Single Master” aeromagnetic grid of Ontario was priced at the princely sum of $1,000 (Statistics Canada, 1994). It was quickly recognized that the true value of the data sets is only realized when they are widely distributed among users. Thereafter, geophysical data sets and associated map products were sold at a nominal cost that reflects only the cost of reproduction.
All geophysical data sets are still issued on DVD-ROM and in paper map form, both of which are available by mail order. Most users choose to download digital data or PDFs of map products from one of two internet portals. As opposed to the nominal cost of media, downloads are free of charge and instantly available.
Geology Ontario is a text-based discovery tool that provides access to all OGS publications (past and present), mineral deposit inventory, Ontario drill hole database and Ontario assessment files. Geophysical data and maps may be downloaded using this tool.
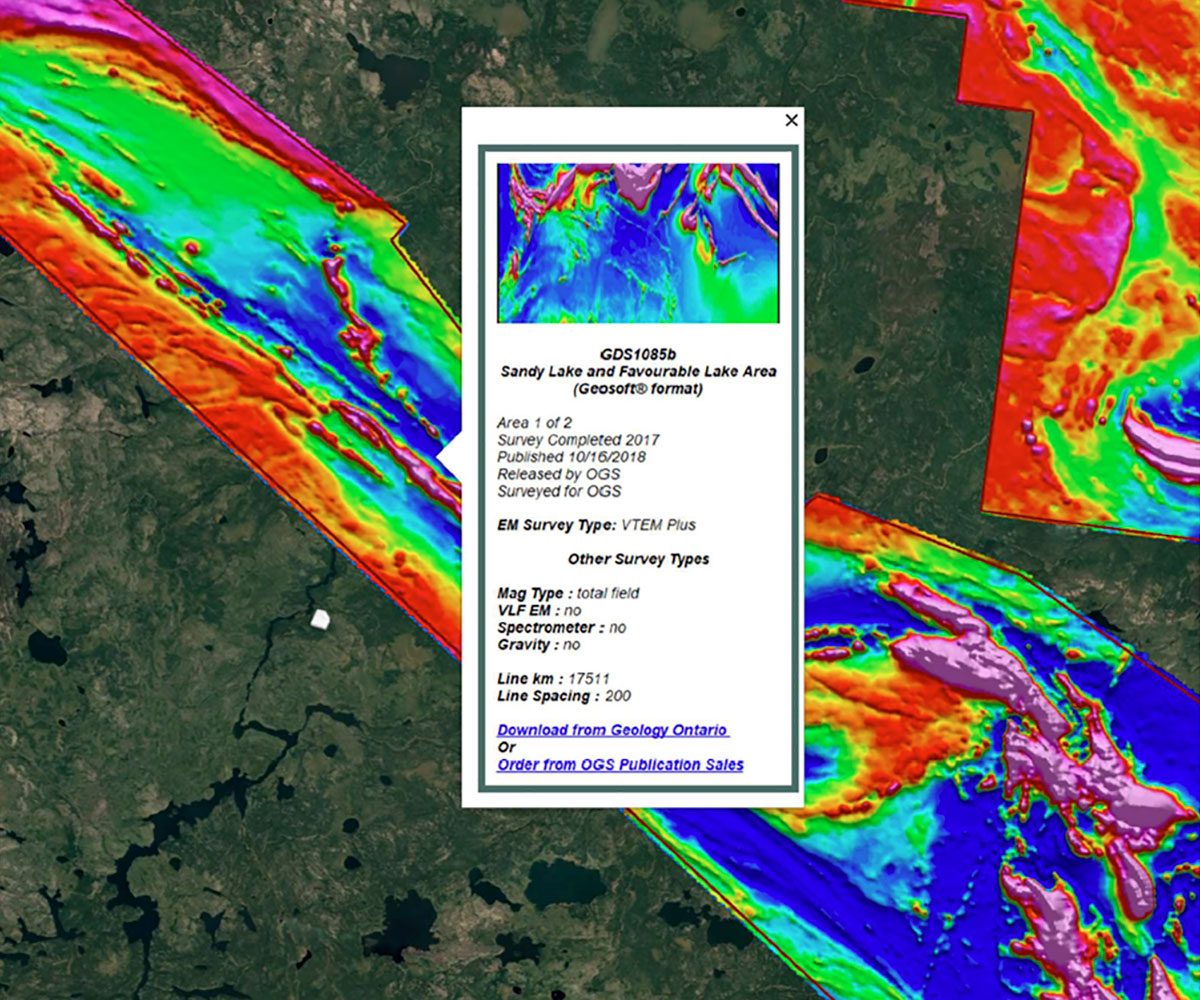
OGS Earth is a more recently developed application which is based on the freely available Google Earth™ utility. OGS Earth offers a series of KML files; one for each geoscience data type. Users can rapidly view the appropriate KMLs in Google Earth and identify which data sets are available in their area of interest. A pop-up window (Figure 4) provides metadata and a link to download the data set. This has proven to be an intuitive and popular tool, although it does lack some of the abilities of text-based searches.
Impact
The collection and dissemination of high-quality geoscience data combined with exceptional mineral endowment has helped to position Ontario as one of the premier destinations for global mineral investment. It has long been recognized by many jurisdictions within Canada and overseas that government-funded, pre-competitive geoscience stimulates private sector investment in mineral exploration critical for the discovery of economic resources. The benefits of pre-competitive data have been discussed by various authors (e.g. Hutchins et al., 2007) and estimates of the amount of private sector exploration activity that arises from each dollar spent range from $2.5 to $10, from which result in-ground discoveries valued between $100 and $150 (Geoscience Australia, 2002).
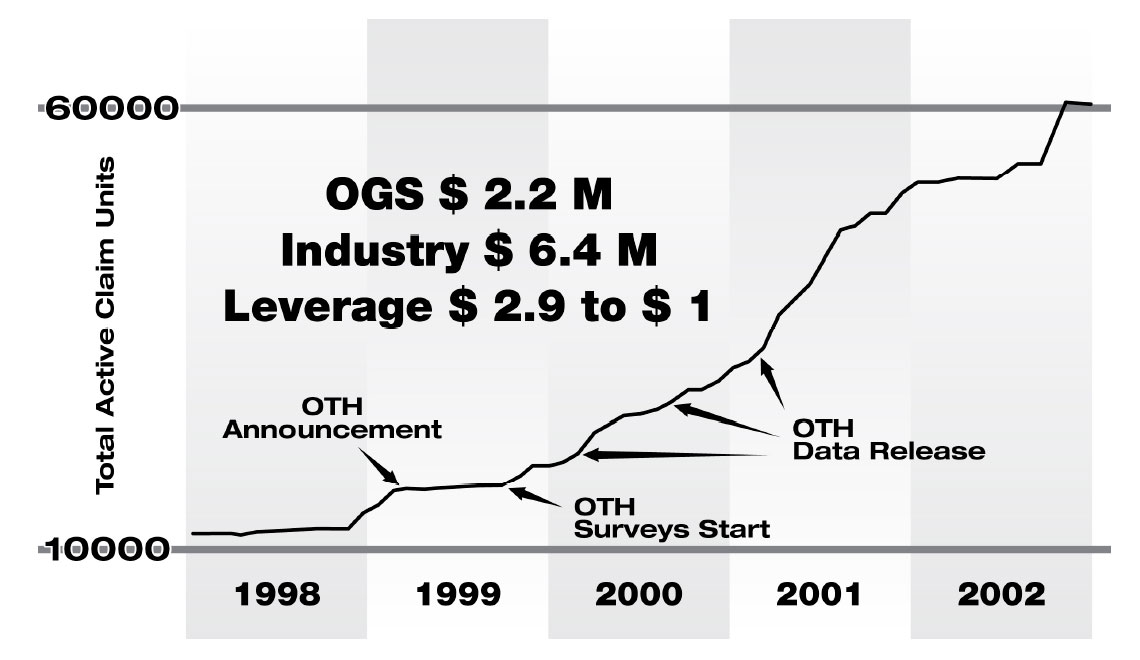
As part of a results-based management exercise to assess the impact of the $29 million, threeyear Operation Treasure Hunt geoscience program, the OGS engaged a consultant who interviewed approximately 180 clients (including prospectors, geologists, exploration managers and consultants) randomly selected from a client list (Fyon et al., 2002). The interviews showed a high degree of awareness of the program (79%), of which 87% of respondents indicated that they were satisfied or very satisfied and 42% indicated that they were planning on increasing their investment in Ontario through prospecting, exploring or mining in the near future. Although, at the time of the client survey, the full impact of the program had not had time to develop, Figure 5 shows that, even over the short term, significant increases in exploration activity could be directly attributed to the release of new airborne geophysical data.
Future Directions
Industry clients continue to indicate that data gathering (i.e. increasing survey coverage) is their highest priority and approximately half of the province remains to be flown with high-resolution surveys. Of the parts of Ontario not yet surveyed with high-resolution airborne geophysics, large areas are overlain by thick Paleozoic sedimentary cover rocks or composed of Archean granitoids, both of which have limited potential for metallic minerals and are therefore assigned lower priority for coverage.
As more mining jurisdictions around the world use pre-competitive geophysics to attract investment, for Ontario to maintain its competitive advantage there is an imperative to evolve the services and products that it offers. Airborne gravity (particularly gradiometer) has been shown to be an excellent tool for mapping geology in areas with sparse outcrop (Rainsford et al., 2017) and it is likely to see expanded use in remote northern areas. Although the OGS routinely releases a range of geophysical products and formats in order to accommodate a variety of client needs, there is an opportunity to develop further “value-added” deliverables, such as additional potential field derivatives and 3-D inversions. Increases in computing power and software developments have reduced the cost of creating these products.
The collection of digital data, as a requirement of assessment report filings for mineral claims, is well established in several other Canadian provinces (e.g. British Columbia, Manitoba, Quebec and Nova Scotia) and in other countries. Adopting this requirement in Ontario will enhance the range of geophysical and other digital geoscience data available and will accelerate the accumulation of high-resolution airborne geophysical coverage in Ontario.
Conclusions
The collection and dissemination of pre-competitive geophysical data in Ontario has long been a core function of the OGS. Almost from the outset it was understood that the publication of high quality, high-resolution data helps to stimulate mineral exploration. This has been demonstrated both anecdotally through client feedback and by results-based metrics.
Challenged by limited resources and a large territory to cover – much of it remote with sometimes difficult logistics – the OGS has taken advantage of various acquisition models to obtain high-resolution airborne geophysical data well beyond what could be achieved with its own resources. Strong client support, particularly from the mineral exploration community, has provided an ongoing incentive for the provincial government to back the collection of precompetitive data.
By maintaining good relations with industry and other client groups, new projects incorporating external input continue to be developed and implemented. There continues to be great opportunities to expand the present geophysical coverage, extend the array of products offered, and to find new ways of acquiring data at low cost.

Related Reading


Join the Conversation
Interested in starting, or contributing to a conversation about an article or issue of the RECORDER? Join our CSEG LinkedIn Group.
Share This Article