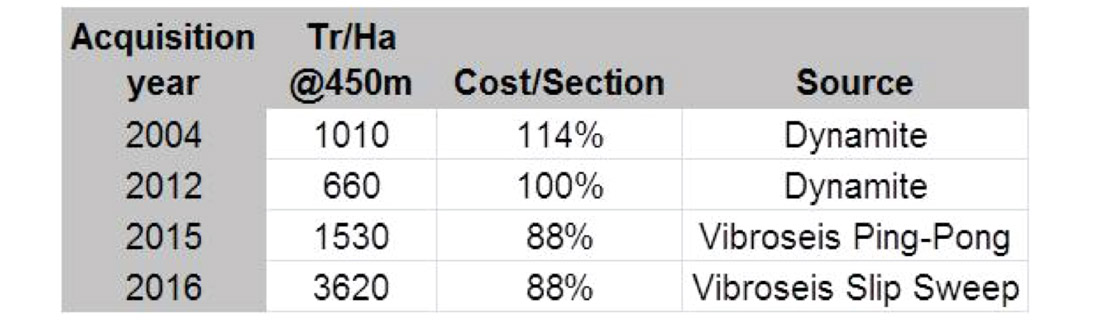
Challenging the status quo to optimize 3D acquisition has been a focus of the Foster Creek team since late 2014 when Cenovus initiated a pilot project to decrease the cost of acquiring 3D seismic data. The challenge was to decrease acquisition costs while maintaining data quality and safety standards. Over the past 20 years, surveys in this area had been acquired with a dynamite source and an orthogonal 3D design. Bin size was either 10x10m or 15x15m with a trace density at target depth of 1010 and 660 Tr/Ha (fold of 14 to 16 respectively). This data represented the standard for comparison to any changes in acquisition parameters. It is worth noting that other acquisition geometry styles are not being investigated in this study. Other influencing factors such as patch dimensions are also kept constant.
At Foster Creek in Northern Alberta, the target depth is around 450m from surface and typical frequency range is 6-180Hz. In the past, monitor 4D’s frequently made use of Vibroseis as an infill source, as the setback distance around infrastructure is smaller than for a dynamite charge. Testing done in 2013 indicated that Vibroseis sources could replace dynamite on future baseline surveys. However investigation and testing was required before making any significant changes.
Modelling indicated that in this area, the cost to acquire a Vibroseis survey is approximately 20% less than an equivalent dynamite survey. Vibroseis also offers ‘on the fly’ program scope changes which are difficult to achieve with dynamite sources. Auger drilling and preparing shot holes is one of the most dangerous undertakings in seismic (dynamite) acquisition; requiring the handling of un-detonated explosives, and risk of musculoskeletal injuries. Vibroseis eliminates these risks and hence eliminates a significant safety concern. These points as well as others led us to investigate the possibility of acquiring future 3D’s in the area with Vibroseis.
This study spanned over two years (Q4 2014 through Q1 2016), in an effort to have geophysics bring increasing value to our operations. It has led to a heightened awareness of the importance of 3D design, and more specifically to the trace density we are achieving at the target zone. We have increased our trace density by more than 500% while decreasing acquisition costs by 12%. This dramatic increase in trace density was achieved through a series of well-designed field tests and analysis, where each test was built on the findings of previous tests. In completing this study we now see additional areas where cost savings can be found without impacting data quality.
Field test design 2014 & 2015
In order to design an effective test we first need to define the challenge – what would success look like? The initial objective of the project was to improve the seismic response of Vibroseis source so that it might match the response from dynamite. We aimed to design a multi segment Vibroseis sweep, so that the response at the reservoir level would be better than that obtained by using a linear or simple non-linear sweep, and equal to the response from dynamite. With background knowledge of the spectral content of the existing data, sweeps were designed to optimize both the PP & PS data. The PP & PS components have differing requirements – a broad spectrum for PP, and a strong low end requirement for PS data.
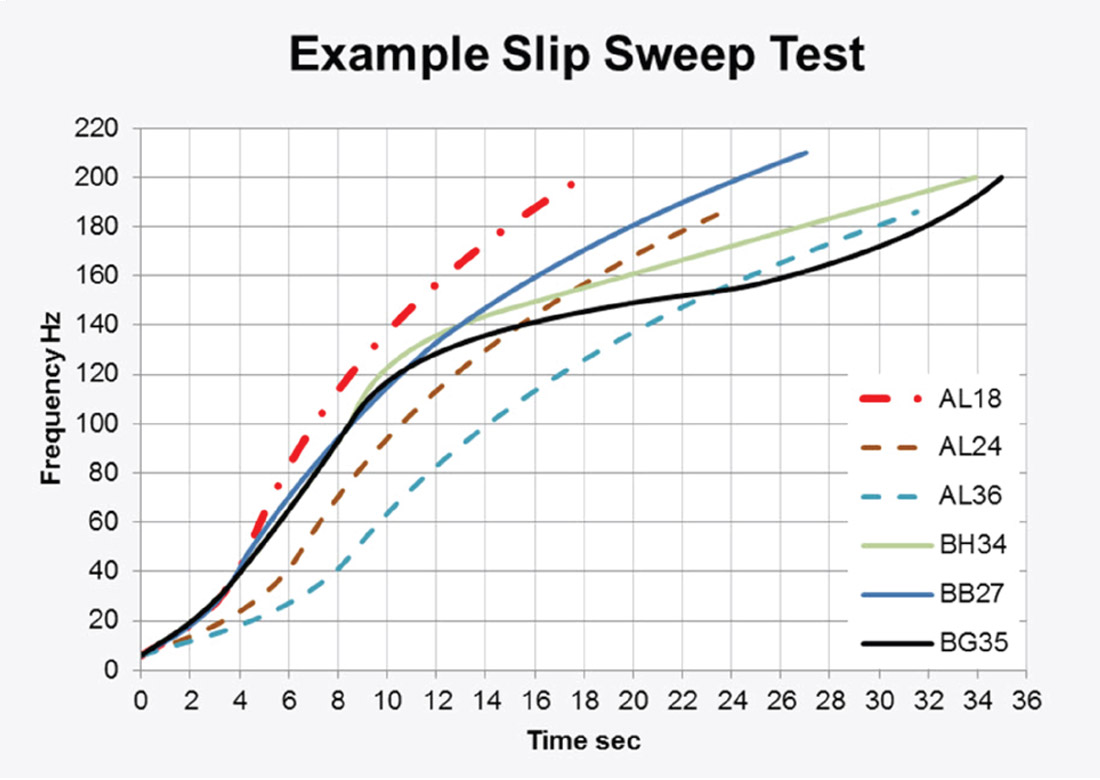
Figure 1 shows how we divide the spectrum into three segments: the mid band, which is relatively easy to acquire, while the low and high bands are more difficult to acquire, and thus require the sweep to dwell in these ranges. The challenge was to design sweeps that move smoothly through the bandwidth, dwelling in areas where the recorded energy is attenuated, while transitioning between ranges without causing artifacts.
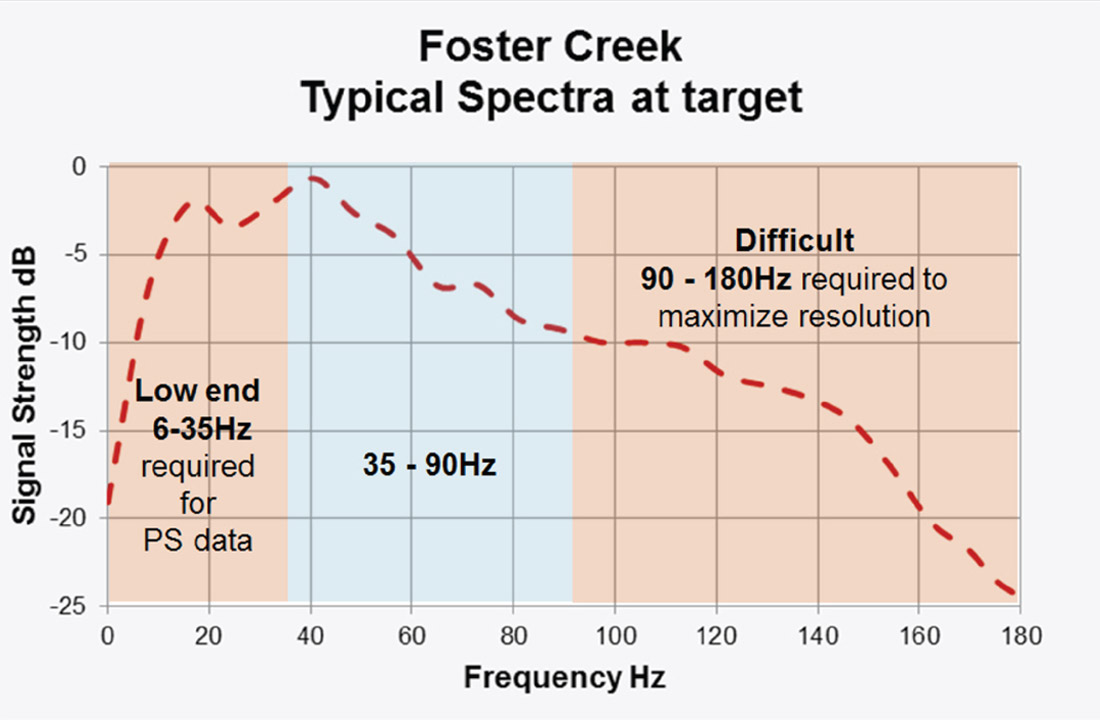
By dividing the spectra into three or four regions we can focus on the time being spent in each region and assess the merits of any given sweep as such. It is relatively simple, though somewhat tedious, to design a wide variety of sweeps which can then be evaluated for inclusion in the actual field test.
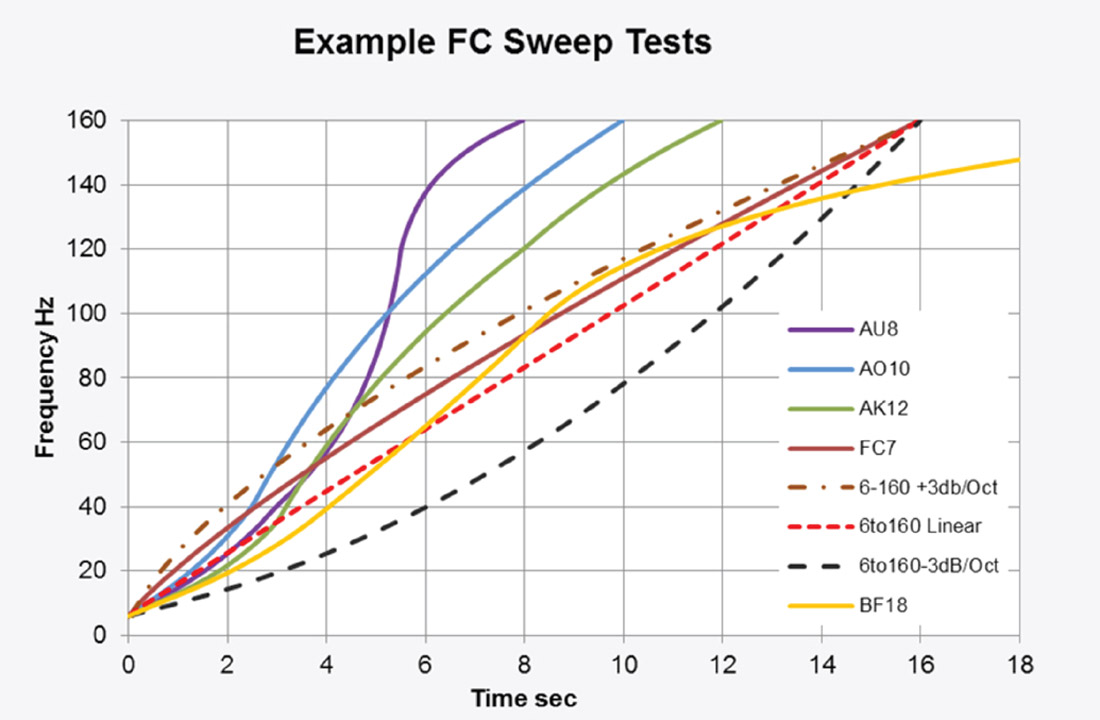
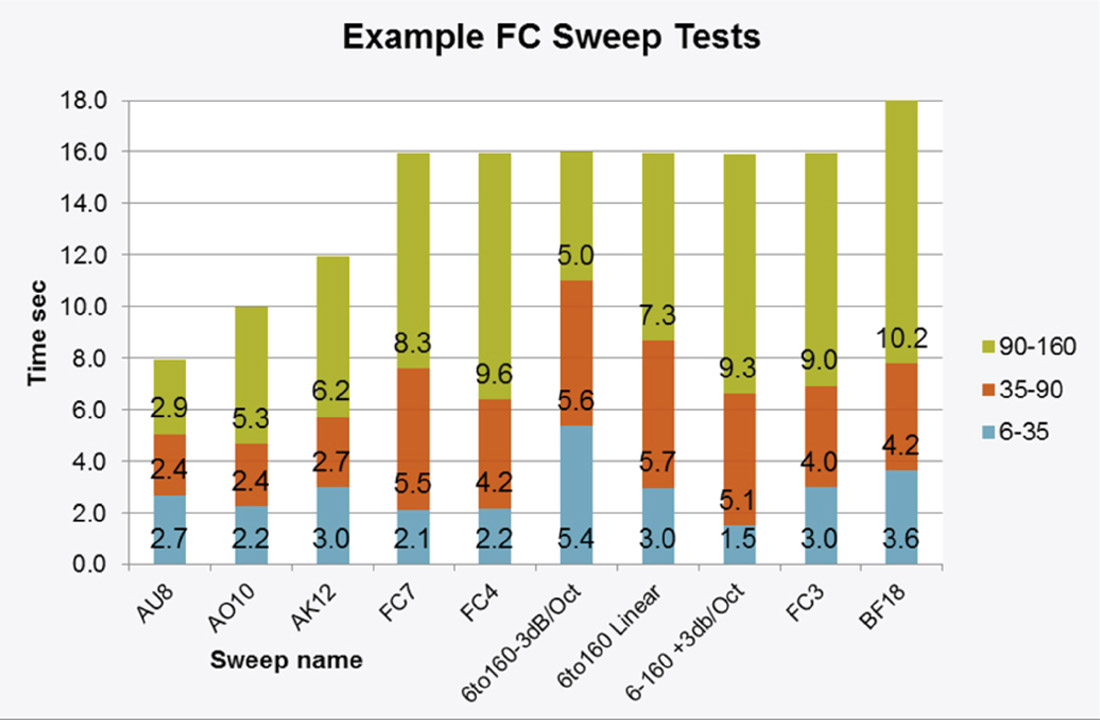
Figures 2a and 2b show some sample segmented sweeps and their times spent in each frequency band. Of note here is that all of the custom sweeps shown in this paper are for demonstration purposes only, as our production sweeps are proprietary.
On the initial 2014 2D test line seven custom sweeps were acquired in the field. For benchmarking, dynamite and three traditional sweeps were also acquired; a linear sweep, a simple high dwell and a low dwell sweep.
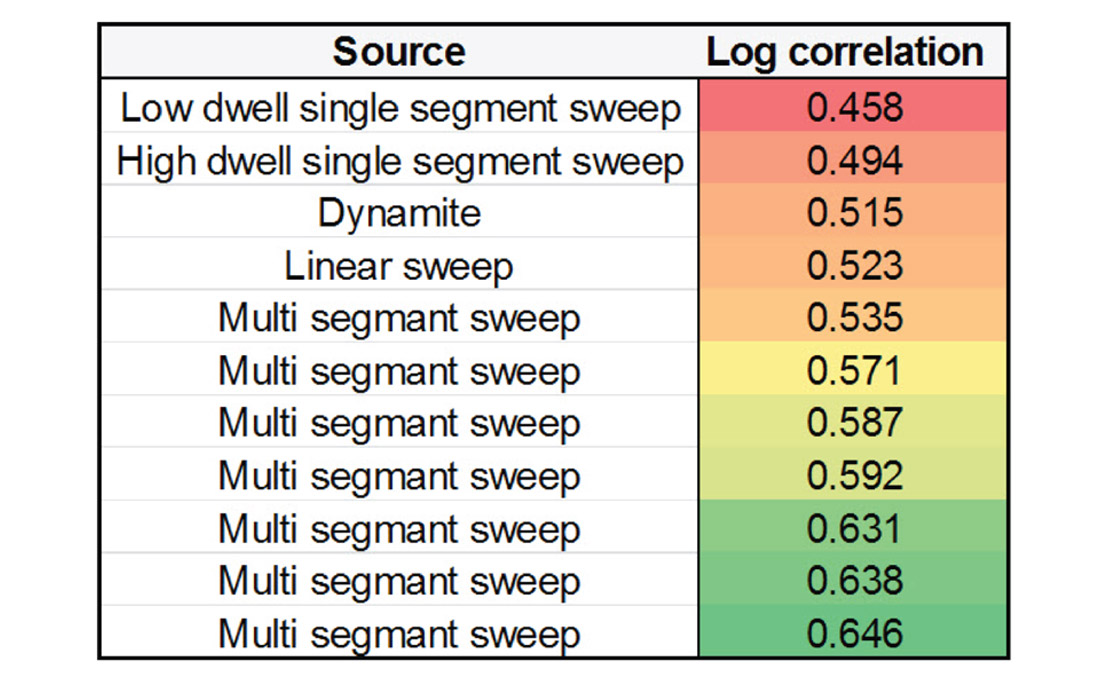
These lines were processed to structure stacks, and analysis was performed on stacks and gathers. Various methods were used to quantify the best sweep. The primary method involved correlation with wells Figure 3 shows segmented sweep data having a better correlation to the synthetic, which was generated with a wavelet extracted from the datasets individually. Of note here is that in this area a correlation of 0.6 is considered acceptable.
Spectral content, continuity through the target zone and phase stability were also considered. Finally, the post stack inversion of the data was evaluated to high-grade sweeps to move on into PS processing and subsequent analysis. In addition, optimal sweep effort and bin size were also established through decimation of the dataset.
Findings from this initial test included:
- As a proof of concept, we could replace the dynamite source on future 3D surveys in the area with Vibroseis using a multi-segmented sweep.
- There was an opportunity to increase lateral resolution by reverting back to 10x10m bins, as on this test Vibroseis was returning a broader bandwidth than our historical dynamite source.
- Muskeg terrain is not as significant an issue as originally anticipated.
- Optimizing the number of sweeps per shot point increased operational efficiencies, without degrading the stack quality.
In January 2015, prior to acquisition of a 37km2 3D, two additional 2D test lines were acquired each with differing near-surface conditions. The goal of this test was to de-risk the production acquisition, testing areas with poor surface conditions, and further refining our selected sweep. In addition, a new set of sweeps from 8s to 22s were evaluated against other dynamite options.
Production acquisition
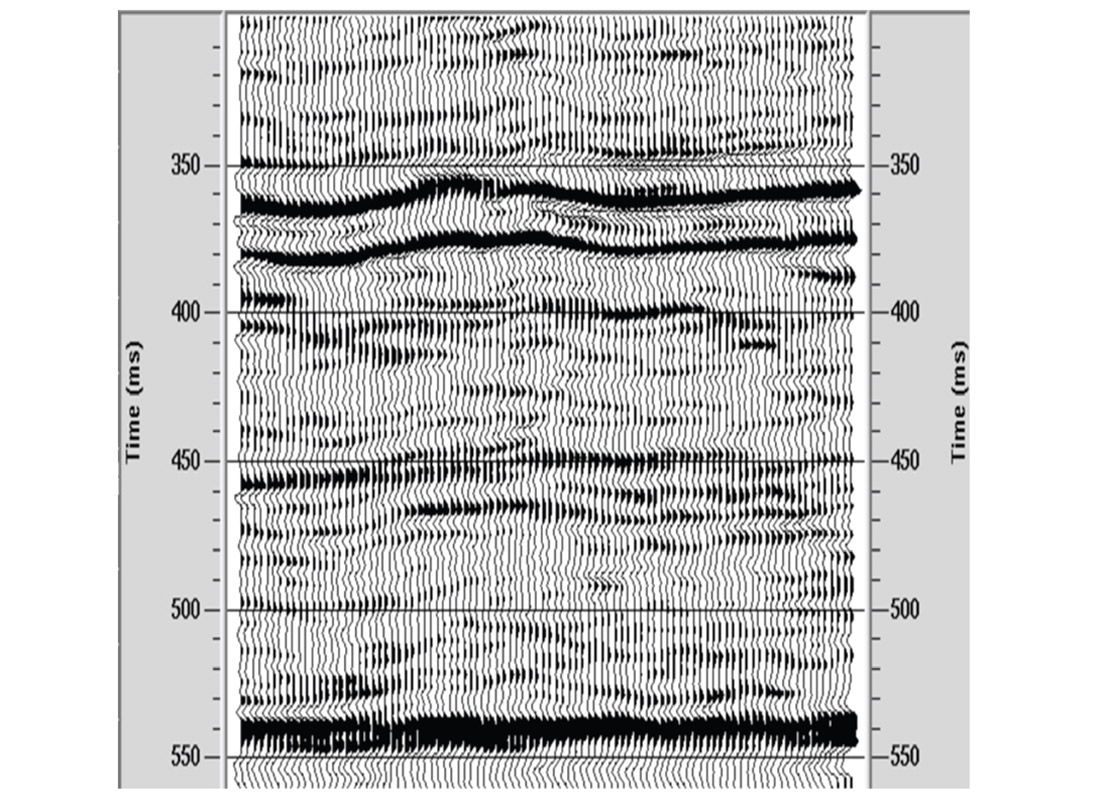
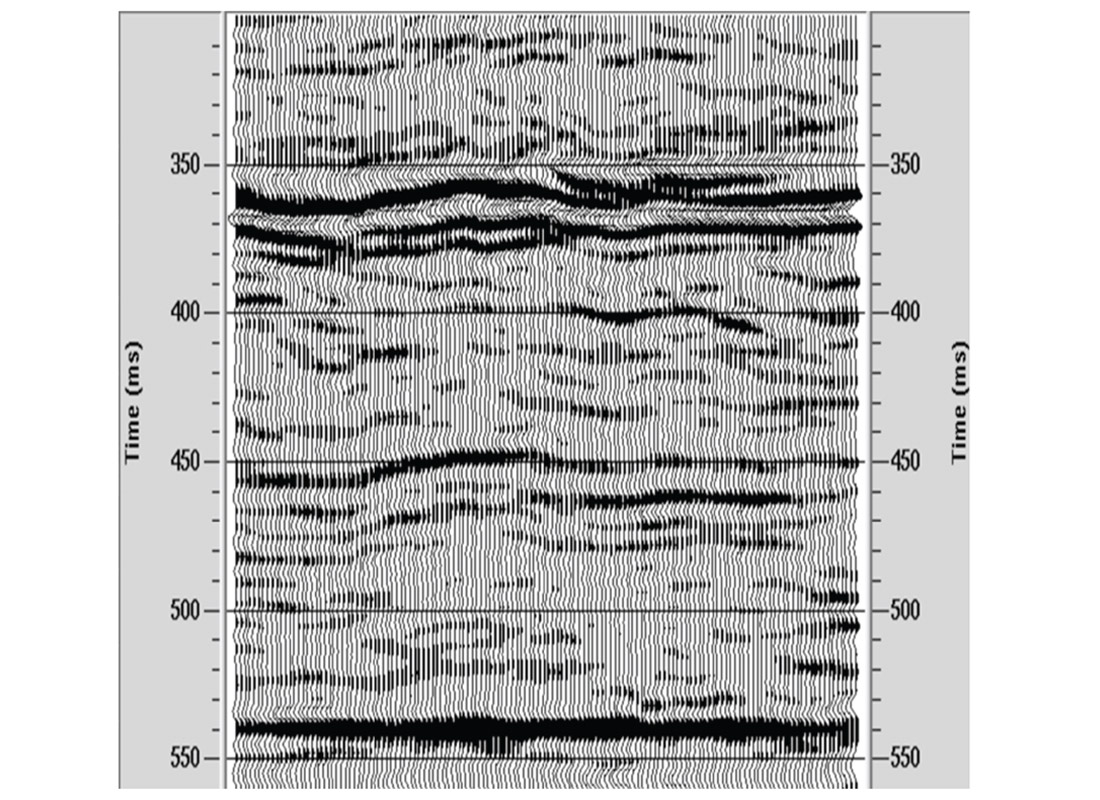
Figures 4a and 4b demonstrate the improvement in resolution achieved with Vibroseis, the associated inversion also tied the impedance logs better than did the dynamite data. With these results, we acquired a 37km2 3D in February 2015 using a segmented Vibroseis sweep and a redefined orthogonal design. We were able to leverage some of the initial estimated savings using Vibroseis acquisition into achieving higher trace densities through decreased line spacing. Additional savings were also achieved through sweep effort optimization.
The actual acquisition costs were reduced by 22.5% over the equivalent high density dynamite survey, or 12% less than the low the density dynamite survey over the same area.
Data validation from an interpretive viewpoint
Ultimately data quality must be assessed by the interpreter; here we compare some of the attributes of the dynamite and Vibroseis data sets from the 2015 program and the adjacent dynamite survey.
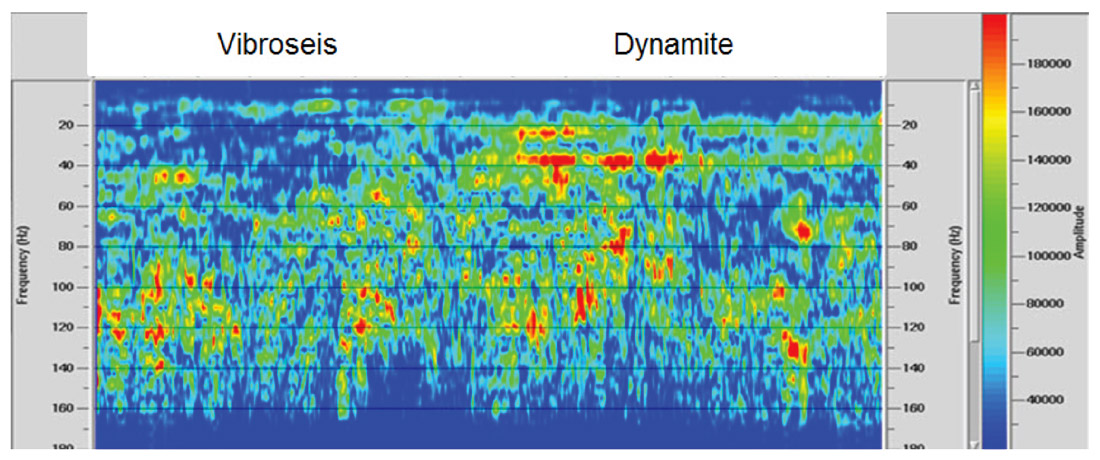
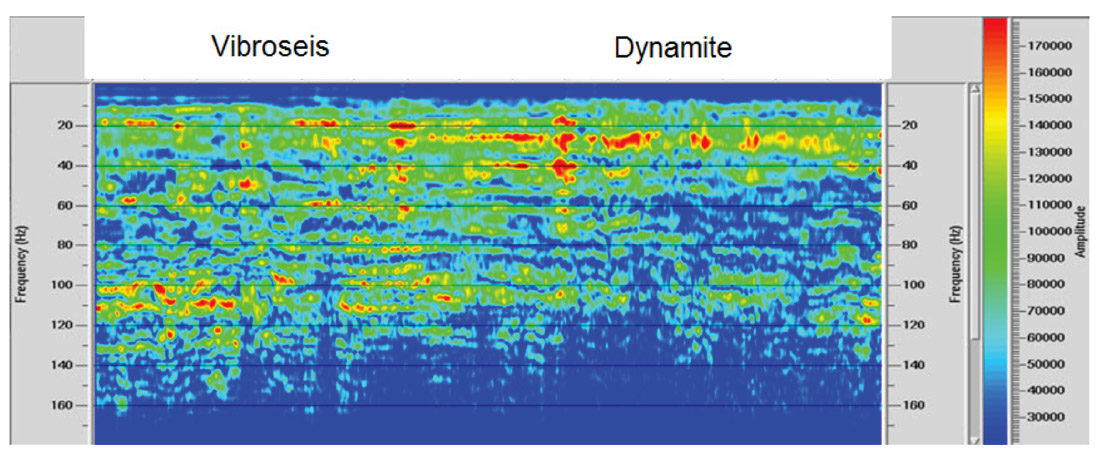
Frequency content of the seismic data has a direct impact resolution – the higher the frequency, the better the resolution (Chen and Schuster, 1999). Within the area of interest, there is a regional gas zone at ~350ms, which results in significant attenuation and reduction in frequency content within the dynamite data. By having the Vibroseis sweep spend more time in the high frequency region, we can get back more high frequency coherent signal at the target zone. Figure 5a demonstrates that the 60Hz to 140Hz band is relatively balanced above 300ms on both the dynamite and Vibroseis section. However in the zone of interest this high frequency component has been absorbed, leaving the dynamite section lacking on the high end. Figure 5b shows that the spectrum through the zone of interest is clearly more broadband on the Vibroseis data than on the dynamite portion of the section. Well logs along this line indicate that the assumption that the earth reflectivity is a ‘white’ spectrum is in fact valid, and we can say any changes in frequency content are due to the input signal changing and are not geologically controlled.
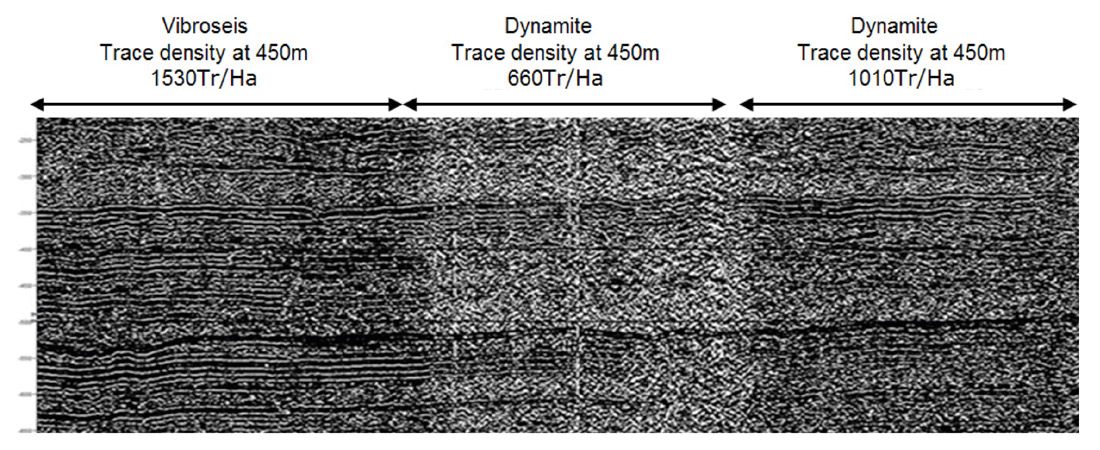
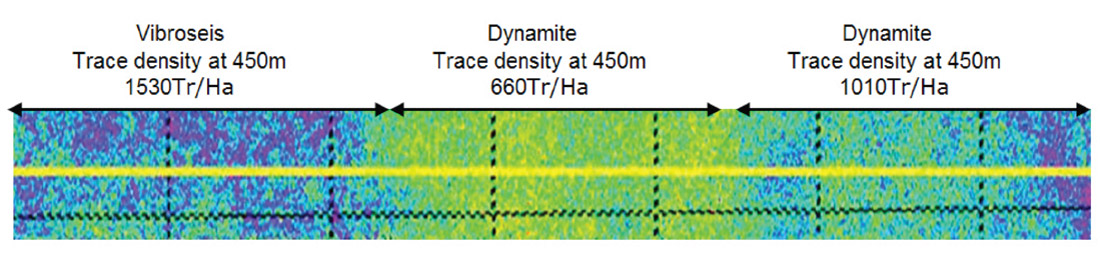
As a general rule data with higher trace density benefits from having higher SNR ratio (Yilmaz, 1987). Through an interpretive lens, noisy data appears discontinuous, with sharp lateral changes and discontinuous, ‘choppy’ events.
Running the data volume through an edge detection algorithm should produce more ‘edges’ in the presence of data with a lower SNR.
In Figures 6a, the Vibroseis acquisition proves itself to have a higher SNR ratio than the legacy dynamite surveys, and in 6b the noisier data are brighter (green in this case).
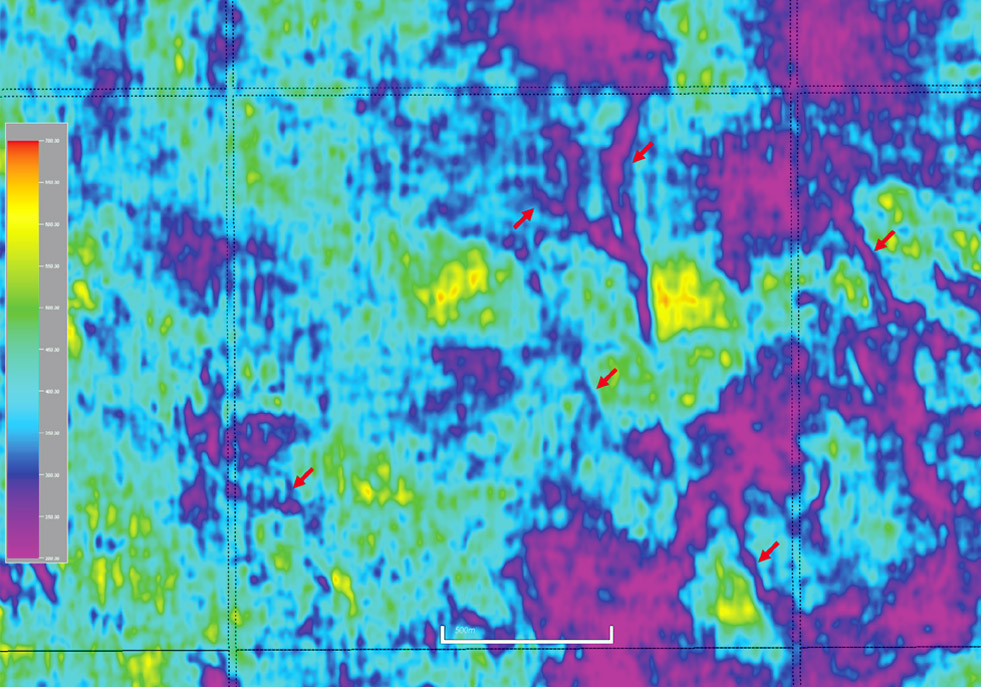
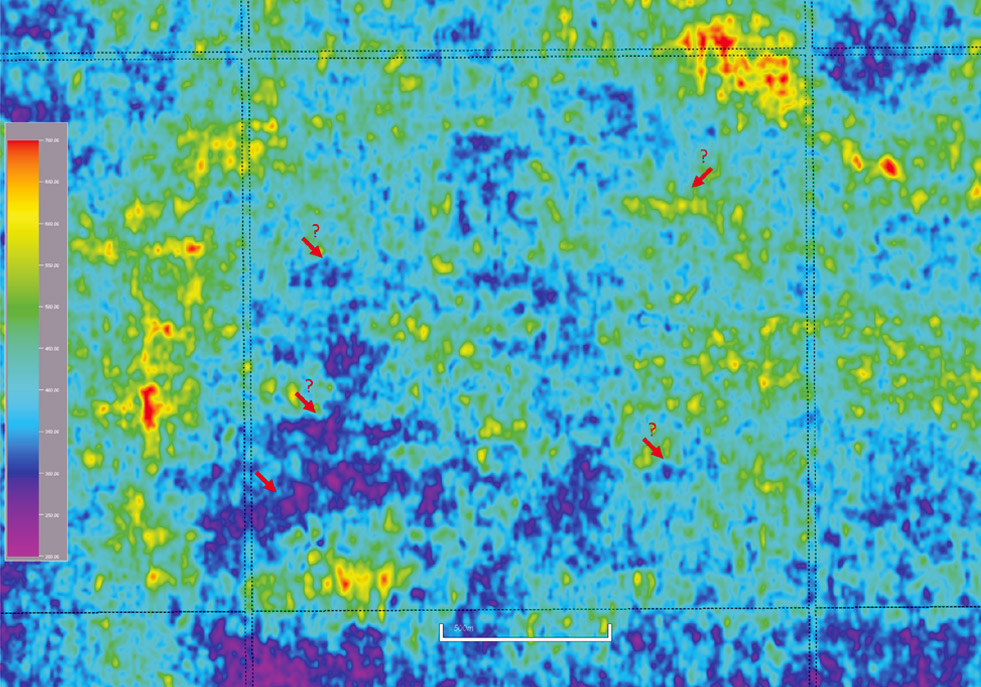
Another validation of the changes in acquisition parameters is the ability to resolve more complex geology. By complex, we are referring to thinner, narrower, or lower contrast geological units. While Figures 7a and 7b are taken from different areas of the 3D, it can be seen clearly that the Vibroseis data more sharply resolves geological features than does the dynamite data.
Slip sweep acquisition and test design 2016
With continuous improvement in mind, the focus turned to investigating the applicability of a slip sweep methodology. This method essentially consists of a vibrator sweeping without waiting for the previous sweep to terminate (Bagaini 2006). This directly targets the reduction in the cycle time of Vibroseis acquisition (Rozemond, 1996), by simultaneously acquiring multiple shots separated by both distance and time (or frequency).The lure of slip sweep was foremost in focus now, as it might offer operational efficiencies and cost savings (Bouska, 2009).
- Could the bandwidth be pushed above 200Hz and could slip sweep be used here where the maximum usable offsets are well below 1000m and the spectrum now running 6Hz to ~220Hz?
- Would the second and third harmonics be an issue, or would successive shots contaminate the data?
Aware of these considerations, a third test was designed and implemented in Q1 2016.This test (Figures 8a and 8b) now focused on possible improvements on the accepted production sweep to push the high end, as well as to confirm that with sufficient time and distance separation of the Vibrators we could acquire data of equal quality to the Ping-Pong data with the same sweep. By Ping-Pong we mean one vibrator does not start shaking until the previous shot has been fully acquired (sweep length plus listen time).
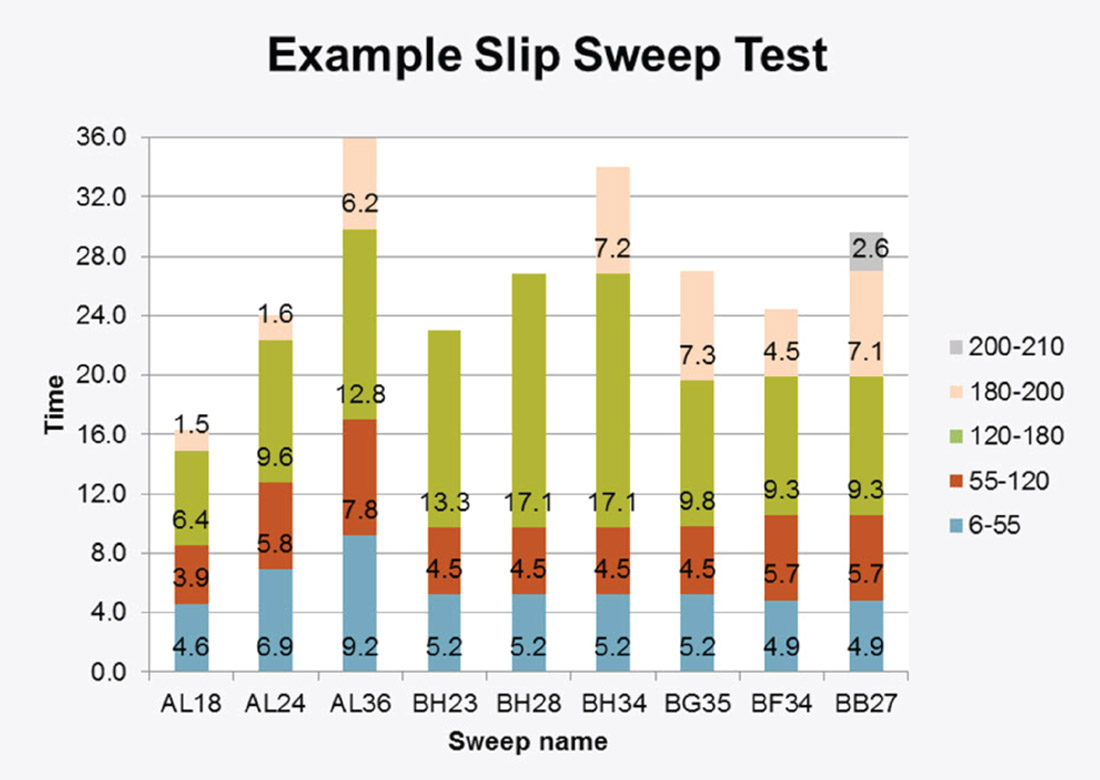
Significant elements of this test included lengthening our accepted sweep from 18s to 24s and 36s. Sweeps similar to BH23 through BH34 (Figures 8a and 8b) allowed us to understand how time spent in the 180Hz to 200Hz influenced the signal in the band 120Hz to 180Hz.
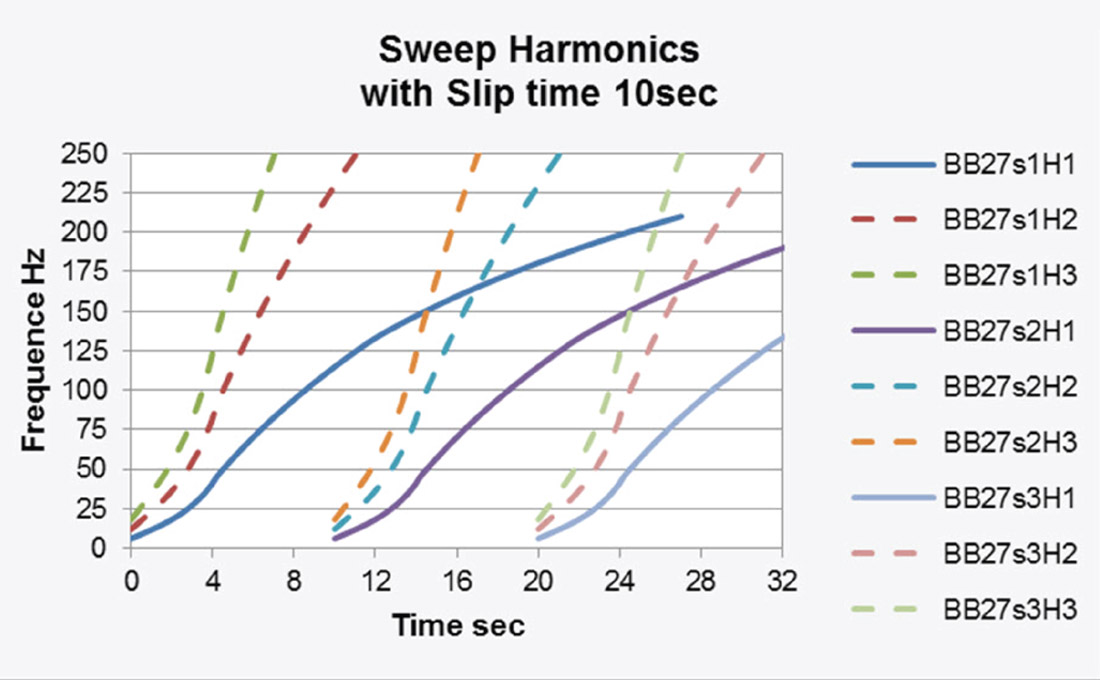
Some of these sweeps were “slipped” with differing time (8s to 16s) so that the second harmonic crossed the first harmonic of the previous shot at defined frequencies (Figure 9). Distance separation (150m to 600m) was also tested, allowing us to determine acceptable slip parameters for use in this area. The results of these tests were so compelling that the parameters on a 17km2 production 3D were modified to include an improved sweep, using slip sweep, and doubling the trace density yet again.
Acquisition QC considerations
While the sweep can be tailored for the area, it can also be optimized for slip operations and the slip parameters need to be in harmony with the crew’s movement capability. Time and distance separation of vibe fleets must be factored into the project execution plan, and clearly more conservative slip parameters work against field efficiencies.
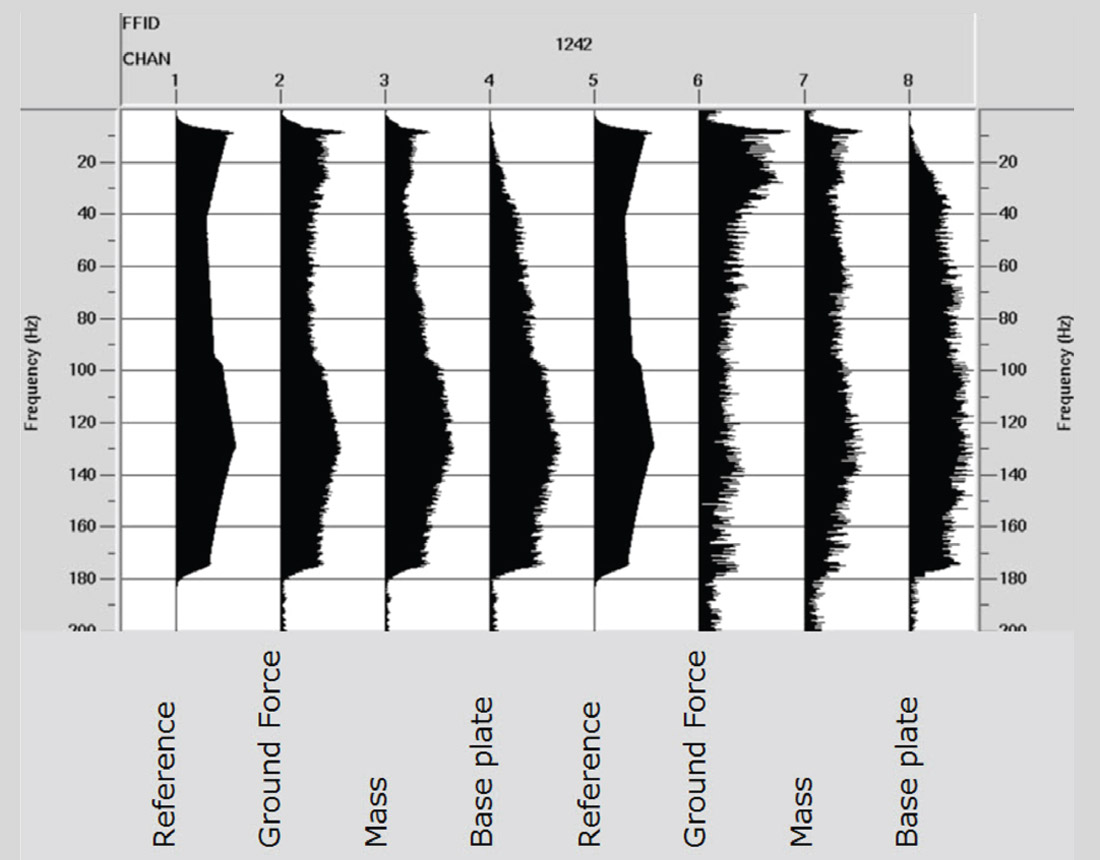
Our 2016 program was acquired using IVI Mini-Vibes, and Multi-Component Seismic Nail geophones. Using slip-sweep allowed a further doubling of the trace density by decreasing the shot interval from 20m to 10m. With this “on the fly” program modification, for precision we utilized TigerNav Stakeless positioning for the in-fill shot locations. Vibrator QC was increased for the slip sweep operations as this had not been done before in this area. We consider phase to be the best metric for ensuring replication of the pilot against the vibe signature data. With a targeted phase threshold error no greater than 5 degrees, we acquired an additional 14% shots by re-occupying all points that did not meet phase errors specifications. For example, Figure 10 shows that Vib#2 is performing poorly, as at this superficial level the ground force should mimic the reference sweep. Hence Vib#2 should be taken out of the fleet for maintenance. With the slip sweep operation we had time available to maintain a high standard and re-occupy, sending all data to processing where the poor shots are more easily identified and could be deleted from the flow.
Being cable less, field QC was based on receiver gathers which were harvested daily at defined locations so that data quality could be continuously evaluated in-field, and a number of SEGD’s were sent to the office for detailed analysis.
Future work
While we have been able to increase the trace density at target by a factor of five or more while decreasing the costs, there are still a number of elements we are investigating to further optimize our 3D programs. To date our source verses receiver balance stems from the dynamite acquisition legacy, but now greater source effort could allow us to possibly reduce the receiver density. We see that with further optimization of slip time and distance separation we can establish better operational synergy; obtaining a crew size which compliments both source effort and receiver movement.
Typically survey effort makes up approximately (10%) of the total cost of these Vibroseis programs; we may be able to reduce the receiver survey effort as described by Châtenay (2016). The feasibility of this can easily be tested in processing, and is currently being reviewed. In a similar vein, while recognizing our responsibilities for regulatory compliance, the possibilities of increasing the use of stake-less positioning systems is being reviewed to further optimize the acquisition process.
The listen time offers another area for consideration, with target depths in mind and all usable PS data being recorded well before the end of this long up-sweep the listen time can be cut back to our processing time (1.5s in this case). The receiver system itself should be reviewed if converted wave data is not being acquired the choice of traditional 6 phone grouped array or single element phones will impact the final cost of acquisition.
The weighted sum of the output of the reaction mass and baseplate accelerometers is considered as representative of the emitted down-going signal, Boucard (2009). While the pilot sweep is well defined, it is true to say that output of the reaction mass and baseplate accelerometers varies somewhat through a survey. As these exploration 3D’s will be the future baseline for 4D monitor surveys repeatability is another issue that needs to be fully understood. While repeatability has been assessed on the 2D test lines, we plan to re-assess the repeatability of the 2016 slip-sweep survey through decimation and reprocessing. In this same vein we see the need for better in-field evaluation process for verifying Vibrator phase errors. The next step in the evolution of in-field quality assurance would involve a more rigorous real-time QC of all Vibroseis data. This will include engagement with our vendors and instrument manufacturers to optimize hardware or software solutions.
Conclusions
In our area, the response of the PP data proved Vibroseis to be a viable alternative to dynamite. This allowed us to better image the subsurface while achieving an optimal balance of cost, regulatory, health-safety and environmental requirements. Figure 11, shows cost comparisons with various geometry options, based on parameters and 2015 costs, and so is independent of inflation or market fluctuations.
While our 2D test lines showed the PS data at the reservoir level while adequate was poorer than data acquired with dynamite, Figure 5b indicates that the dynamite section is stronger in the low end of the spectrum on the PP data. However, we anticipate that the higher trace density data now being acquired with Vibroseis will provide a strong PS section. At time of publishing, the PS data is pending processing and results will be seen late 2016.
Acquisition geometry and source parameters should be regularly reviewed to find opportunities to improve data quality and or reduce costs. By employing a rigorous, iterative design and testing methodology, we have been able to progress beyond simple linear or high/low dwell sweeps to a stable segmented sweep, which is well behaved and replaces dynamite in this area. Similar tests have been run in some of our other properties, proving that each geographic area required a different custom sweep to best image the reservoir. Testing of slip-sweep parameters has opened the door for significant increases in trace density without additional costs, and has prompted us to revisit many elements of 3D design in search for further optimization.

Acknowledgements
The authors would like to thank Cenovus Energy Inc. and the FCCL Partnership for permission to present the data. The authors also recognize numerous colleagues within Cenovus who have participated in this study, and supported the methodology. A special thanks to Jeremy Gallop who’s early implementation of a segmented sweep provided inspiration for this work. The authors also thank the acquisition and processing vendors for their efforts on the data.


Join the Conversation
Interested in starting, or contributing to a conversation about an article or issue of the RECORDER? Join our CSEG LinkedIn Group.
Share This Article