E&P companies are looking at data differently than they did in the past. The reason why they are doing this is because data drives big economical decisions, including the sanctioning of a new play, which is when the Board decides to spend a large amount of money on the development of an existing play or entry into a new one to expand its portfolio. E&P companies are also moving away from the method of geoscientists and engineers working as individuals on the data, creating their own maps and analysis, towards working together collaboratively and using a geomodel as the repository of the data across the area.
The biggest problem encountered in the past with building geomodels was the work of converting the data into a standard dataset. There are several mnemonics for each type of well curve (e.g. sonic can be called DELT, DTC, DT, etc.) and there just needs to be just one unique mnemonic for each type of well curve. The geological tops also need to be standardized, as well as the seismic horizons. The standards need to be consistent. The goal is to be able to run a geomodel within 2 to 3 weeks to obtain the necessary answers about purchasing a lease, participating in a well, or drilling a well.
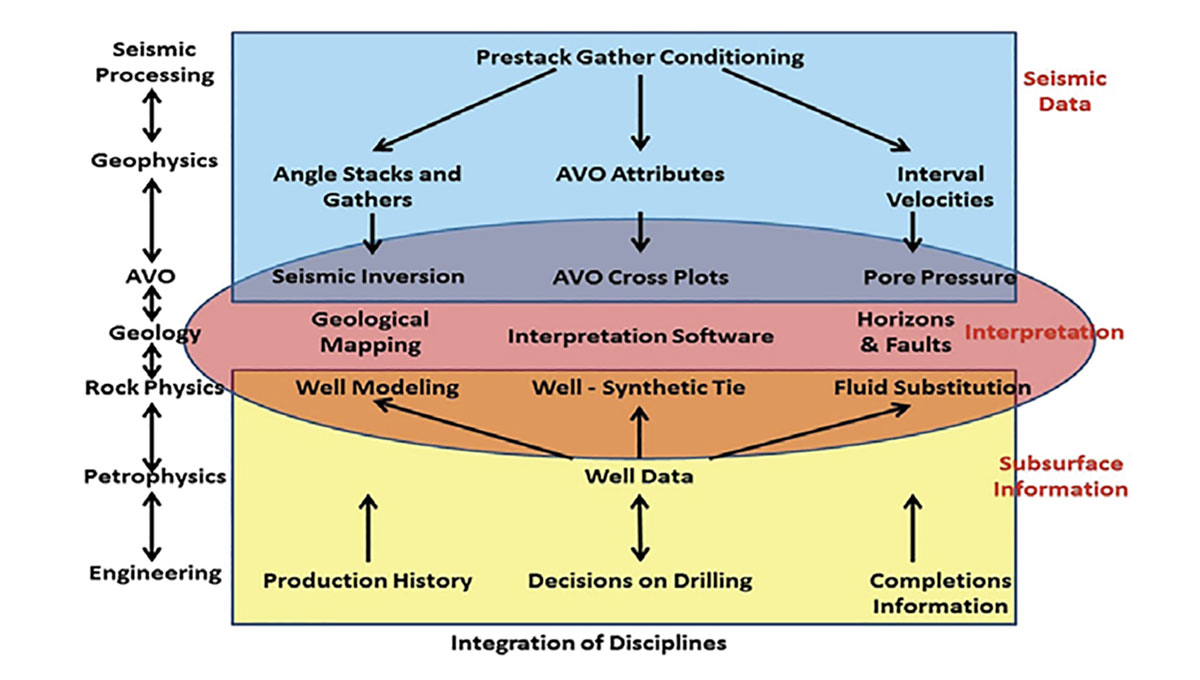
The emphasis is on working as an integrated team, utilizing geoscientists, petrophysicists and engineers, using data from the different disciplines to build a static model which will then be used for the reservoir simulation and the understanding of fluid flows.
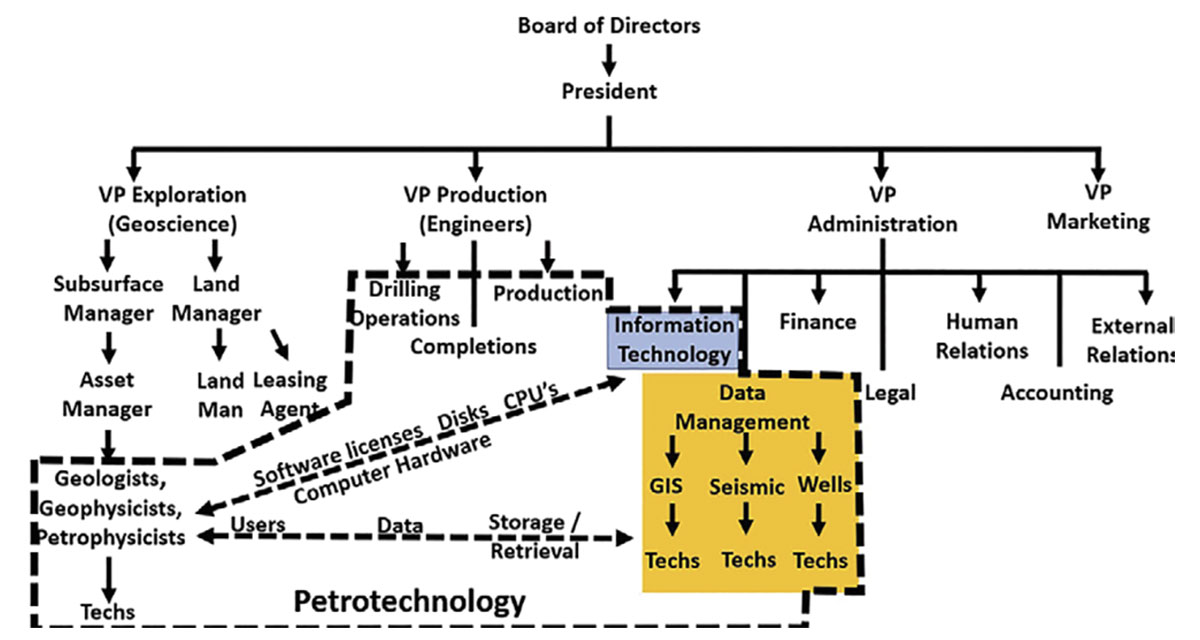
Even data management is becoming an integrated team effort, being referred to as a “petrotech”. The Petrotech team looks at standards, how the data should be loaded, and loads all the data using the standards. They not only understand the data, but need to understand how the software (database) handles the data to optimize the use of it by the users. To accomplish this, there need to be elements of data management, information technology (IT), geology, geophysics, petrophysics, and engineering on the petrotech team.
Introduction
An E&P company is not just made up of geoscience and engineering. There are a lot of different people with a variety of backgrounds that make up an E&P company. Each supports the other but they tend to work in silos. A major change in today’s market is an integrated team where the work is done across silos utilizing different disciplines to solve problems. The goal of such teams is to rely upon each others’ expertise to make the company more successful.
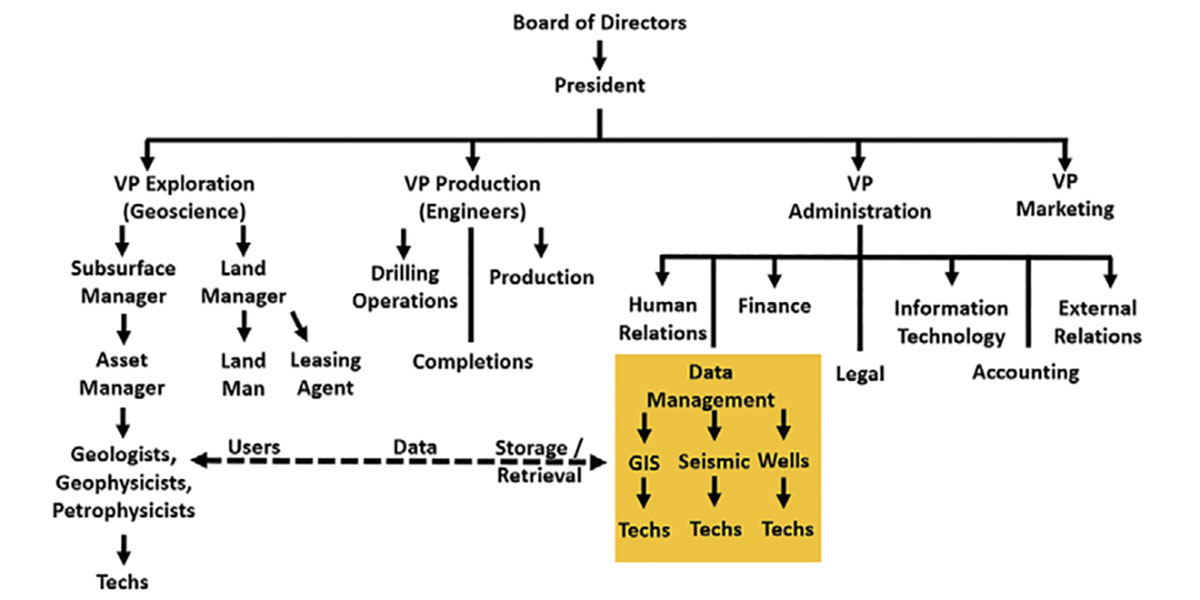
Data Management
In today’s world, data management is becoming crucial to the E&P companies. Data is fast becoming the new oil. The issue with data is not just the data itself but all the meta-data that is attached, establishing ownership and how the data can be used. A lot of the data that an E&P company has, such as seismic, well data and GIS data, tends to be licensed from a third party. With seismic data, it is referred to as speculative or non-exclusive data. With speculative or non-exclusive seismic data there are rules on how it can be used by the E&P company. The E&P company cannot just give a copy of the seismic data to its partners without the partners having a license to the data.
There is another type of seismic data, and that is exclusive or proprietary seismic data, when data acquisition is operated and paid for by a company or group of companies (partnership). If it is done by a group of companies, then when the data is sold, all the partners must agree to the sale. This can be cumbersome over time since companies can fold, undergo mergers etc. and at times it is hard to follow the various mergers and who has a share in the seismic data.
Some companies are moving away from having data management / information management internally, especially during this most recent downturn, and are turning to contractors that specialize in this with one or two individuals internally working with the outside contractors. Part of the reason why E&P companies are doing this is because they don’t have the expertise and resources to work with the PPDM (Professional Petroleum Data Model) which is the data model that is used to store the data and all the attributes around the data. Many of the people involved with the outside contracting firm are more experienced with the data than the people in the E&P company. These outside contractors have even developed software around the storage of data.
Some of these data management / information management companies have entered the seismic brokerage business licensing exclusive data for the E&P companies to generate a side income, since they are already storing the data. Many on the Board of Directors see the business of E&P companies as being that of drilling wells and increasing production and not of being a brokerage firm. The income generated by the licensing of exclusive data or even selling it can be used to purchase newer and better seismic, and there are some tax incentives to do it this way.
Asset Teams
In the Exploration and Development division there is the “asset team” composed of geoscientists working a certain area (i.e. Edson) or formation (i.e. Montney team) and the Land Department (Land) which works with the asset team on lease sales; being put on notice of the drilling of a well by a competitor and being asked to participate; working with other companies in the area; etc. These two groups tend to work in unison.
The asset team develops a play type and possible prospects using concepts of reservoir management. The goal in most companies is to utilize well tops, geological mapping, petrophysics, geophysics, seismic inversion, and rock properties to identify sweet spots to be drilled. Some larger companies are moving towards integrating the geoscience and engineering to create a static model utilizing software such as Schlumberger’s Petrel, and Paradigm’s SKUA and GOCAD, in order to understand the subsurface better.
In the past, each geologist and geophysicist on an asset team worked independently creating the tops they wanted to pick, the seismic horizons, the surfaces they wished to generate etc. With the advancement of static modeling software, asset teams now work as integrated teams and are starting to see the importance of data standards and work flows.
So much weight is put onto the data because it drives major decisions. People do not realize that big economical decisions are made based off this data, including sanctioning of a new play, which is when the Board of Directors decides to create a budget to buy data and land. Incorporating standards allows all groups to use the same data and come to the same conclusions, even groups outside of the asset team, such as an internal technical assurance team which will audit the decisions made by the asset team. It is vital that the data can be trusted by all and that the data is consistent and uniform across the organization.
How Hydrocarbons are Explored For
Exploration is important because an E&P company must at a minimum replace all the hydrocarbons that they produce to keep their production flat. The value of an E&P company is dependent upon its production which is it reserves in barrel oil equivalence. To grow the E&P company must not only replace the hydrocarbons it produces but must increase it as well. How E&P companies do this is by increasing their land position.
How E&P choose the land is through the science and technology by mapping the data available and integrating the surface to the subsurface. If mapping is done on a new formation before any other E&P companies think of doing it, then the E&P company is able to better pick which leases to go after before anyone else and the leases can be acquired with minimum cost.
Most of the time in true exploration there are few wells and 2D seismic tends to be utilized.
2D Seismic
Most companies undervalue 2D seismic, but it can be used for AVO, seismic inversion, etc.
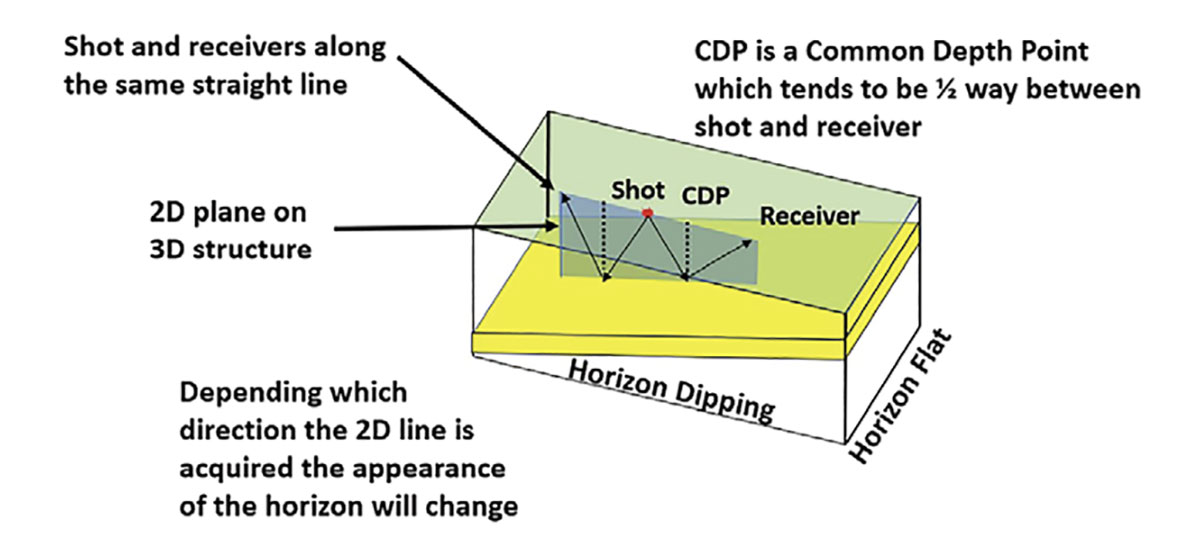
2D seismic is shot in a grid using strike and dip lines. It is important that both the strike and dip lines are examined. With strike 2D seismic lines, the structure will appear to be flat.
The shooting of 2D seismic is relatively easy, and 2D data is utilized for reconnaissance for:
- lease sales, to make a quick decision on a lease;
- potential exploration areas and plays;
- deciding to participate in a well;
- planning of acquiring more seismic data.
The main difference between 2D and 3D seismic is in the imaging. With 3D data, the geological structures are better imaged because the 3D is a tight grid of seismic composed of inlines and crosslines, thus it allows for diffractions in all directions to be properly collapsed and the geological structures placed where they should be in the earth. With 2D, the diffractions are collapsed only in the plane that the data is acquired in, and there are out-of-plane effects which affect the imaging of the data.
Once the geophysicist has a good understanding of the structure and stratigraphy, a 3D seismic survey is generally planned using the 2D seismic.
How Seismic is Used
There are four ways that seismic data can be used in hydrocarbon exploration:
- observation of direct hydrocarbon indicators (DHI’s) – seismic detection of the presence of hydrocarbons;
- identification of hydrocarbon traps in the geological structure;
- understanding of the regional structure that will aid in constraining the geological history and identifying potential hydrocarbon sources;
- identification of lithology and fluids within the rock.
Once the seismic is interpreted and sweet spots are identified then a fairway map can be created. Geological input is also added and a geomodel may be created which uses geostatistics for the interpolation of data across the area. It has been shown that using seismic data co-kriged with the sparse well data will improve the interpolation.
Predictive Analysis to Find Sweet Spots
One of the earliest methodologies to do Predictive Analysis is Amplitude Variation with Offset (AVO). AVO is not a Direct Hydrocarbon Indicator (DHI) but is one of the tools that is utilized in exploratory data analysis (EDA), and AVO anomalies can help to focus attention upon locations for further consideration.
AVO analysis is on zero phased rotated seismic data where the peaks and troughs represent the reflective interface between two different formations. It can be done on seismic gathers (prestack data) or partial stacks / angle stacks (AVA).
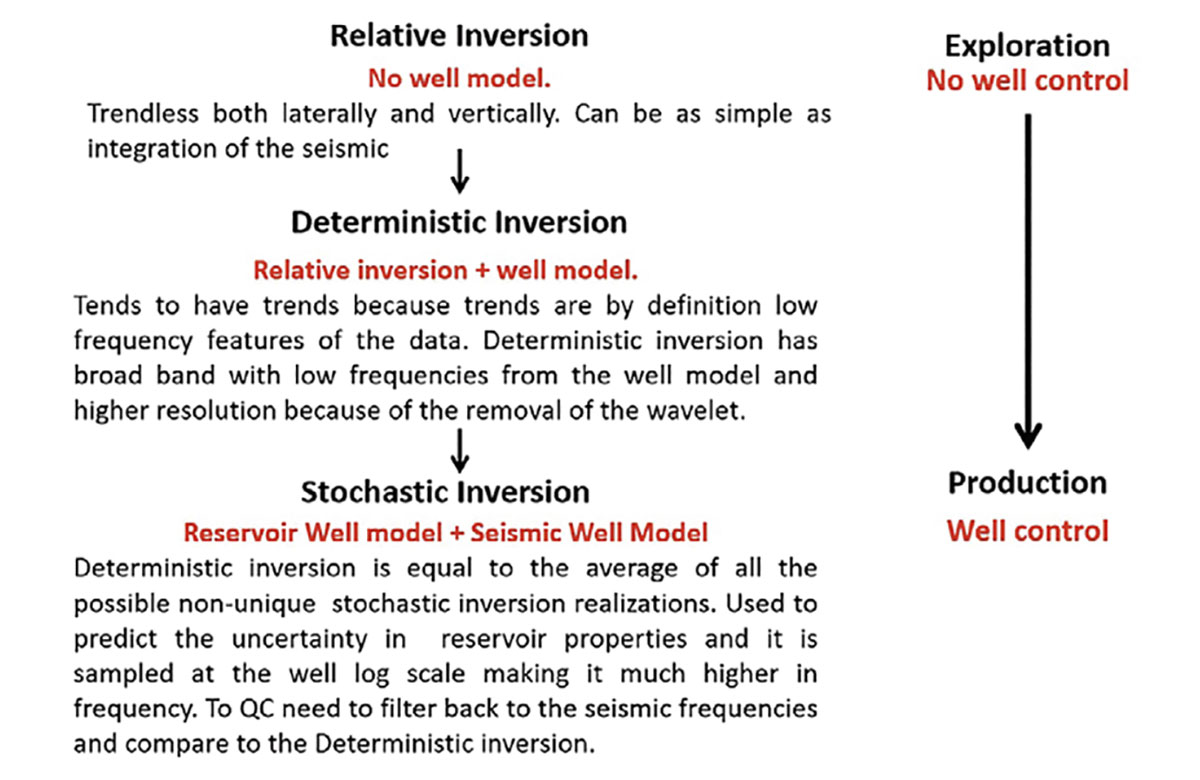
If the zero phase reflective data is inverted, then the peaks and troughs do not represent reflective rock interfaces but are transformed into quantitative rock properties for the rock layer.
There are three types of inversion:
Well Logs
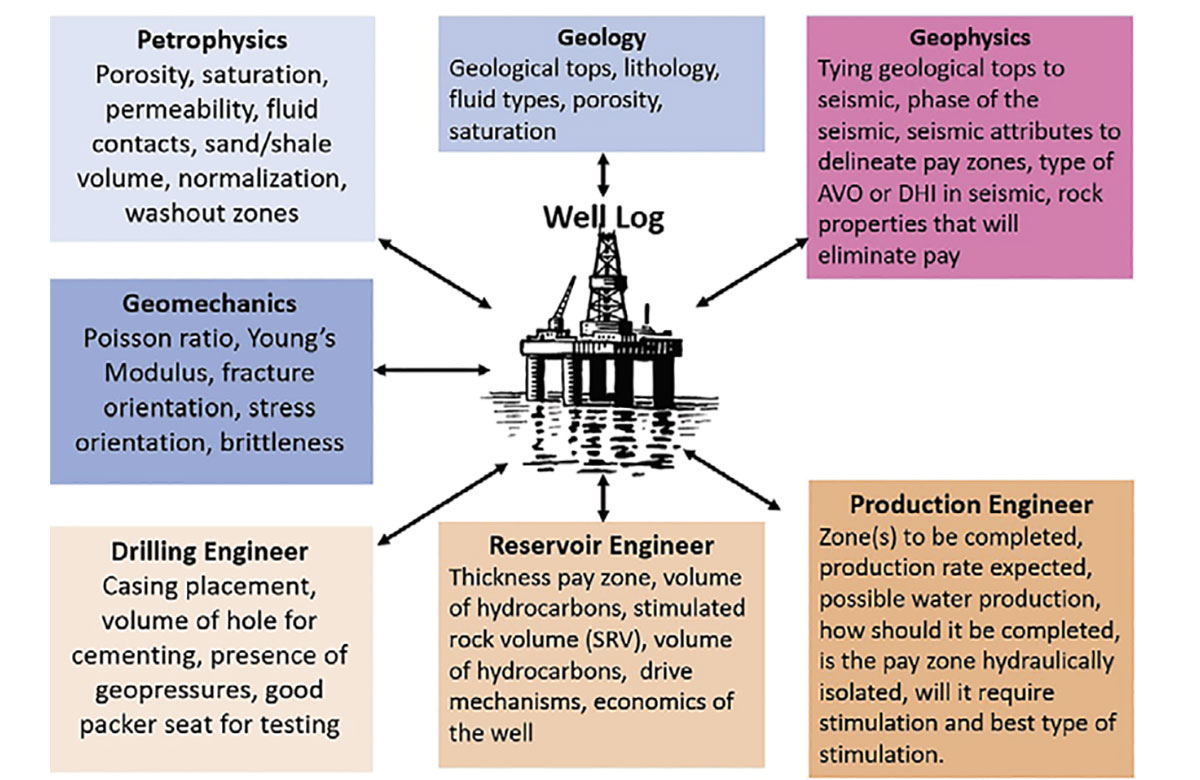
Well logs are the measurement of specific rock properties such as: resistivity, self-potential (SP), gamma ray, neutron and density, with depth. Well logs can be used to identify lithology, differentiate between porous and non-porous zones, fluids in the rock, etc. Each formation has distinctive characteristics that appear similar from one well to the next. This is how formations are identified in the subsurface, and allows the picking of geological tops.
To interpret the data the well logs are displayed in what are called tracks. Generally, one type of well log is displayed in each track, but multiple well logs can be displayed in a single track. A common example of this is the display of the neutron and density log in the same track. By putting both logs in the same track, the spot where the two logs cross over each other can be identified, and this tends to be where there is gas. The curves in a track can be any color and displayed as solid or broken lines, for ease of differentiation.
When calculating the total depth (or TD) to be drilled, it is important to measure the properties across the reservoir zone, and to account for the length of the sonde / well tool needed in order to take these measurements. This may mean that an extra 20 m should be drilled beyond the zone of interest.
| Lithology Logs | Porosity Logs | Fluid logs |
|---|---|---|
| Table 1. Showing the different types of well logs. | ||
| Spontaneous Potential | Neutron | Resistivity |
| Gamma Ray | Density | Induction |
| Sonic | ||
Each discipline utilizes the well logs to answer crucial questions. Measurements taken from well logs help to establish the link between the rocks or the geology and other measurements, such as seismic inversion attributes like acoustic impedance, Vp/Vs, Vp, Vs, density, etc., which are used to infer rock properties.
Type Curves
To understand the production volume, engineers will look at “type curves” which summarize the average well performance decline profile, to permit effective forecasting and reserve estimation for evaluations.
Type curves are a powerful method for analyzing pressure drawdown (flow) and buildup tests. Type curves are pre-plotted solutions to the flow equations for selected types of formations and selected initial and boundary conditions. They are the best representation of well performance and EUR expectations for multi-stage frac unconventional plays.
Type curves are better than volumetrics because to calculate volumetrics, net pay, varying porosity/permeability, water saturation and area need to be defined. This is hard for unconventional resources but can be done for conventional resources.

A – is the area in acres.
h – is the height or thickness of the reservoir.
ø – is the porosity of the rock.
Soil = Sw-1.
N – is the amount of oil within the reservoir in barrels of oil.
BOil – Formation Volume Factor (Boil). The Formation Volume Factor can be best explained as, under reservoir conditions, the oil is under high temperatures and pressures. When it is brought to the surface, the pressure and temperature will decrease and the gas may come out of solution, causing the oil to shrink in volume.
Fairway Map
Fairways are the most favorable areas of hydrocarbon accumulation, with minimal geologic risks. This helps to determine the most valuable lease blocks or packages of land that need to be purchased to enter a play.
Generally, a fairway map is made using a stop light approach, with green being the best lands, yellow being marginal and red where there are no commercial hydrocarbon accumulations.
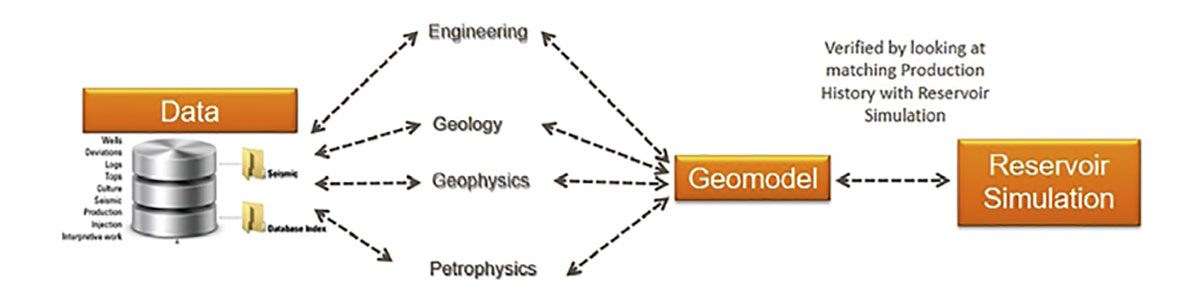
It is hard to integrate all the data into a fairway map, so a 3D geomodel tends to be built using geophysical, geological, petrophysical, geomechanical, completions, production history, etc. The geomodel allows us to integrate all the data from different disciplines so that a more comprehensive understanding of the reservoir/play is understood.
The geomodel was born out of the advent of 4D seismic, which allowed seismic to be used to understand fluid flow. With that, there was the push from the Boards of Directors to integrate the disciplines together to gain a better understanding of the reservoir. Each discipline utilizes the data differently and 4D allowed the first concentrated effort to use the data to achieve the same goals for all the disciplines.
A geomodel is a multidisciplinary, interoperable and updatable database about the subsurface. It is the numerical equivalent of a three-dimensional geological map complemented by a description of physical quantities in the domain of interest. An important part of geologic modelling is related to geostatistics which deals with probabilities and not absolute answers. It is important to realize that a lot of what is done deals with probabilities. Geostatistics is used to better populate the rock properties in the model.
To build static models, a new position called “geomodellers” has been created. Geomodellers work with software such as Paradigm’s SKUA and GOCADand Schlumberger’s Petrel. The goal is to create a consistent model which represents the geology, and it can then be input into the reservoir simulation where it becomes a dynamic model. The goal of the reservoir simulation is to predict the flow of fluids through porous media.
When geomodeling first began, only a few geomodels were created. These geomodels took months to build because the geomodeller spent a lot of time fixing the data and applying standards to the datasets so the data would be consistent. For the Geosciences, standards are a new concept; currently, most geoscientists tend to work as individuals in doing their interpretation and feel standards may be restrictive.
Geomodeling emphasizes an integrated multi-disciplinary team. It brings together data from different sources such as: well data, well tops, completion information, pressure data, seismic data, seismic inversion products, seismic horizons, etc. All this data needs to follow standards.
Petrotech
With the development of geomodels and standards, a new discipline has been created called “petrotechnology” which looks at how technology can be applied to work with the data. A petrotech team is multi-disciplinary, and the members need to be able to look at a problem in a variety of ways. Petrotech is changing how the data is dealt with. Some companies are grouping the technicians, data management / information management, IT and support under the petrotech team, to work together instead of insilos.
The petrotech team works directly with the asset, solving their problems with the data. The goal is to optimize the use of the geomodel.
Not only is the geomodel being used for the subsurface, but the subsurface is being integrated with the surface using GIS layers. As a result, drilling plans are being created to optimize the placement of the well pads to optimize production, maintain government compliancy, and lower the costs of the construction of the pad and its infrastructure.
Conclusion
AVO and seismic inversion illuminate sweet spots, and with those sweet spots, a play fairway map can be built, or a static geomodel that uses well data and AVO or seismic inversion. The well data and seismic can be co-kriged to produce better results when geostatistics are used, to interpolate rock properties across the area.
Understanding the sweet spots and knowing where they are geographically allows better decisions to made around the bidding for leases. If a company enters a play early enough, it can purchase the leases at a lesser price than the competition. After the purchase of the leases, the sweet spots can be drilled as prospects, staying in zone to maximize the return on the horizontal well, which will give better production results.
To understand the potential of a play, type curves summarize the average well performance decline profile; this permits more effective forecasting and reserve estimation for evaluations, as opposed to volumetric calculations. Understanding the economics of the well allows for better prediction of reserves and more accurate reporting to our stockholders. This brings better value to the company.
All of this leads to a more successful company, but it comes back to working as an integrated team utilizing geoscientists, petrophysicists and engineers and utilizing software that allows data from these different disciplines to come together so that a static model can be built which will then be used for the reservoir simulation and the understanding of fluid flows. A better reservoir simulation that matches the production history produces a more accurate booking. This then allows for a better evaluation of the worth of not only a field, but also of the company, and then allows a company to obtain the necessary credit to continue to drill through a reservebased loan (RBL). When evaluating whether a company can obtain an RBL, the financial institution accounts for the expected drilling and completion costs, the monthly operating expenses (Lease Operating Expenses – LOE’s), plugging and abandonment costs, the projected rate of production, and ultimately, the economic recovery of the hydrocarbons (Shaw, 2015).

Related Reading


Join the Conversation
Interested in starting, or contributing to a conversation about an article or issue of the RECORDER? Join our CSEG LinkedIn Group.
Share This Article