“He carefully cleaned out his active volcanoes. He possessed two active volcanoes; and they were very convenient for heating his breakfast in the morning…If they are well cleaned out, volcanoes burn slowly and steadily, without any eruptions. Volcanic eruptions are like fires in a chimney” (The Little Prince, Antoine de Saint Exupery).
Introduction
Volcanic eruptions are not uncommon. The deadliest eruptions since 1500 A.D. have been the Nevado del Ruiz, Colombia (in 1985, 23000 people dead); Mount Pelee, Martinique (in 1902, 30000 people dead); Krakatoa, Indonesia (in 1883, 36000 people dead) and the most famous, Vesuvius, Italy (in 79 AD, burying the cities of Herculaneum and Pompeii with around 3330 people dead; there have been three dozen eruptions since then).
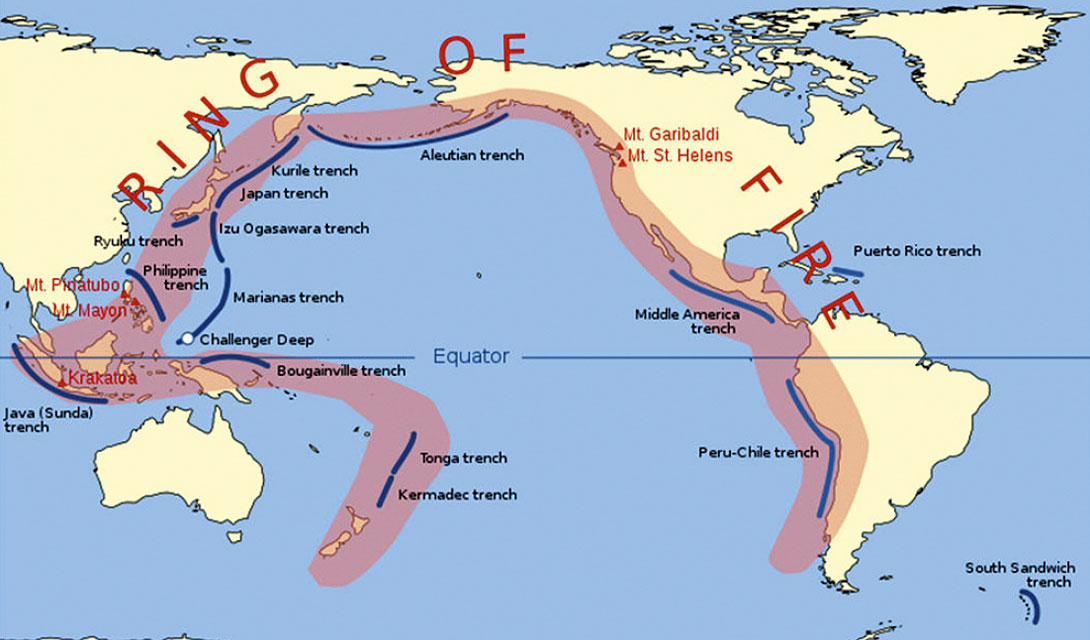
To understand volcanoes, we need to start with the Circum- Pacific Ring of Fire (Figure 1), which is a 40,000 km long area where there are around 450 volcanoes, including 75% of the world’s active volcanoes. Also 90% of the world’s earthquakes occur along this belt.
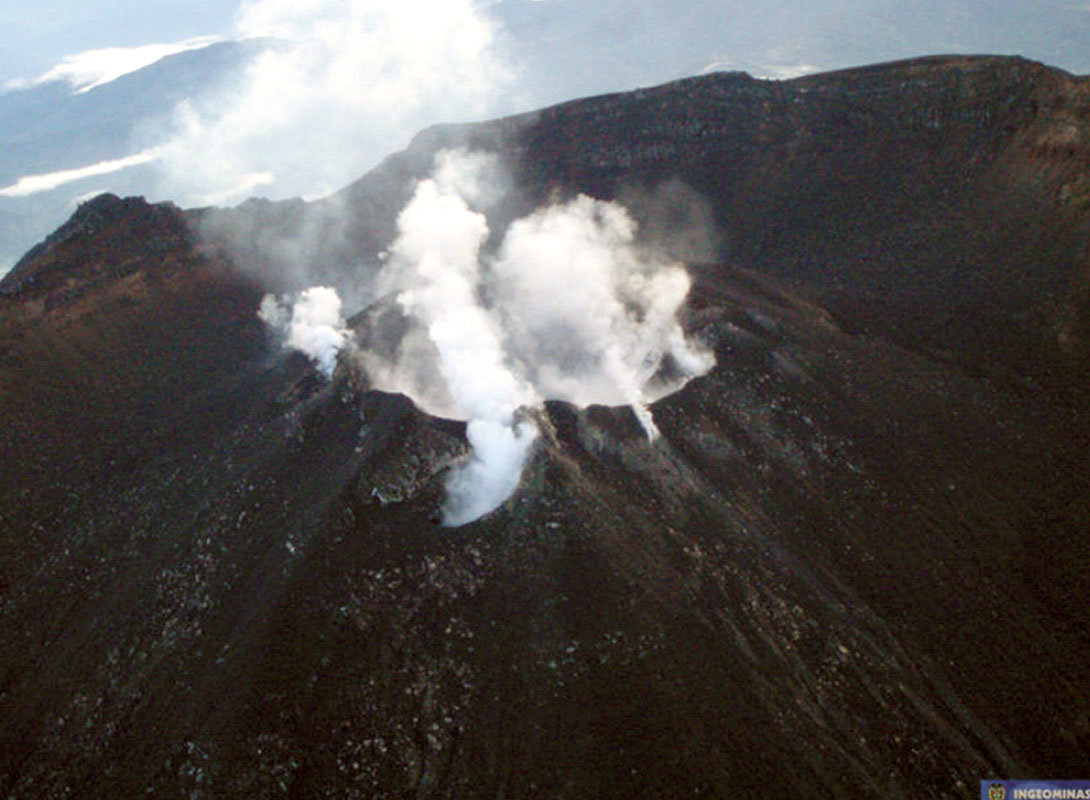
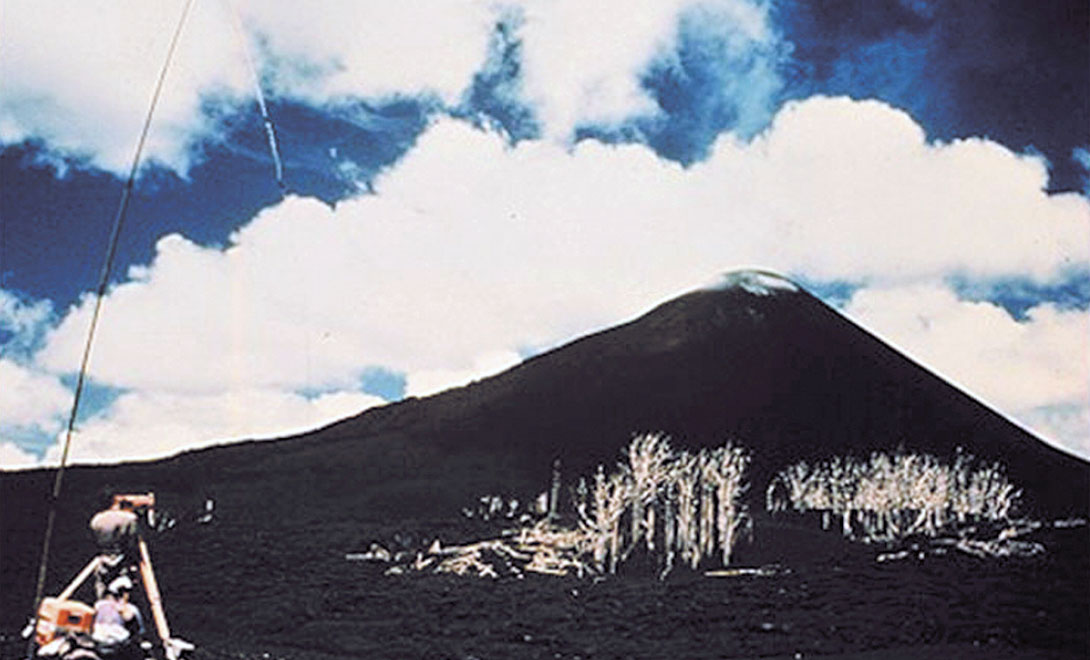
Active volcanoes (Figure 2) or volcanoes that have had eruptions in the past are monitored in Volcanological Observatories. In these observatories, professionals from different backgrounds, including geologists, geophysicists, seismologists and engineers, among others, study and monitor the volcanoes.
In this article, we will discus the most common techniques used to monitor active volcanoes, including seismology, deformation, geochemistry and geology.
1. Seismology
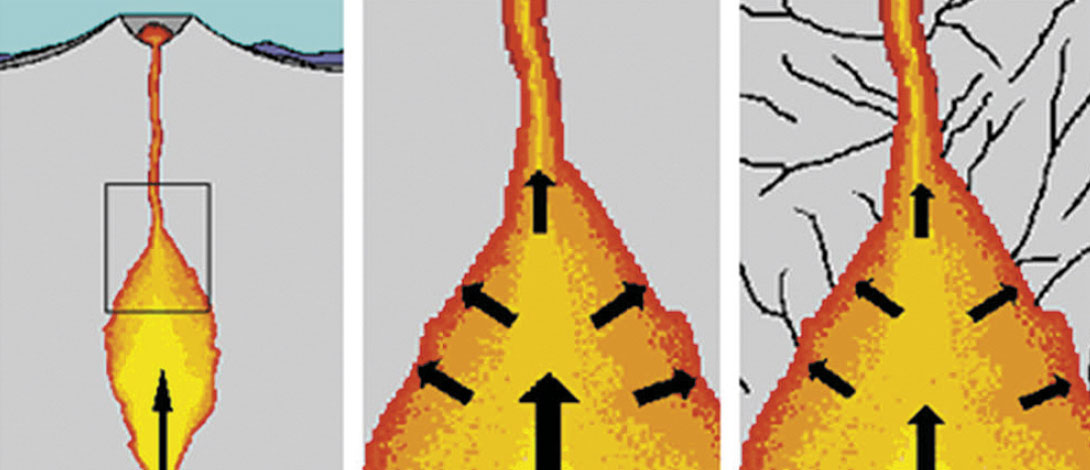
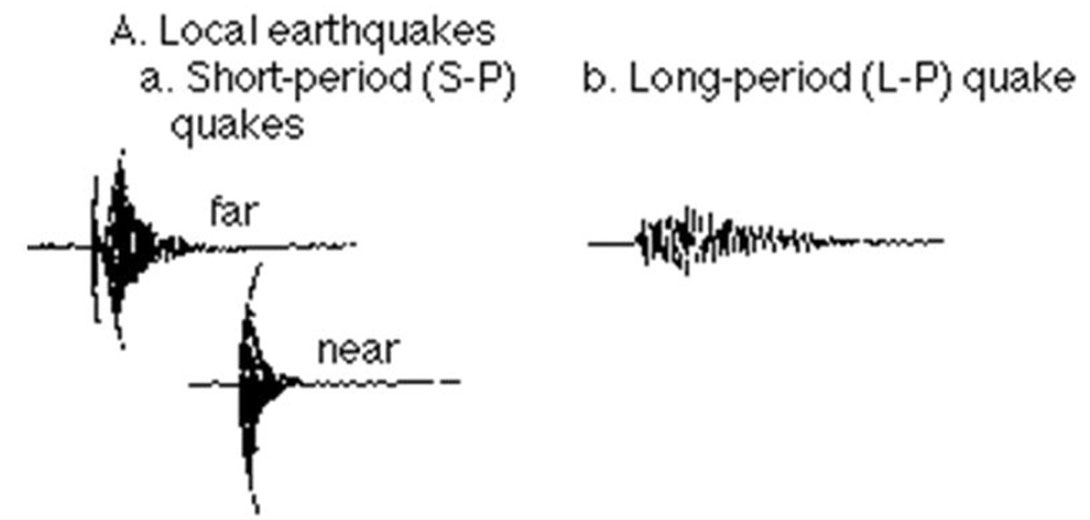
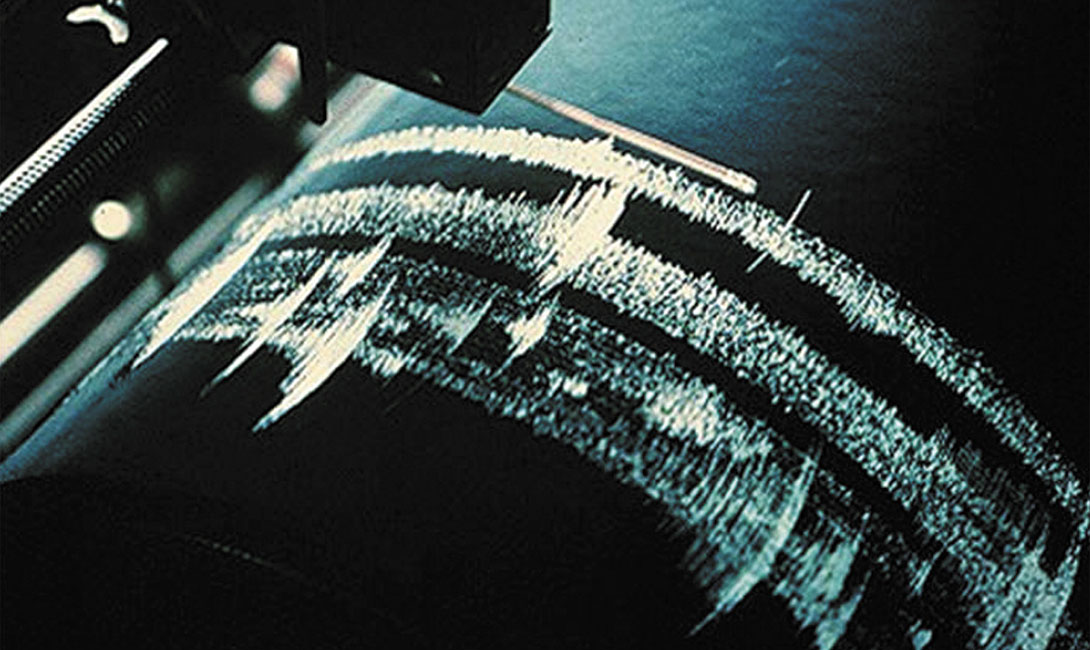
When the magma beneath a volcano is finding its way up to the surface (Figure 3a), it breaks or cracks the rock surrounding it (Figure 3b). When the rock breaks, highfrequency earthquakes are caused. Nevertheless, these earthquakes normally have a magnitude no more than 4 on the Richter scale. But when cracks vibrate because of the ascending magma (Figure 3c), either low-frequency earthquakes or continuous movements (called volcanic tremors) are triggered (Figure 4).
The use of seismology to monitor an active volcano consists of installing either portable seismographs located on the flanks of the volcano, or radio telemetric stations which send signals to the observatory.
These seismographs detect the micro-earthquakes originating inside the volcano and they normally are attached to vertical geophones with frequencies between 1.0 – 2.0 Hz. The changes in levels of seismicity might indicate an approaching eruption.
There are different ways to approach this:
- Telemetric signal: Radio telemetric signals are sent directly to the observatory where they are recorded in real time (Figure 5). A direct visual from the volcano to the Volcanological Observatory should exist. In remote areas, those seismographs have car batteries which are connected to solar panels.
- Portable seismograph: those are deployed in areas where there is not a direct visual with the Volcanological Observatory. These should be visited every 24 or 48 hours to get the seismograms, but of course there is an associated risk if the volcano is very active.
- Satellite seismographs: In areas with abrupt topography, seismographs with a satellite link are deployed. The only problem is that they are considerably more expensive and require personnel with more expertise.
2. Deformation
When magma forces the ground up, the flanks of the volcano “tilt” away from the center of uplift by only a fraction of degree. On the contrary, if the ground subsides as a consequence of magma moving below, the slope of adjacent areas will tilt toward the center of subsidence.
There are several techniques that are used to measure these small changes. Those are done with high precision instruments. The most relevant are:
- Tilt-levelling (dry tilt) measurements: This consists of three bench marks established in an array approximating an equilateral triangle with 40 m long sides, and a total elevation difference across the station of less than 3 m.
- Short levelling lines: Levelling of short lines (200-400 m) by precision level, micrometer plate and invar rods.
- Electronic tiltmeters: These can be compared with a carpenter’s level, which uses a small container filled with a conducting fluid and a “bubble” to measure a change in slope (Figure 6). Electrodes placed in the fluid and into the bubble determine the bubble’s position (as the bubble moves), and voltage output from the electrode changes in a way that correlates to the amount of tilt that caused the bubble to move.
These tiltmeters measure the amount of tilt in microradians, which is the angle turned by raising one end of a beam one kilometer long the width of a dime (equivalent to 0.00006 degrees!) A variety of electronic tiltmeters are now available for volcano monitoring, each with different resolutions and ranges.The continuous signal recorded by an electronic tiltmeter is recorded in “real time”, which means its signal is sent telemetrically to the Observatory. - Electronic Distance Meters (EDM): EDM is an instrument that both sends and receives an electromagnetic signal. This instrument measures distance by emitting a modulated infrared light beam in the visible bandwidth (Figure 7). Depending on the distance between the EDM and the passive prism reflector (installed on the flank of the volcano), the wavelength of the returned signal will be out of phase with the transmitted signal. The instrument compares the phase of both the transmitted and received signals and measures the phase difference electronically. There is a broad spectrum of EDM capabilities in terms of range and precision, but for volcano monitoring purposes, short-range (less than 10 km) to medium-range (less than 50 km) EDM’s are typically used. Short-range EDM’s transmit and receive the near visible infrared part of the electromagnetic spectrum for measuring distances with an accuracy of about 5 mm.
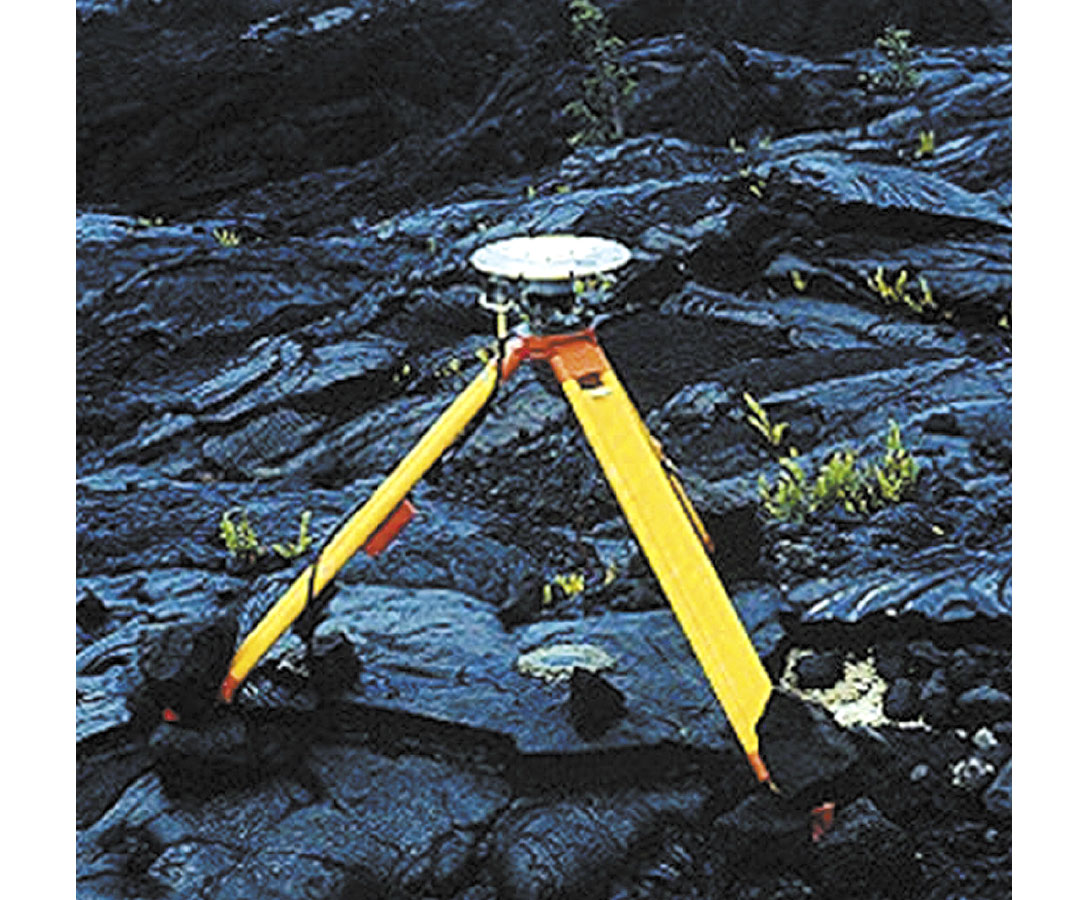
Measuring the distance between benchmarks placed on a volcano tens to thousands of meters apart can sometimes pinpoint where and when magma is rising toward the surface. Rising magma will sometimes push overlying rocks upward or shove them aside. In either case, one part of the volcano may actually move horizontally relative to another part from as little as a few millimeters to as much as several tens of meters. The challenge in measuring such changes with an electronic distance meter is putting benchmarks in the right places and making frequent measurements between pairs of benchmarks. - Global Positioning System (GPS): The Global Positioning System consists of a constellation of between 24 and 32 satellites. Each satellite orbits Earth twice a day at an altitude of about 20,000 km and continuously transmits information on specific radio frequencies to ground-based receivers. GPS receivers (Figure 8) can determine a receiver’s position on the Earth‘s surface to within a few tens of meters. With a little bit more sophisticated receivers and data-analysis techniques, it is possible to determine receiver positions to within less than a centimeter.
GPS satellites continuously transmit an estimate of the satellite’s position, a digital code, and the precise time of the signal. On the other hand, GPS receivers measure distance using the travel time of the radio signals. Distance is calculated by multiplying the time it takes the radio signals to reach the receiver times the speed at which the signals travel - approximately 300,000 km/sec (the speed of light). Knowing where the satellites are located when they transmit their signals, the receiver can calculate its position on Earth. The key is that receivers must simultaneously receive the signals from at least 4 satellites, in part because the clocks in the receivers aren‘t as accurate as the atomic clocks in the satellites. If the clocks in a receiver and satellite were out of sync by 1/1000th of a second, the distance measurement could be off by 100 km! The fourth measurement essentially enables the receiver to correct its internal clock.
All these changes to the surface of a volcano (volcano deformation) can provide important clues about what is happening deep below the surface. Some techniques are more accurate than others, but the integration and comparison of all data help the scientists to better understand the volcano.
3. Geochemistry
Dissolved gases in the volcanic magma can be the driving force of volcanic eruptions. So, it is possible to detect ascending magma by studying the gas escaping from vents, active emission points, porous ground surfaces and from the main fumarole.The gases escape as magma rises toward the surface, when it erupts, and even as it cools and crystallizes below ground.
A primary objective in gas monitoring is to determine changes in the release of certain gases from a volcano, mainly sulfur dioxide (SO2) and carbon dioxide (CO2).
The basic methods for the study of gases for volcanic monitoring include:
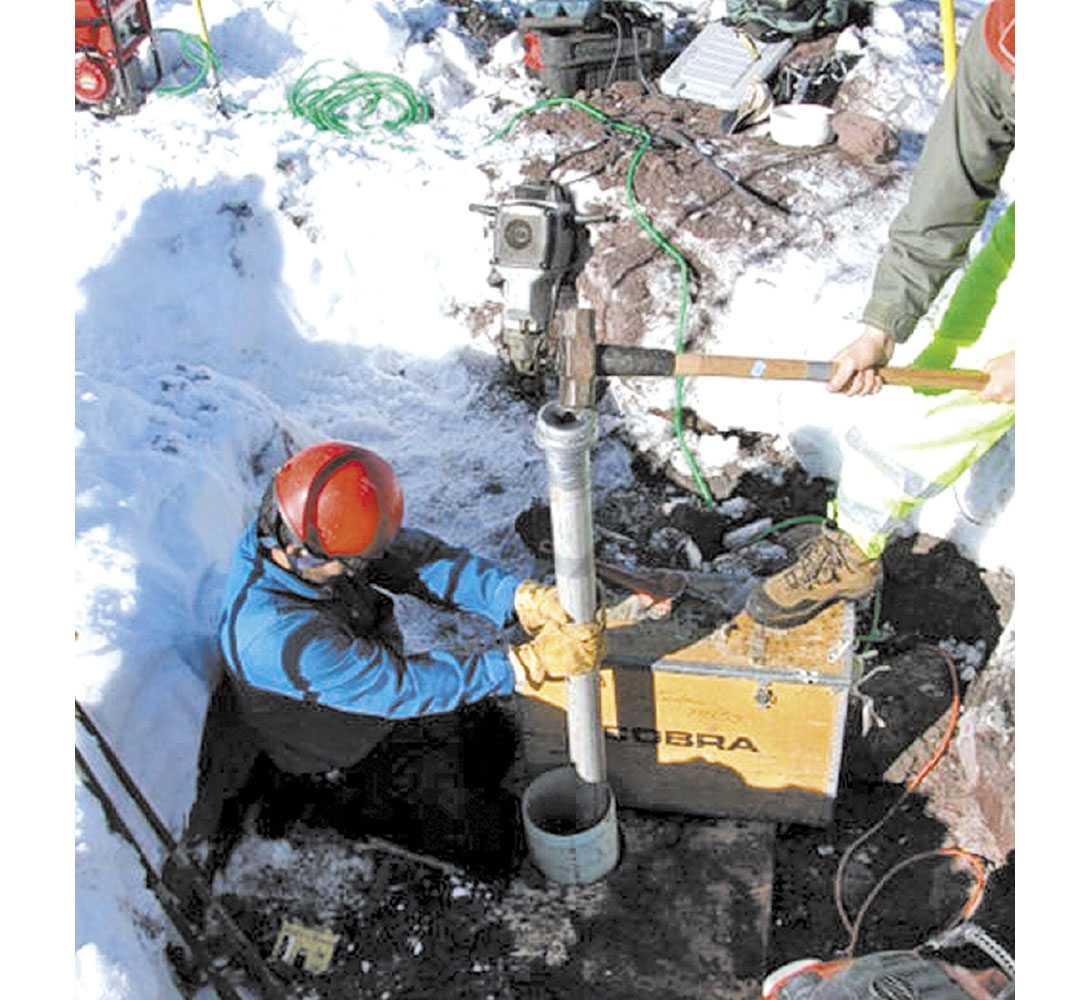
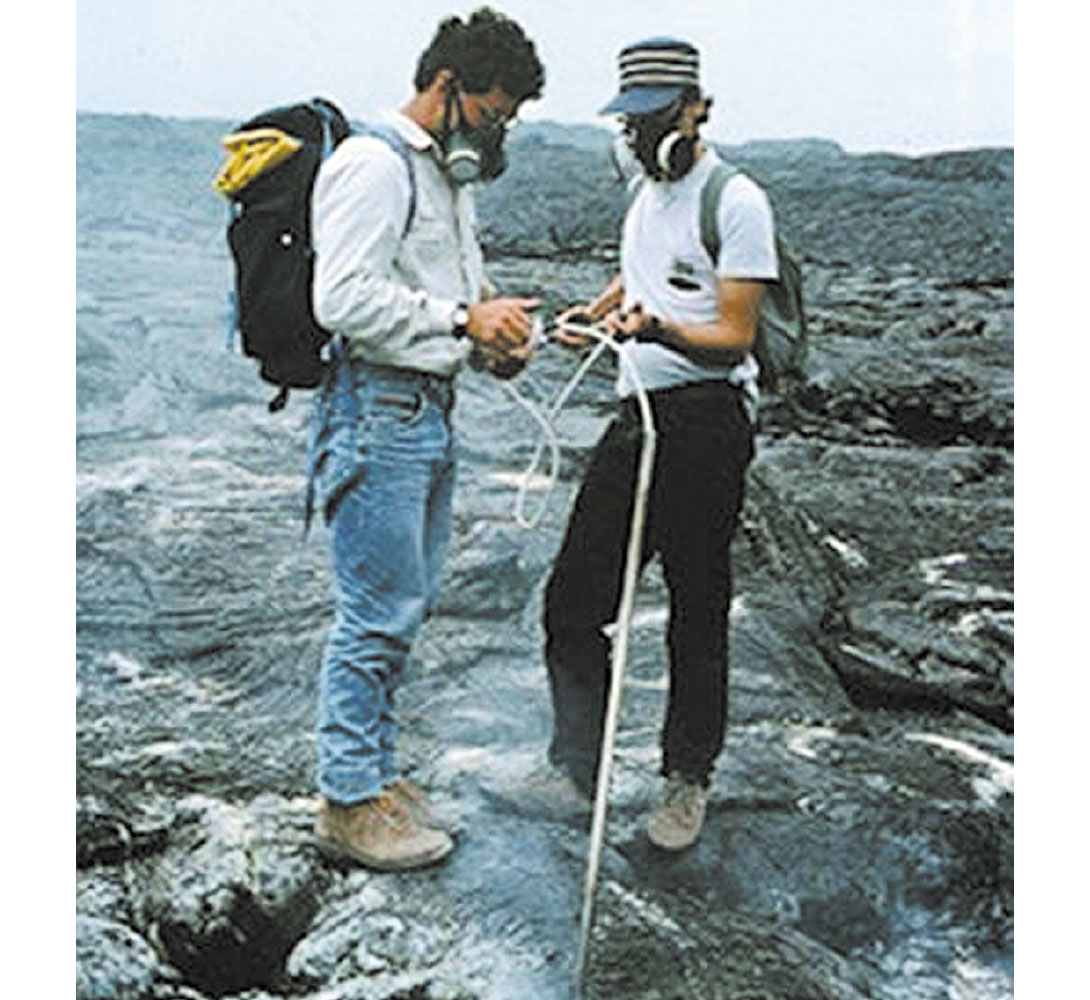
- Field sampling with lab analysis gives geochemical information about a particular place at a particular moment (Figure 9). Direct sampling of gases escaping from fumaroles is the only way to fully characterize the composition of gases discharging from volcanoes, and also to collect data needed to determine the origin of specific gases. Moreover, it is possible to detect ascending magma by studying the gases that escape from active points and the fumaroles.
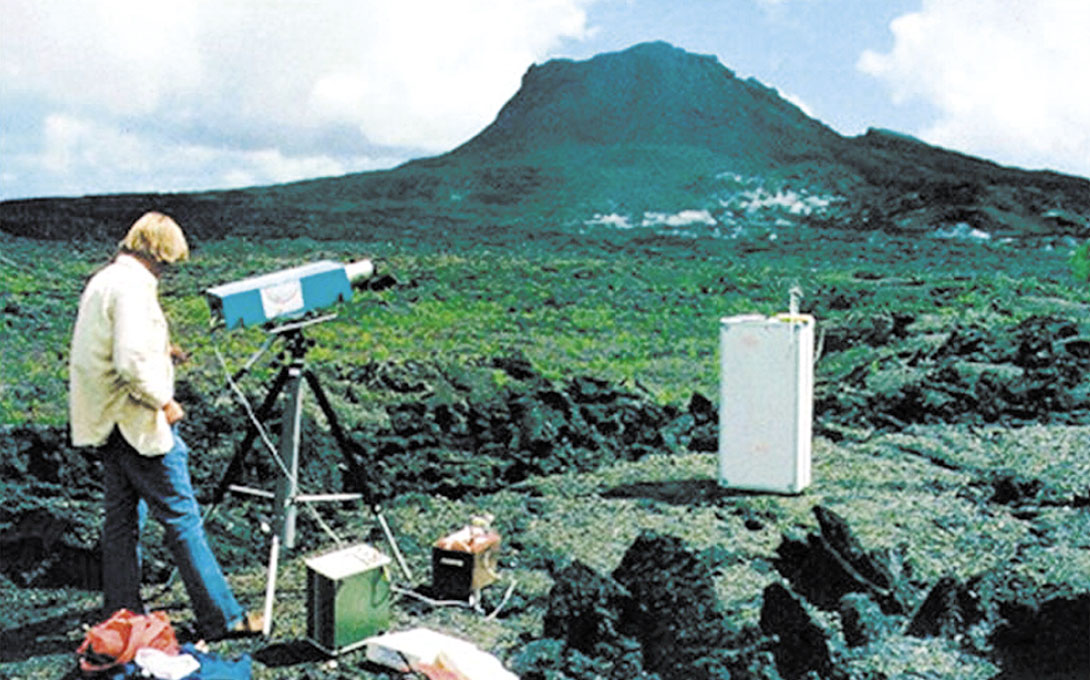
- Measurement of the amount of gas emitted from the fumaroles gives average emission of certain gases. These measurements are taken with an equipment called COSPEC (Correlation Spectrometer, Figure 10). With this technique, the rate at which a volcano releases gases into the atmosphere, especially sulphur dioxide (SO2) and carbon dioxide (CO2), is related of the volume of magma within its magma-reservoir system. Changes in the emission of those gases, can give clues to the scientists about alterations that may me be occurring within the volcano.
- The technique works like this: the ultraviolet solar energy of a specific wavelength is absorbed proportionally to the SO2 concentration and thickness of the fumaroles. Then, the COSPEC measures this absorption (in units of concentration by distance), and it’s checked against a standard SO2 absorption within the instrument. Multiplying the cross-section of the fumaroles with the speed of the wind, it is possible to obtain the amount of SO2 being emitted.
- Continuous monitoring reveals temporary changes in gas concentrations. Nevertheless, sampling volcanic gases is ideally suited for long-term study of volcanic systems because it produces a detailed chemical analysis of specific fumaroles and vents. This method is not well suited for monitoring rapidly changing conditions because of the time necessary for completing a laboratory analysis (often days or weeks). Furthermore, this method is often an unsafe activity for scientists when a volcano becomes increasingly restless because of the necessity of sampling at or near the potential eruptive vent. As we see, each technique has advantages and disadvantages, and a comprehensive study of the gases released by a volcano, should include all of these techniques.
4. Geology
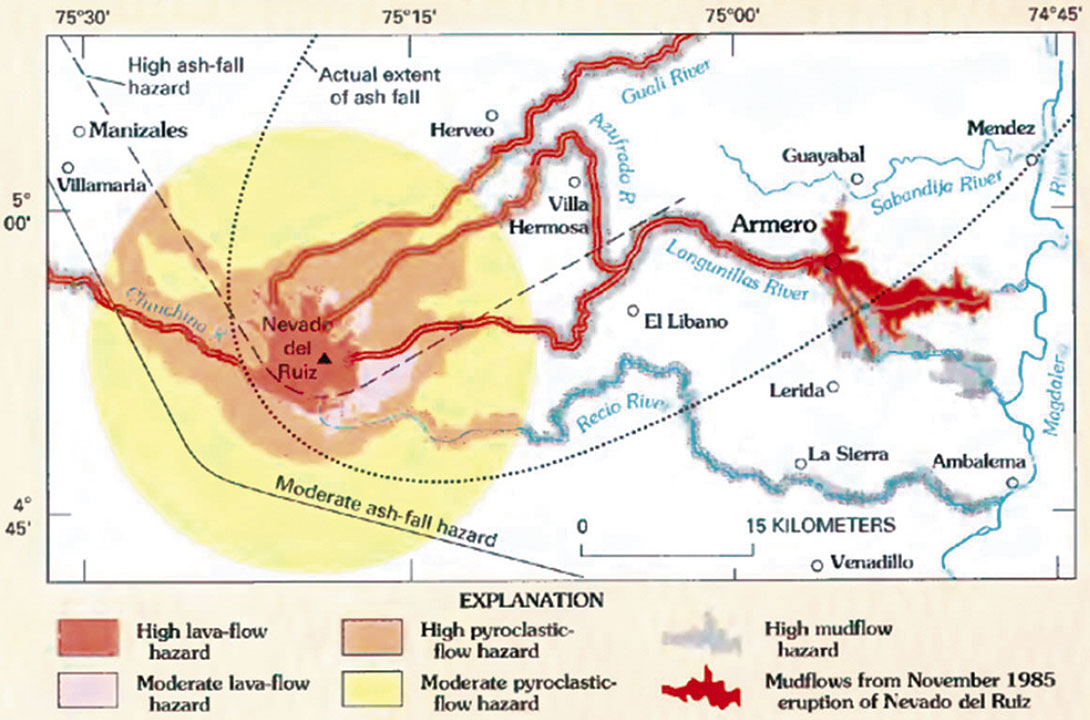
Using geology, volcanic hazard maps (Figure 11) are created to capture a volcano’s eruptive history, and they provide an easily understood visual representation of its possible or likely future eruptive behaviour. Information captured can include whether it has had eruptions in the past, the type of eruptions, their magnitudes, the types of associated volcanic hazards, and the areal distribution of major hazard zones. Among the main volcanic hazards are air blasts, volcanic gases, lava flows, landslides, pyroclastic flows and lahars.
With the integration of all of the data collected from seismology, deformation, geochemistry and geology, scientists can, in a very reliable way, estimate if the volcano system is suffering destabilization and an eruption is likely imminent.
So, next time you visit an area where there is an active volcano with its corresponding Volcanological Observatory, you will feel much safer knowing about all these applied techniques!


Share This Column