I’ve been getting more and more feedback on these “Science Break” articles, and that’s great. If you have any ideas for future articles, please pass them on. Alternatively, if you’d like to submit your own article, please contact me. I’d love it if we could run guest articles. My contact info is oliver.kuhn@divestco.com or (403) 298-5639.
Chris Irvine contacted me regarding “Skin Colour” (November 2008). He had heard of an alternate black body radiation theory – that darker skin allows a person to give off heat more effectively in hot climates, and lighter skin helps to retain heat in cold climates, obvious evolutionary advantages depending on local climatic conditions.
I was not aware of this theory, but it sounded plausible and I looked into it. Judging by the dates of some of the articles I found, it is probably an older theory that has fallen out of favour. More recent research has shown that dark skin blocks out light at the UV end of the spectrum, but not at the infrared end. This means that whether a person is light- or dark-skinned makes no difference to the amount of heat they absorb since most heat is at the infrared end. Presumably going the other way is the same thing i.e. light or dark skin, it should make no difference to the amount of heat (infrared frequency) radiated back out by the body.
A few readers contacted me regarding “Hangovers” (January 2009), and asked why I hadn’t included the well known ‘hair of the dog’ hangover cure – drinking alcohol the next morning (or day) after heavy drinking. I had actually thought about including this in the article at the time of writing but decided against it.
There is a certain element of truth to this hangover “remedy”. The etymology of the term ‘hair of the dog’ is interesting, and dates back to before the 1500s. The full expression is ‘hair of the dog that bit you’, and refers to an old cure (disproved) to relieve the symptoms of being bitten by a rabid dog. It involved putting a few hairs from the rabid dog into the bite wound. People had observed that drinking alcohol can lessen hangover symptoms, so the transfer of the term makes sense.
The generally accepted wisdom is that drinking the morning after will indeed reduce hangover symptoms, but the positive effects are only temporary, and the hangover will return with interest, so to speak. There are two main theories. The first is that since a big part of a hangover is actually alcohol withdrawal symptoms, then giving the body more alcohol will help – but you’re on your way to becoming an alcoholic. The second theory, with less support among scientists, is that the ethanol helps dilute some of the other alcohols in the system that help create the hangover, thus providing temporary relief. Eventually the new ethanol will be metabolized, and will add to the hangover.
Weather maps
I have a confession to make. As long as I can remember, I’ve watched the weather report on TV, and looked at the little weather maps in the newspaper, and really not had a clue what it all meant. Not only am I unsure what the various meteorological symbols mean, I’m also really fuzzy regarding the basic concepts involved in meteorology. Well, I do know that warm air rises! This article is an effort to rectify that lack of understanding, and I hope it provides the same benefit to readers – think of it as Meteorology 101.
There are so many different types of weather maps, symbols and terms used, and complicated concepts and mechanisms, it would be impossible to adequately cover them in the space afforded here. I will stick to what we commonly see in the general media.
The weather maps commonly seen are known as synoptic maps. Synoptic comes from the Greek for ‘seen together”, and is used because such a map is created from meteorological data that were collected from a variety of weather stations at exactly the same time. This was only possible with the advent of telegraph technology. Synoptic maps are always large enough to display large scale weather systems, typically covering 1000km or more. Weather maps usually display information on temperature, pressure, and weather fronts. In combination, and displayed in map form, a knowledgeable person should be able to get a snap shot of current weather conditions, and be able to predict what will happen with the weather in the near future.
Weather fronts
The interaction between air masses of different densities is behind most meteorological phenomena, so information on weather fronts is prominent in weather maps. Air density is directly related to temperature, so one can also think of this as the interaction between cold (high density, dry) air masses and warm (low density, moist) air masses. The boundaries between air masses are known as weather fronts. On weather maps they are indicated as follows:


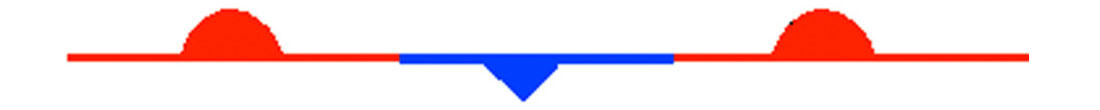

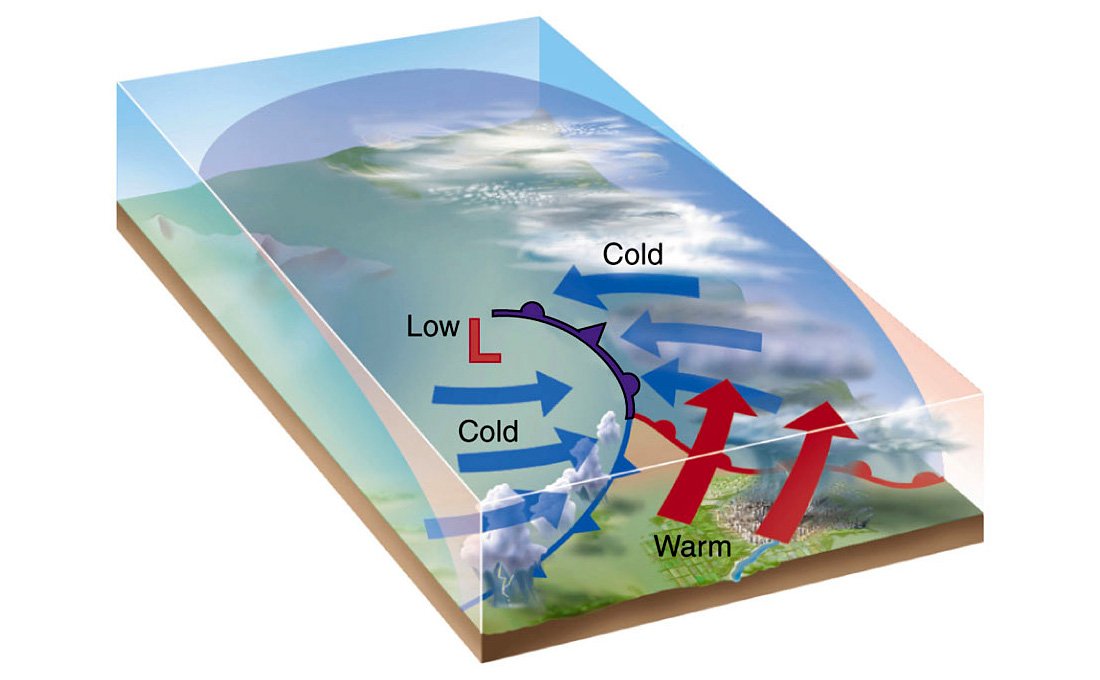
Figures 2 and 3 show the basic components of cold and warm fronts.
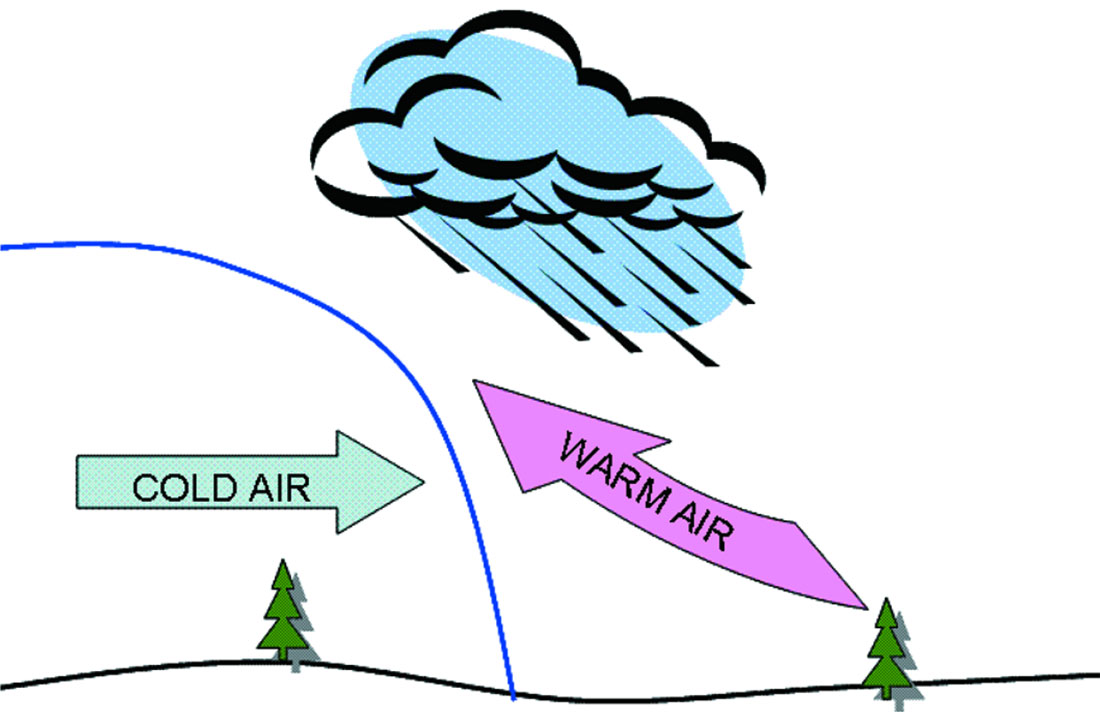
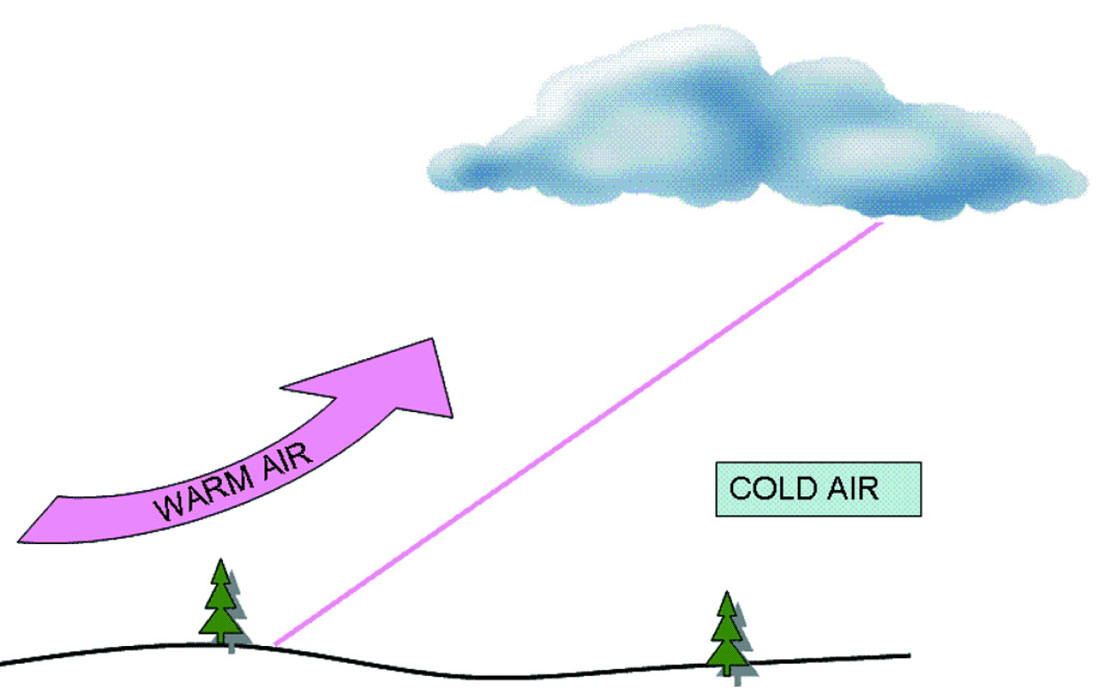
Notice that in both, the warmer air mass is forced upwards. Warm air typically contains more moisture, and as it rises and cools, condensation occurs. Therefore both cold and warm fronts are associated with clouds and precipitation. Some typical characteristics:
- Cold fronts are narrower than warm fronts
- Cold front cloud bands are narrow:- 50 to 400 km
- Cold front cloud bands are generally vertical
- Cold fronts produce pressure lows (troughs) along their front edge, caused by warm air rapidly rising
- Cold fronts (and occluded fronts) tend to move NW to SE in the northern hemisphere
- Warm front cloud bands are broader:- 500 to 1000 km
- Warm front cloud bands generally slope up and forwards
- Warm fronts tend to move polewards, SW to NE in the northern hemisphere
Sometimes the boundary between a warm and a cold air mass doesn’t move, because neither air mass has enough energy to push into the other’s area. This is called a stationary front. Stationary fronts are also associated with cloud and precipitation, and typically peter out after a few days.
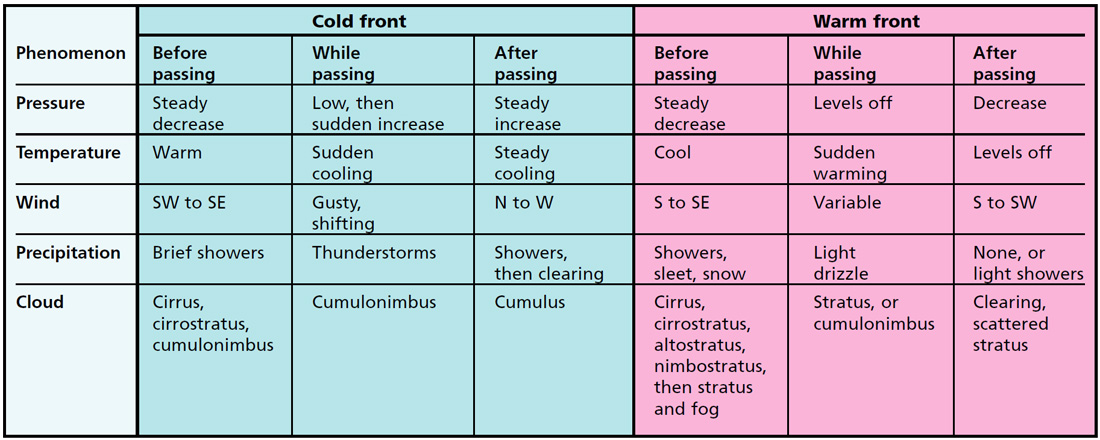
The following chart summarizes the kind of weather phenomena we should expect as a cold or warm front moves through. Note that the wind direction given is the direction that the wind is blowing from and only holds true for the northern hemisphere.
Occluded fronts are interesting. Higher density cold air travels more quickly over the earth’s surface, so cold fronts tend to move up to two times faster than warm fronts. This is because the high density low level air in their wake (i.e. the zone of turbulence) tends to push the cold air mass forward. Because of this it is common for cold fronts to overtake and “consume” warm fronts, resulting in an occluded front (Figure 4).
Occlusions tend to form in mature zones of low pressure, and rotate in a counter-clockwise fashion around the low as indicated in Figure 4. The advancing cold front burrows under the warm air mass, and at the same time turns in toward the low pressure on the left side. It eventually bumps into the cold air mass on the other side of the warm air mass i.e. to the east. If it is warmer than this other cold air mass, it rises above it, and this is known as a warm occlusion; if it is colder, then it burrows under it, and this is known as a cold occlusion. In both situations the warm air mass is squeezed into a characteristic triangular region, and lifted up into the troposphere. The word ‘occluded’ refers to this separation of the warm air mass from the cyclonic centre at the Earth’s surface.
Note that this describes a northern hemisphere occlusion, and this effect, and any other mentioned in this article, will manifest itself in reverse in the southern hemisphere. So in the southern hemisphere an occlusion will rotate clockwise around a pressure low.
Occlusions are complicated, and therefore a wide variety of weather effects are found at occluded fronts. The warm air rising can create thunderstorms, but generally the combined air mass becomes drier.
Pressure
Most weather maps show isobars; these are contour lines connecting points of equal atmospheric pressure. When isobars are closed around a pressure high, this is marked with an “H”. Conversely, a low is marked by an “L”. Troughs are elongated regions of low pressure, typically found along cold fronts, and are often indicated by dashed lines. Sometimes actual pressure values are shown in hectoPascals (hPa). Pressure differences are the reason why air masses are moving around at all. Air in a general sense will move from high pressure areas towards low pressure areas.
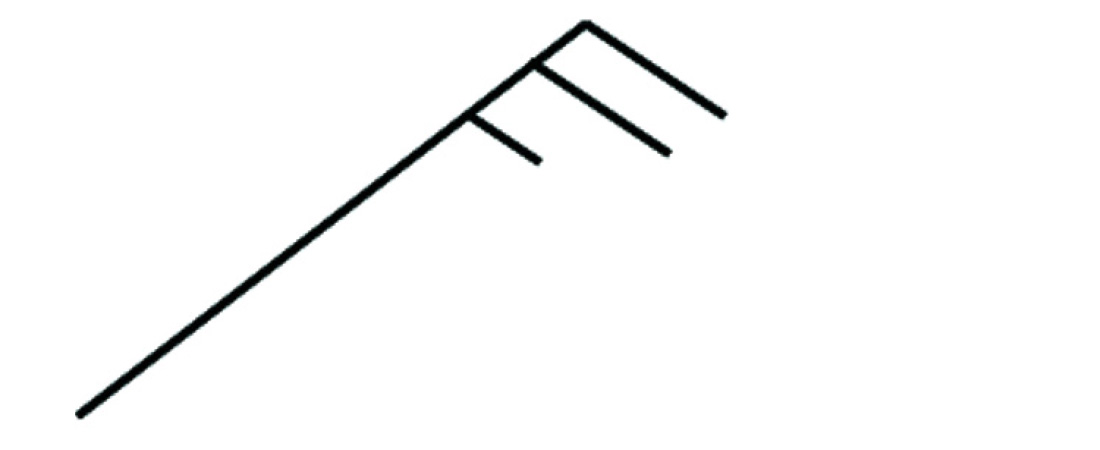
Because of the rotation of the Earth, we do not see movement of air in straight lines from high to low pressure areas. Instead, wind typically blows parallel to the isobar lines, with a low “L” on the left side (right in the southern hemisphere), and it deflects slightly towards the low pressure side, or away from the high pressure side. The greater the pressure gradient (i.e. the more tightly spaced the isobars are), the greater wind velocity is. Figure 5 shows a wind speed symbol. Of course wind direction and magnitude are also greatly influenced by topography, but this rule of thumb works well in flatter areas such as our Prairies. In our northern hemisphere, cyclones will rotate counterclockwise around a pressure low, and anticyclones will rotate clockwise around a pressure high.
When explaining the direction of weather system rotation, that famous Coriolis effect is often quoted, and often incorrectly. In fact, in my experience, in casual settings such as parties or bars, a scientist can use the Coriolis effect to explain almost anything, and get away with it. This is probably because many (or most) scientists are unsure about it, so how can the average non-scientist be able to call our bluff? But anyway, the Coriolis effect does play a role in weather systems, and so a brief deviation to that topic is in order.
The Coriolis effect can be understood by thinking of a missile being fired off at the equator, directly north. Its east-west velocity component upon launch, due to the earth’s rotation, is approximately 465 m/sec. to the east. Viewers of the missile at points progressively further north are moving at progressively lower velocities to the east, because the earth’s radius is progressively smaller further to the north. Ultimately a viewer standing at the North Pole has zero velocity to the east. So, the missile when viewed at points further north will appear to be curving away to the east. This apparent movement is solely due to the different east-west velocities of the viewer and the missile – in other words each latitude is a different frame of reference. Thus it is obvious that it is an effect caused by relative movement, not a real force. A wind moving south to north is much like a missile, so we would expect winds in the northern hemisphere to apparently veer to the east due to the Coriolis effect. In fact, we see the opposite.
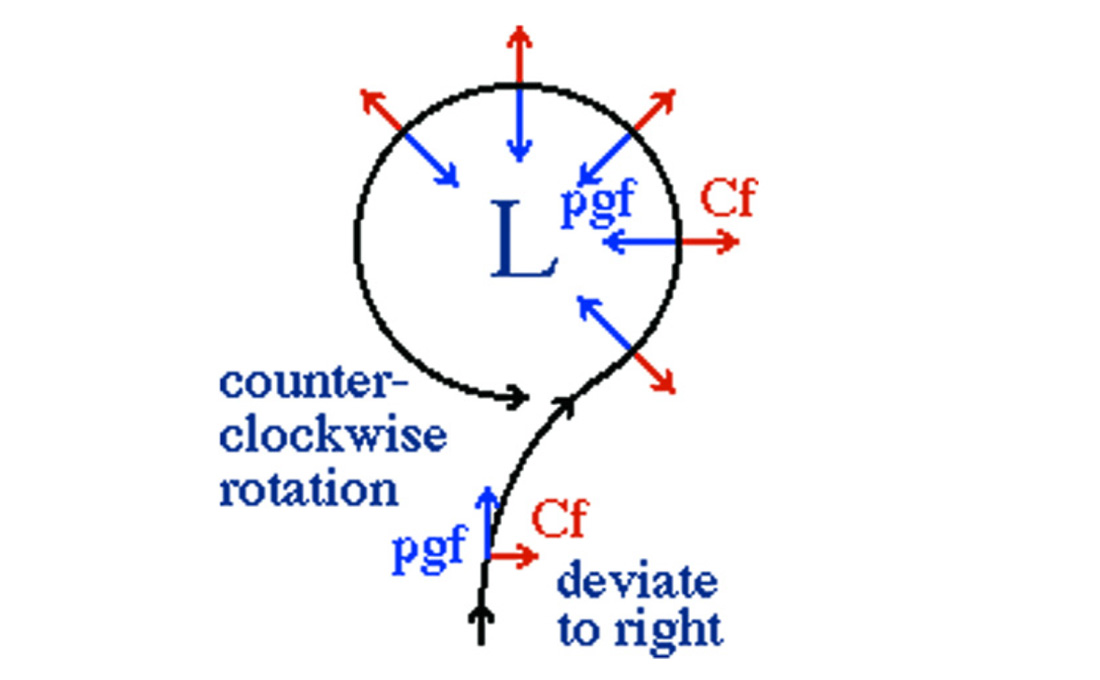
When analyzing weather systems, it is convenient to use a rotating frame of reference, i.e. the earth is stationary. When viewed this way the Coriolis effect becomes a force or pseudoforce. So, air will be pulled in towards pressure lows by the force associated with the pressure differential, but pushed outwards by the much smaller Coriolis force (Figure 6). The balance between these two forces creates the typical cyclonic counterclockwise air movement around pressure lows in the northern hemisphere, and clockwise anticyclones around highs. The Coriolis effect is negligible at the equator, hence the lack of cyclonic weather phenomena in equatorial regions. Readers who are interested in this aspect of weather should look into the relationship between atmospheric pressure, Coriolis force, and centrifugal force, as quantified by the mathematics behind the Rossby number. In fact there exist numerous weather topics with fantastically interesting science behind them, each of which constitute entire fields of study on their own.
Putting it into practice
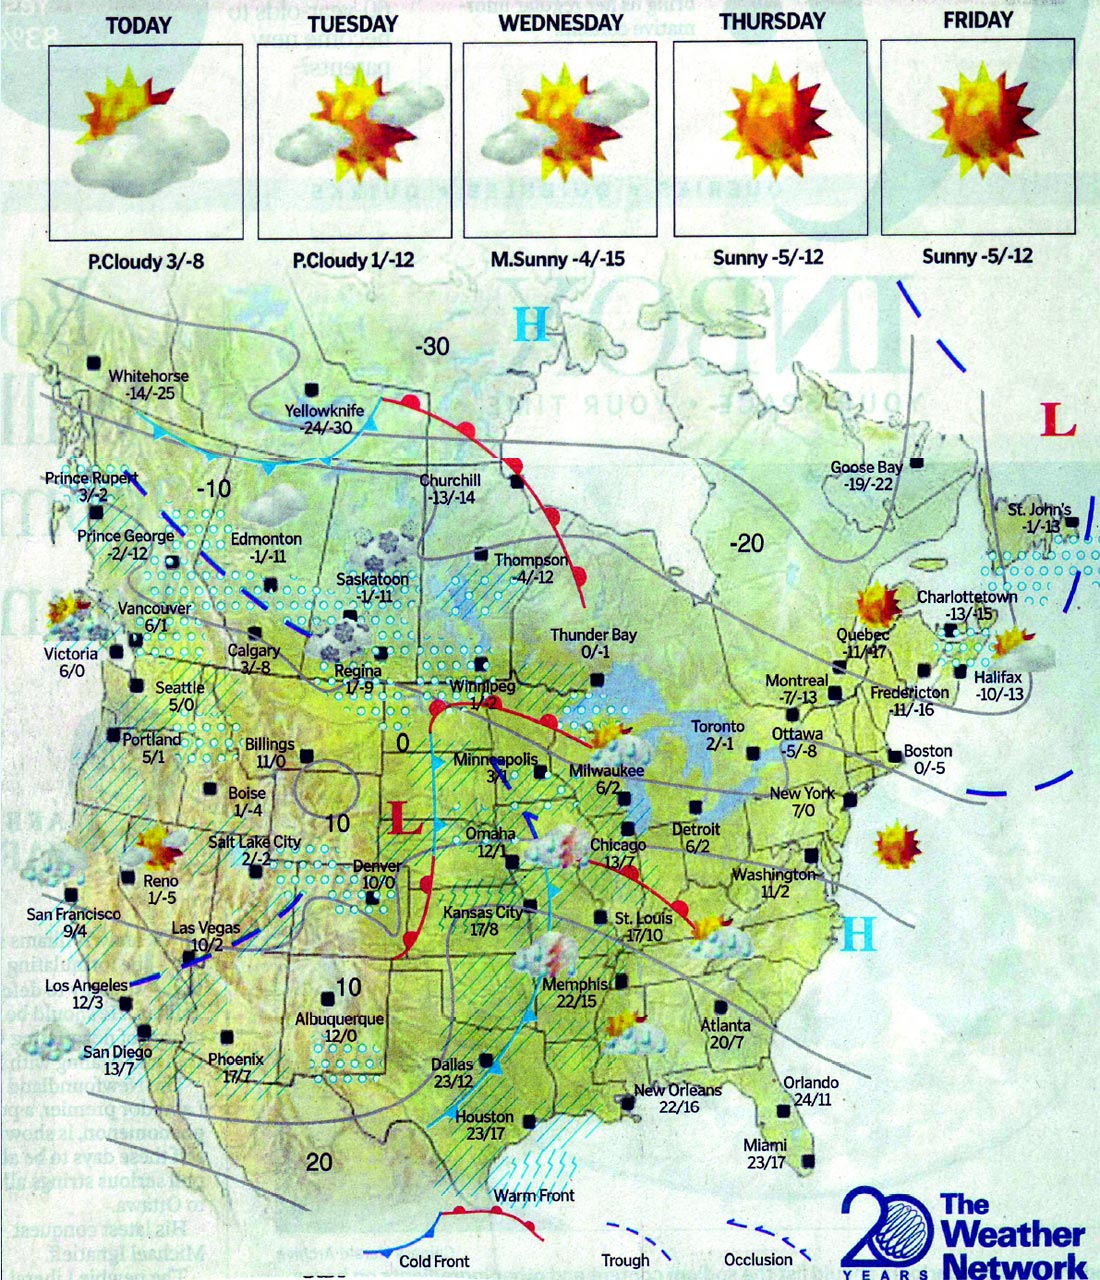
So, to get back to the main topic, Figure 7 is a weather map from the Calgary Herald, Feb. 9, 2009, courtesy of The Weather Network. What does it tell us?
- There is a cold front pushing down from the Northwest Territories.
- The trough ahead of this front is associated with snow across the prairies.
- The cold front will likely swing down and east through the prairie provinces, and possibly catch up with the warm front over Hudson Bay, forming an occluded front.
- Temperatures in the western provinces are still relatively high from the warm front that has just passed through.
- As the cold front moves quickly past, skies will clear and temperatures drop across the prairies (this is echoed by the expert’s forecasts for Calgary above the map).
- The US southwest is in the middle of a trough, and experiencing rain, with snow at higher elevations.
- In the US Midwest there is a complicated sort of double occlusion system creating thunderstorms, with snow further north.
- Both these systems over the US will likely move east and swing through the Maritimes and Eastern Seaboard, leaving clear skies behind.
- Winds speeds aren’t indicated, but the isobars are wide apart and generally running east-west, so winds are likely from the west, at low to moderate speeds across the continent.
I’ve tested myself by analyzing one day’s weather map, and then seeing if my predictions hold true by looking at the next few days’ maps. I must admit that I don’t do very well, but I’m a long way ahead of my former state of weather map ignorance!


Share This Column