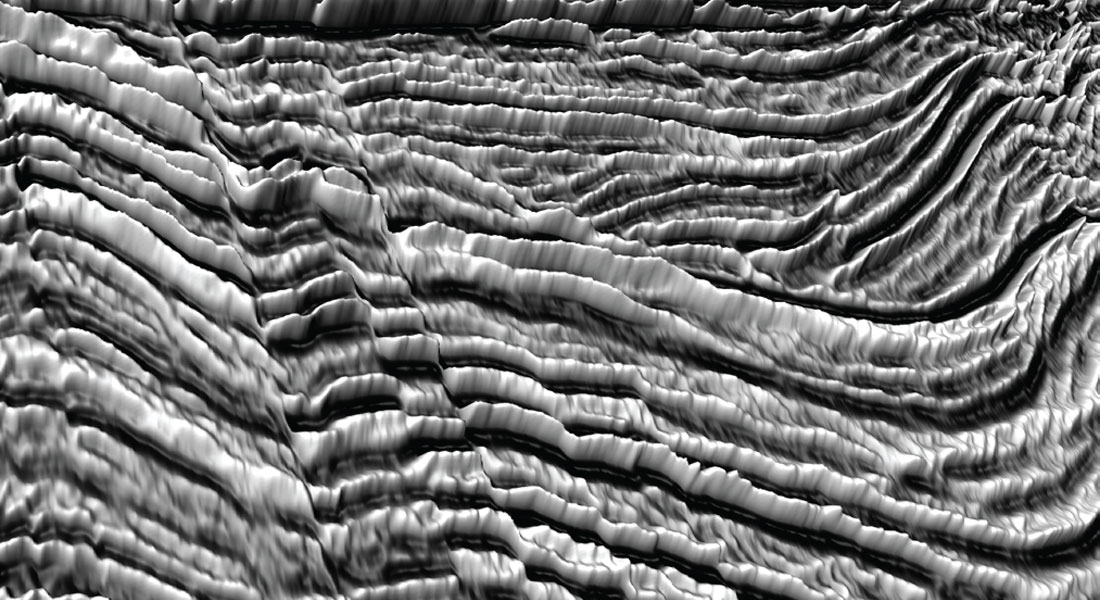
Seismic begins life as an analog acoustic wavefield. We record it digitally and we process it digitally but it is, in its natural state, continuous in both time and space. Despite the venerable familiarity of conventional seismic displays, seismic does not naturally segregate into individual (wiggle) traces and it does not naturally form a chromatic (variable density) or achromatic (gray scale) image. Seismic data naturally forms a three-dimensional, terrain like surface, one so complex that it can only be rendered effectively using modern multi-teraflop graphic cards. Suppose, however, that we developed modern graphics technology in the 1960’s, at the dawn of the digital era, long before conventional seismic displays firmly but incorrectly established our visual perception of what seismic data is and what it looks like. In that case, the seismic surface is all we would have ever worked with.
That much is obvious but what is not so obvious is the answer to the question of whether working visually with the seismic wavefield, instead of working visually with seismic amplitudes, which historically is all we have ever done, will make a difference. And if it does, how much of a difference will it make?
These are critically important questions for the future of exploration seismology because we have entered an era where our big theoretical discoveries are far in the past. We developed deconvolution in the late 60’s, migration in the late 70’s, 3D seismic in the mid-80’s and coherence and curvature attributes in the mid 90’s. They are all mature disciplines now and whereas there are improvements yet to be made in all of them, none promise to make a quantum level improvement in the clarity of our subsurface images.
Quantum level improvements only come with the introduction of a new technology. Once a technology has become familiar, subsequent improvements tend to come in exponentially decreasing increments none of which rate the same level of excitement as the original first application. This, in my opinion, is where we are with exploration seismology. If we haven’t already reached the limits of both temporal and spatial resolution then there is a general perception that we are close to them and that although seismic will be better in the future, no one is expecting it to be that much better.
But working visually with the analog seismic wavefield is something entirely new. It is something that because of technological limitations, we have never incorporated into either seismic processing or interpretation. As a result, as our processing algorithms and interpretation software have improved, we have been restricted to working visually with only crude and archaic representations of seismic amplitude. We have never worked visually with seismic in its natural state, as an analog acoustic wavefield.
Now that we can, it is time to ask the question of what level of impact working visually with the seismic wavefield will have on the clarity of our subsurface images. Will it have the same level of impact as did migration and deconvolution or is it all just for show? Are seismic terrain displays merely engaging curiosities or are they, despite their sometimes ethereal nature, critically important and essential new exploration tools?
In this talk I will begin to address that question by first splitting seismic data into three distinct types of information; amplitude; steeply dipping faults, events and noise trains; and character and waveform. Once I have done that, I will examine all three from both a theoretical and a historical perspective in an effort to establish how effective conventional seismic displays are at rendering their individual component of seismic information.


Join the Conversation
Interested in starting, or contributing to a conversation about an article or issue of the RECORDER? Join our CSEG LinkedIn Group.
Share This Article