Summary
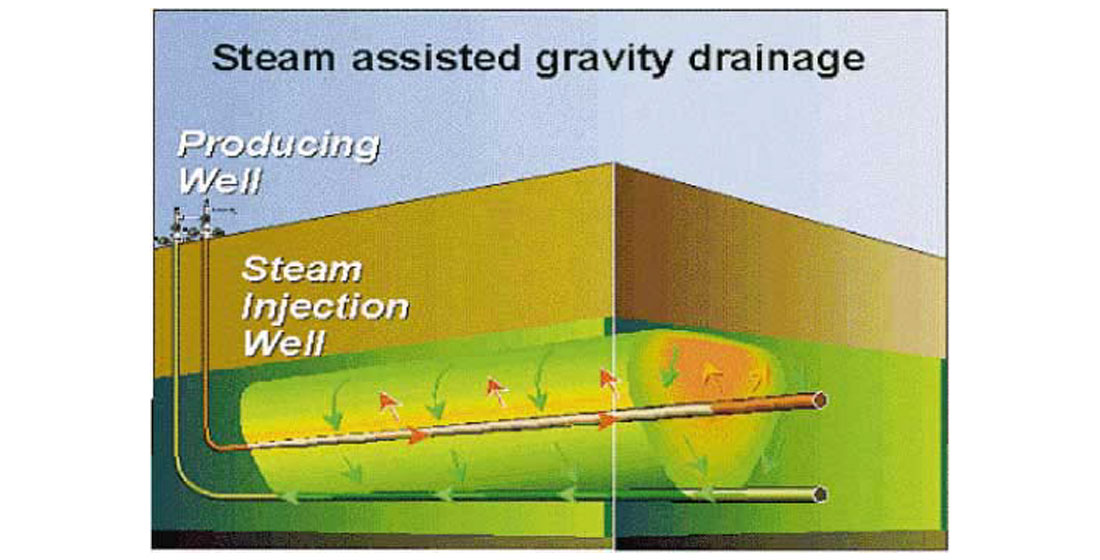
As part of the Christina Lake Phase 1 pilot project, six profiles of crosswell seismic data were acquired by placing both seismic sources and receivers in wellbores. The primary objectives of the survey are to provide a high-resolution reservoir characterization of McMurray formation to identify thin shale laminations (potentially permeability barriers) found in the reservoir and to provide baseline images for time-lapse evaluation of the steam movement in the SAGD (Steam Assisted Gravity Drainage) program (Figure 1).
Crosswell seismic data in this project have provided better than two metre resolution reflection images in the McMurray Formation, detected lateral and vertical facies changes, shale stringers and indicated severe reservoir heterogeneity, all of which helped to more accurately characterize the reservoir and better predict reservoir performance under thermal operations. Results of the six profiles provide encouraging insight into the potential of crosswell technology.
Introduction
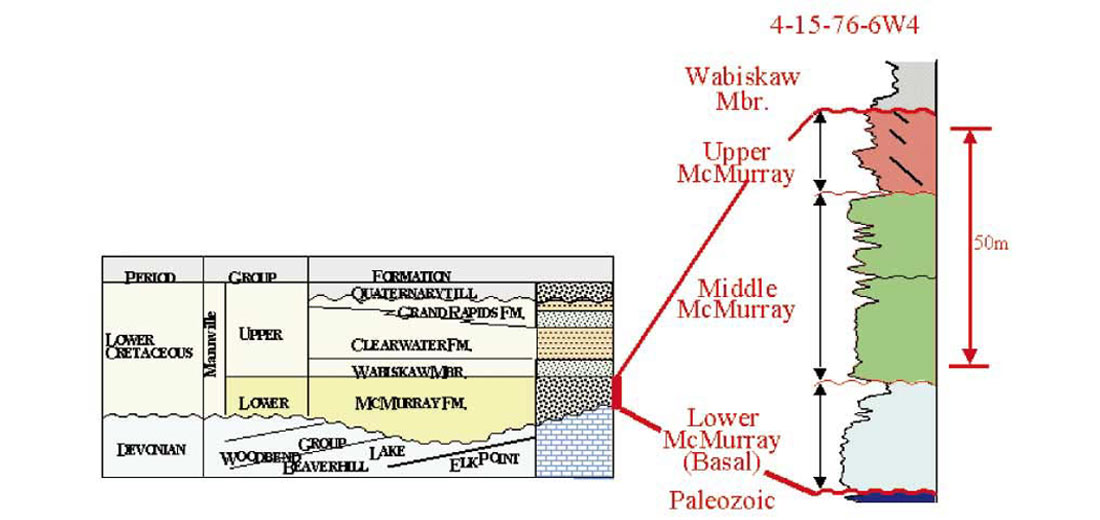
The Christina Lake Thermal Project is located in northeast Alberta, about 170 Km south of Fort McMurray. The lease area consists of 35 sections or 22,400 acres. The project is a three phase development scheduled to last approximately 30 years, with the first phase currently under construction. The bitumen (8-10 degrees API) reserves are hosted in Lower Cretaceous (McMurray Formation) fluvial, estuarine and marginal marine sandstone. The McMurray Formation reservoir at Christina Lake is about 400 metre deep, stratigraphically and lithologically complex, consisting of stacked estuarine channels each characterized by rapid lateral and vertical facies changes (Cody et al., 2001).
In the past, a variety of extraction techniques have been employed to mobilize the bitumen in the south Athabasca area. To date, the most promising technology for application is SAGD. SAGD consists in injecting steam in an upper horizontal well to produce the hot bitumen and condensed water in a lower horizontal well positioned at the base of the exploitation zone (usually 5 to 6 meter below the injector). This process largely depends on gravity. One of the most critical risks is the presence of vertical permeability barriers, such as abrupt changes in lithology, the presence of laterally continuous shale stringers and small faults.
The McMurray Formation at Christina Lake has been subdivided into 3 units – the Lower, Middle and Upper channel (Figure 2). The Phase 1 pilot area has surface 3D seismic (12.5 m by 12.5 m bin size, 10-15 metre resolution) and 15 observation wells. Surface 3D seismic data have been interpreted and are able to map the three channels. On the 3D, however, the finer-scale (1~2 meter thick) shale plugs are much harder to detect, so are the possibly extensive flood plain or tidal flat mudstones and IHS (Inclined Heterolithic Stratification) beds.
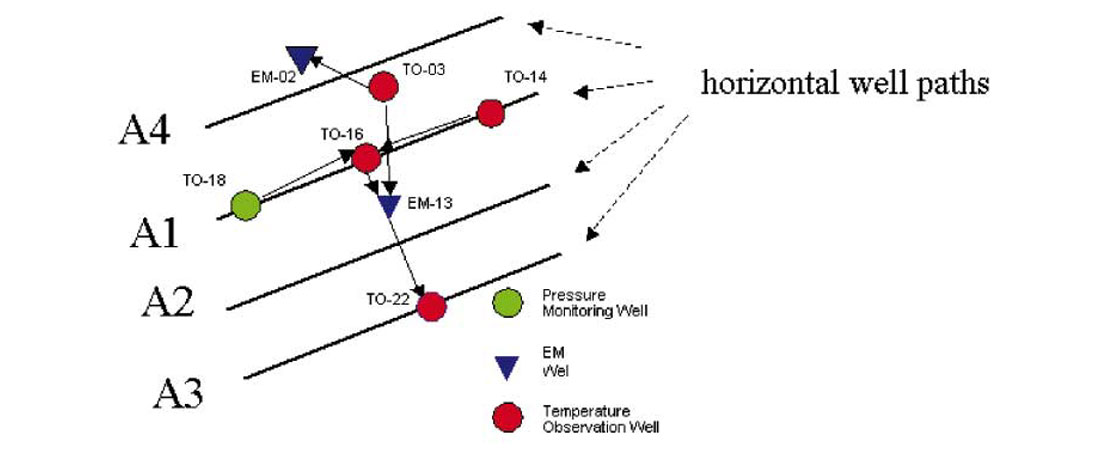
Six crosswell seismic profiles were acquired in February 2001 (Figure 3) in order to gain much higher resolution in the reservoir images and fill the information gap between surface 3D seismic and well logs. The goal of the survey is to better understand reservoir architectures by detecting the lithogy changes, shale stringers and their lateral and vertical distributions.
Data acquisition and processing
The data were acquired with a fluid-coupled piezoelectric source and multilevel fluid-coupled hydrophone receivers. The chosen acquisition parameters included: a sweep length of 2500 milliseconds, frequency from 200 to 1200 Hz, a sample rate of 0.25 milliseconds, a listen time of 250 milliseconds, and eight sweeps per 5 feet. Overall data quality is moderate to good. The well spacing ranges from 50 metre to 300 metre. The attenuation of the high frequency was clear as the well spacing increased.
Data processing involves both traveltime tomography and reflection imaging to generate images of the interwell region. Traveltime tomography generates a “lower” resolution and quantitative image of interwell velocity and this velocity model is used for VSP-CDP mapping to generate a “high” resolution reflection image. The major processing steps are wavefield separation (direct arrival and tube wave removal, up/down-going separation), amplitude correction, VSP-CDP mapping (Lazaratos, 1993), angle transform, AVA(amplitude versus angle) analysis and stack. Final stacks showed the frequency of 500 hz for the longer profile (well spacing 280 metre) and 800 hz for the shortest profile ( well spacing 50 metre).
Interpretation
Unlike surface seismic images, all six crosswell profiles are presented as true depth sections, thus removing the time-to-depth ambiguity associated with velocity in surface seismic data. These images are not zero-offset seismic sections of the type produced from surface seismic data and are generated from angles ranging from about 35 to 55 degrees. The six profiles have been correlated with far offset (35-55 degrees) synthetics and have reasonably good ties.
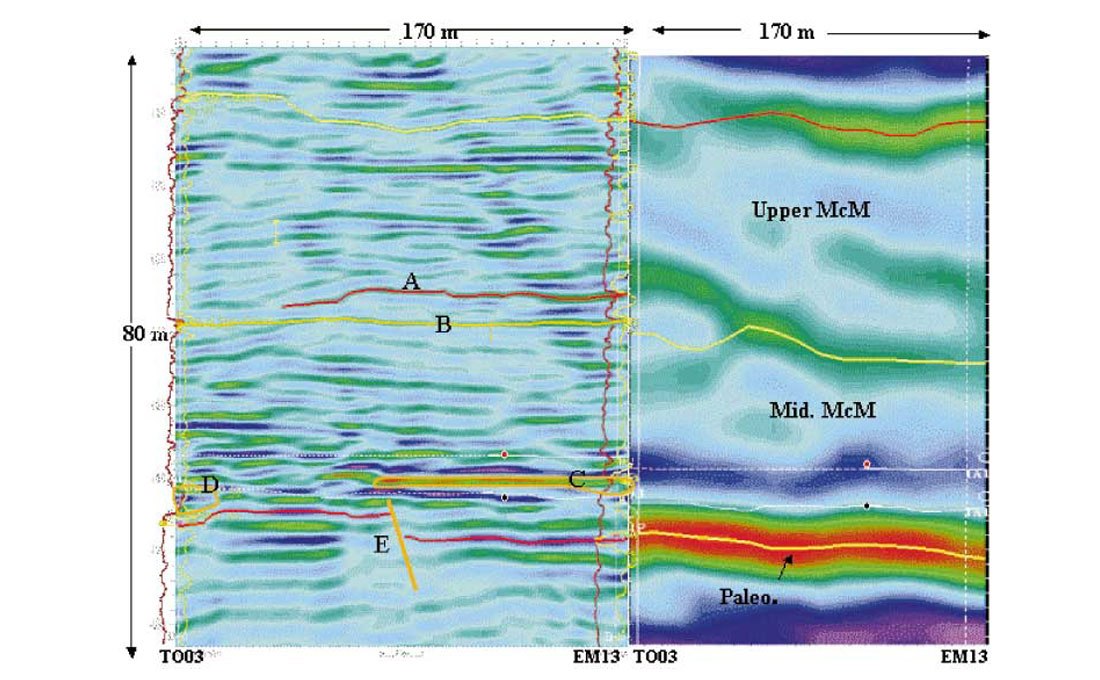
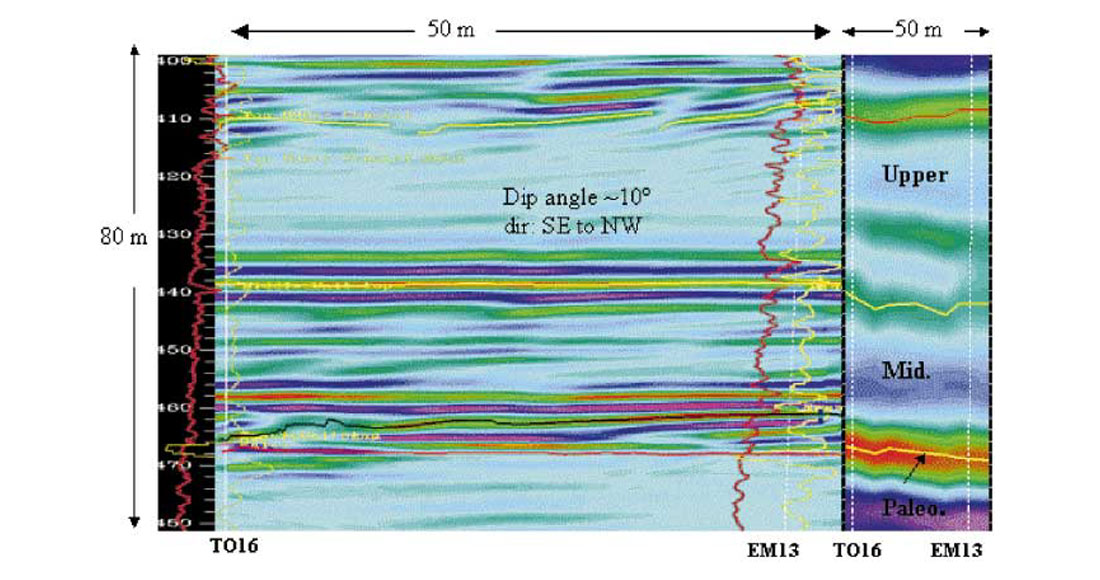
Figure 4 shows the down-going (reflections from above the source and receiver depths) P wave reflection image of profile EM13TO03. To aid the description and interpretation of the images, far offset synthetics (yellow color) and Gamma-ray logs (red color) are plotted. The geological interpretation here is accomplished mostly by comparing the crosswell image with an interpretation of the well logs of EM13 and TO03 wells. With the processing applied, the reflection image is strictly a qualitative picture and interpretable in terms of only the geometry of the impedance boundaries generating the reflection events. Nevertheless, this information is extremely valuable for it represents the detailed geometry of the reservoir. Figure 4 shows the horizons generated by reflection imaging correlate remarkably well with the major log markers. The two thin shale beddings (A, B, about 1 metre thick each, 4 metre apart) between the Upper and Mid-channels can now be resolved clearly and correlated, which was not attainable on surface 3D seismic (the right side in the figure). The pinchout was observed at the left side of shale “A”. The other shales at the bottom of the Mid-channel (C) and the top of the Lower channel (D) were also correlated with well logs at a much higher confidence than the surface 3D seismic shot in the same time. Shale “D” was resolved as local mudstone plug. The distribution of these four mudstones was clearly imaged. A small fault (E) on the Paleozoic unconformity with a throw about two metre could be identified in the profile, which is hardly detected by surface 3D seismic. Figure 5 shows the up-going (reflections from below the source and receiver depths) P wave image of profile EM13TO16. The most striking feature of this profile is the imaging of the muddy IHS beds in the Upper McMurray channel, which reflects greater estuarine influence. This interpretation is consistent with dip meter information and outcrop estimates. The severe 2-D heterogeneity of the reservoir seen in these reflection images indicates the rapid depositional changes within the complex channel system.
Varied data quality from profile to profile was noticed through the interpretation. Since the McMurray channel sands are poorly consolidated and with very low velocity (about 2500 m/s), severe ray bending by two to one velocity contrasts at the Paleozoic contact created the unequal down-going wave coverage. The gas zones located in the Clearwater Formation and the top of the McMurray Formation are suspected as a strong source of background noise and additionally, they attenuated high-frequency signals and caused limited up-going wave coverage. Out of six profiles, only profile EM13TO16 recorded sufficient up-going wave data. Both converted mode imaging processing and attenuation testing have been undertaken to extend the applicability of crosswell seismic in the McMurray. Final integration of all the results may provide further enhanced reservoir characterization.
Conclusion
At present, a detailed structural and stratigraphic interpretation is highly needed for the reservoir management. Although there are needs in several areas for future research, the crosswell seismic data acquired have demonstrated their ability to complement and enhance the interpretation of surface 3D seismic, which lacks the resolution at stratigraphic scales, and high-resolution but low coverage well logs. Stratigraphic analysis at scales of about a couple of metres may provide new insight into reservoir analysis and geological processes at Christina Lake or the like, which will help the future SAGD development phases. The repeated surveys have been planned for every 12 months following start of steam injection to evaluate the steam chamber growth and movements in the reservoir.

Acknowledgements
We would like to greatly acknowledge the support and participation of PanCanadian and its Oil Sands Development Unit, and TomoSeis. Many thanks go to Bruce Marion for his valuable input.


Join the Conversation
Interested in starting, or contributing to a conversation about an article or issue of the RECORDER? Join our CSEG LinkedIn Group.
Share This Article