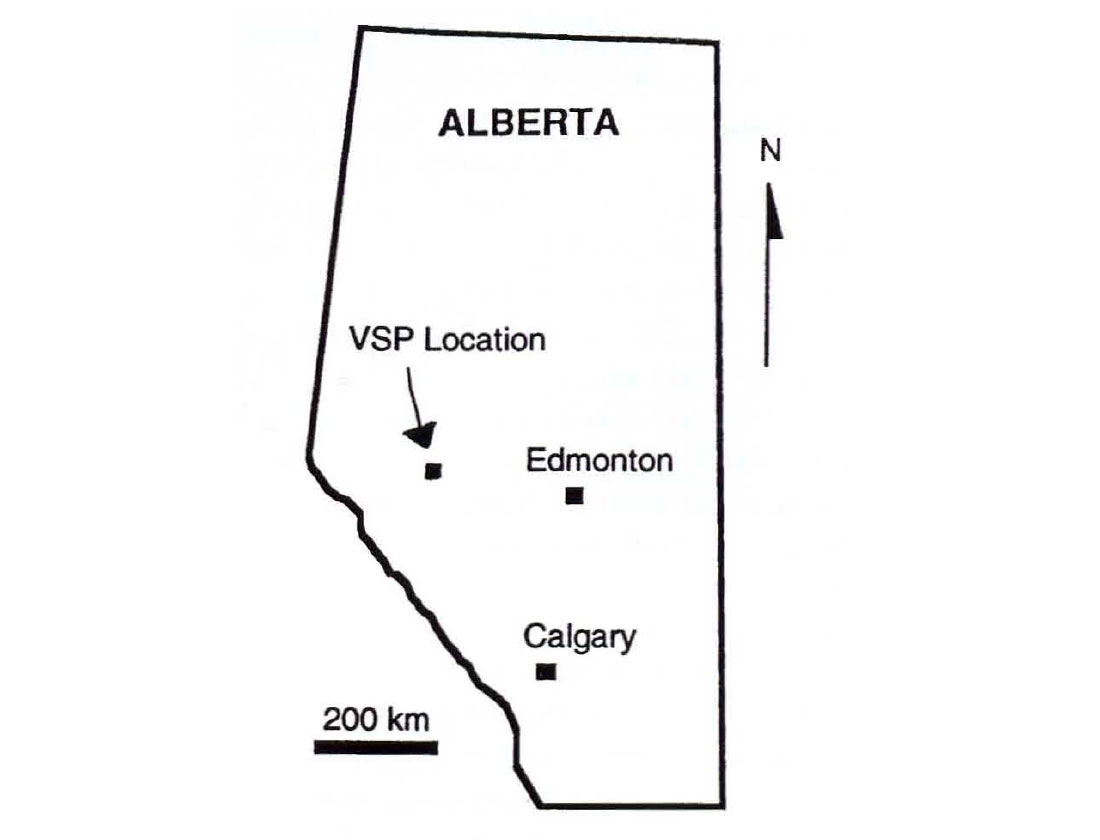
Over the past few years, Chevron Canada Resources has had an intense and successful exploration effort in the Simonette area of west central Alberta (Figure 1). During our investigations, it was noticed that seismic data in the Devonian section are severely lacking in frequencies above 50 Hz even though the Cretaceous yields plenty of signal out to 75 Hz (Figure 2). The Mannville coals were the suspected cause of the attenuation. Interbed multiples created by the coals could act as a transmission filter attenuating the higher frequency data. Since high resolution, and thus broad bank, data were essential to identifying our exploration target, it was necessary to confirm, model, and remove the effects of the coals from our data.
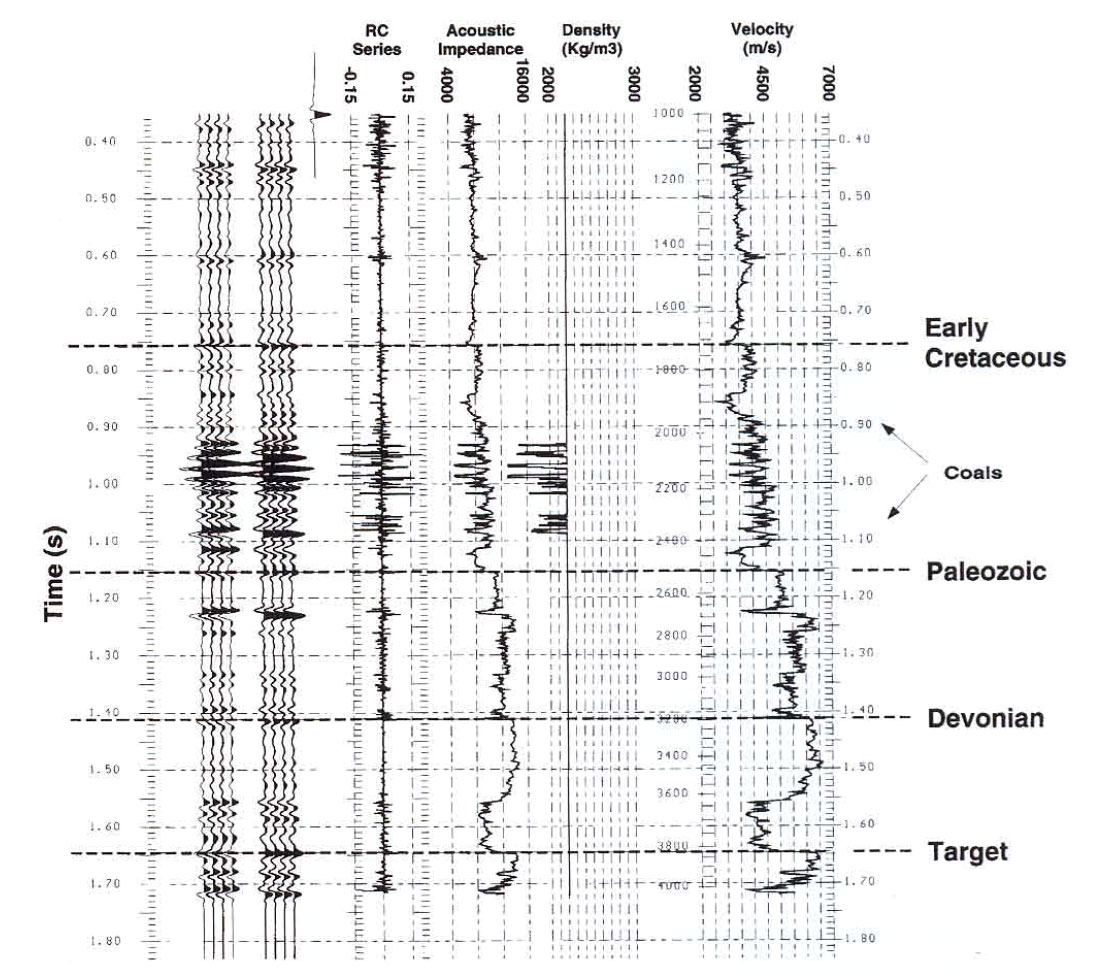
In 1991, Chevron drilled a Devonian test well in the area. A synthetic seismogram generated from this well (Figure 3) did not match our surface data. A VSP was run to investigate the mis-tie. It confirmed the presence of a multiple at our zone of interest and also gave excellent data with which to test our coal attenuation hypothesis.
Real data observations
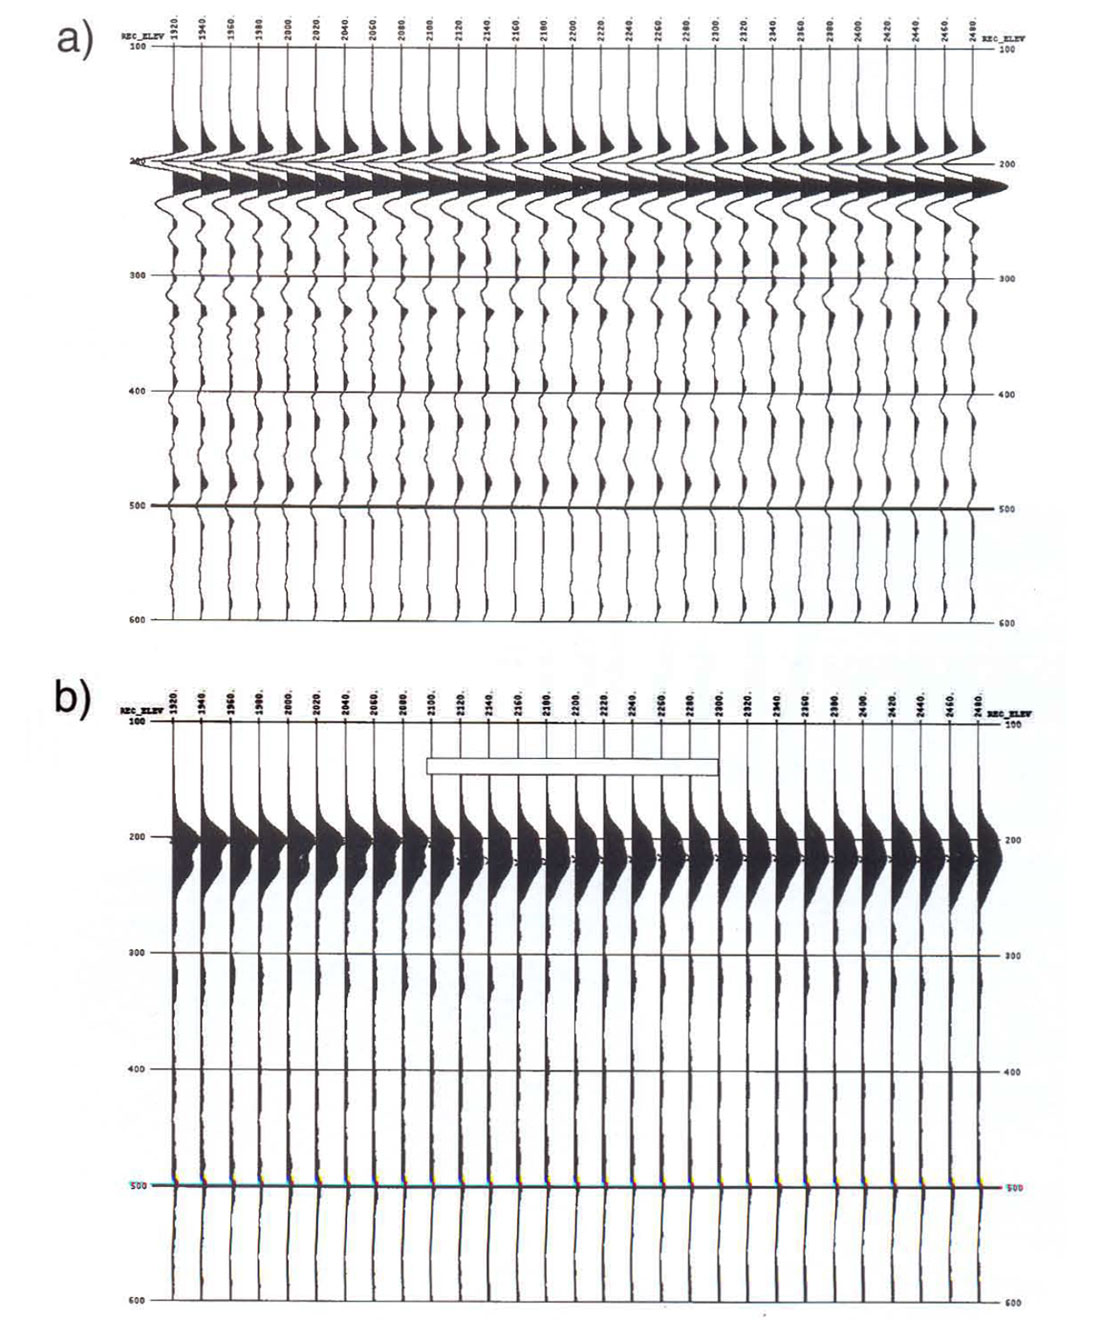
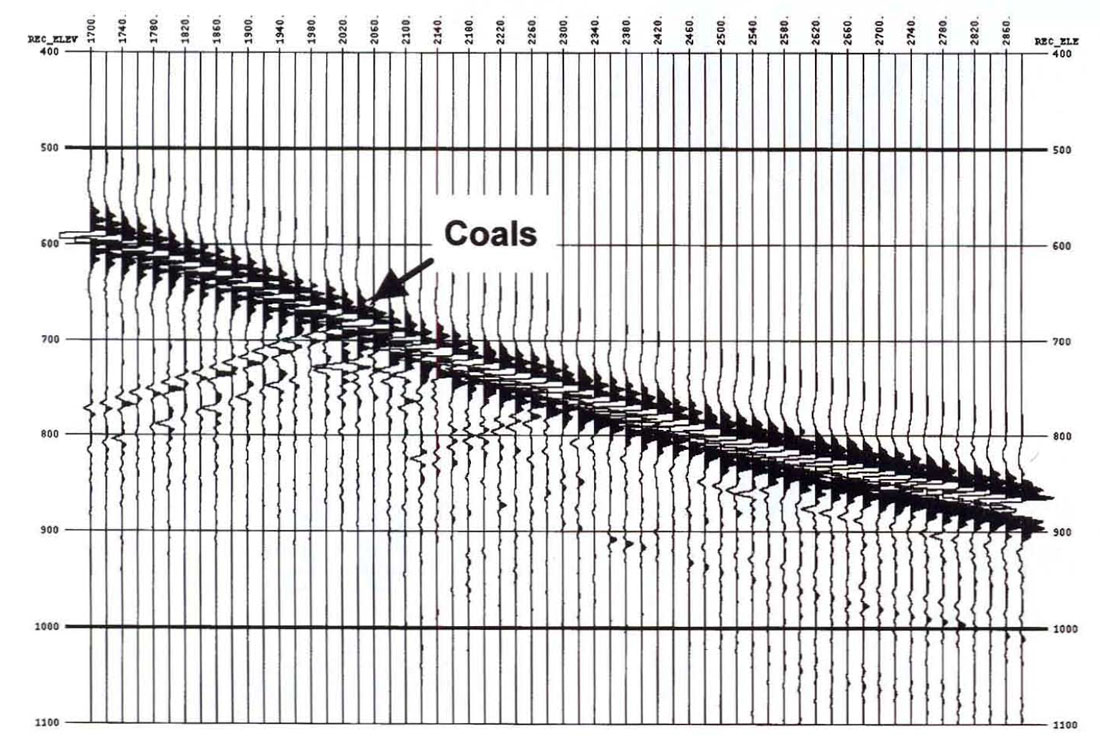
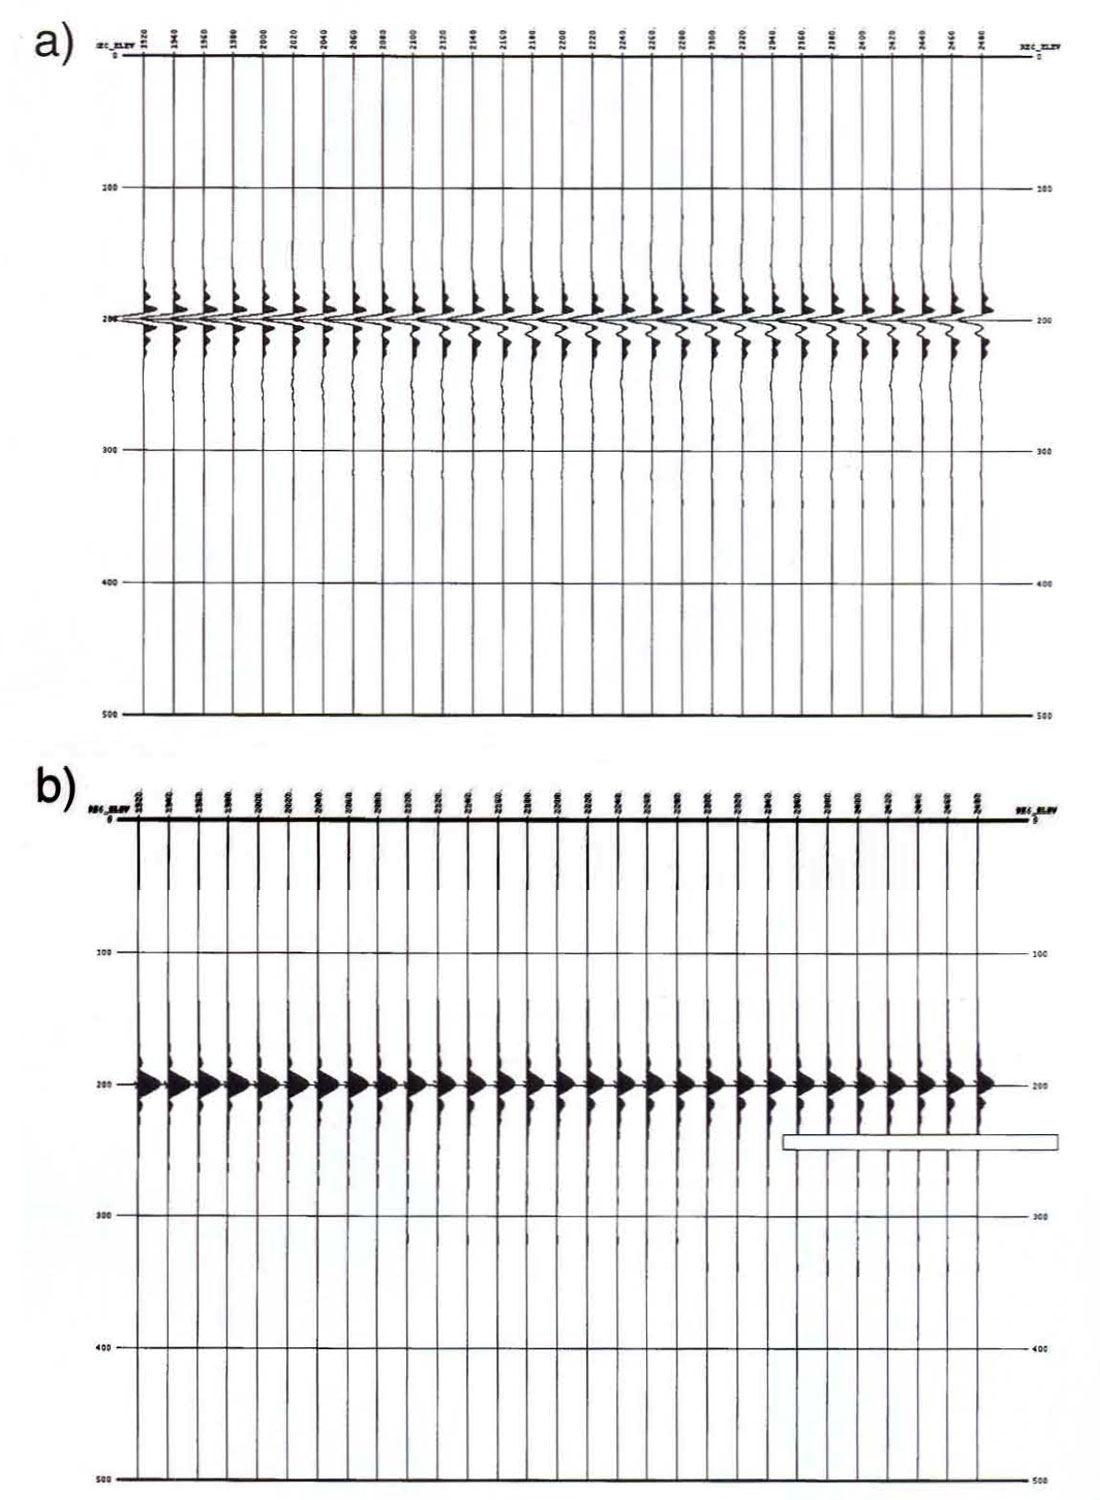
Figure 4, a subset of the raw data from the VSP, shows the very high amplitude reflection from the coals. Figure 5 shows the downgoing VSP wavefield and its amplitude envelope just above, through, and below the coals (flattened at 200 m). The attenuation of the waveform is visible even on these plots.
The data above the coals have a nice, compact waveform with a dominant period of about 34 ms. The amplitude envelopes are front-loaded with a total width of about 72 ms. After passing through the coals, the waveforms change significantly (righthand traces). They' are visibly broader (dominant period of approximately 36 ms and envelope width of approximately 88 ms) and the envelopes show a pronounced delay in energy. These changes suggest filtering of the waveform by a minimum phase transmission filter.

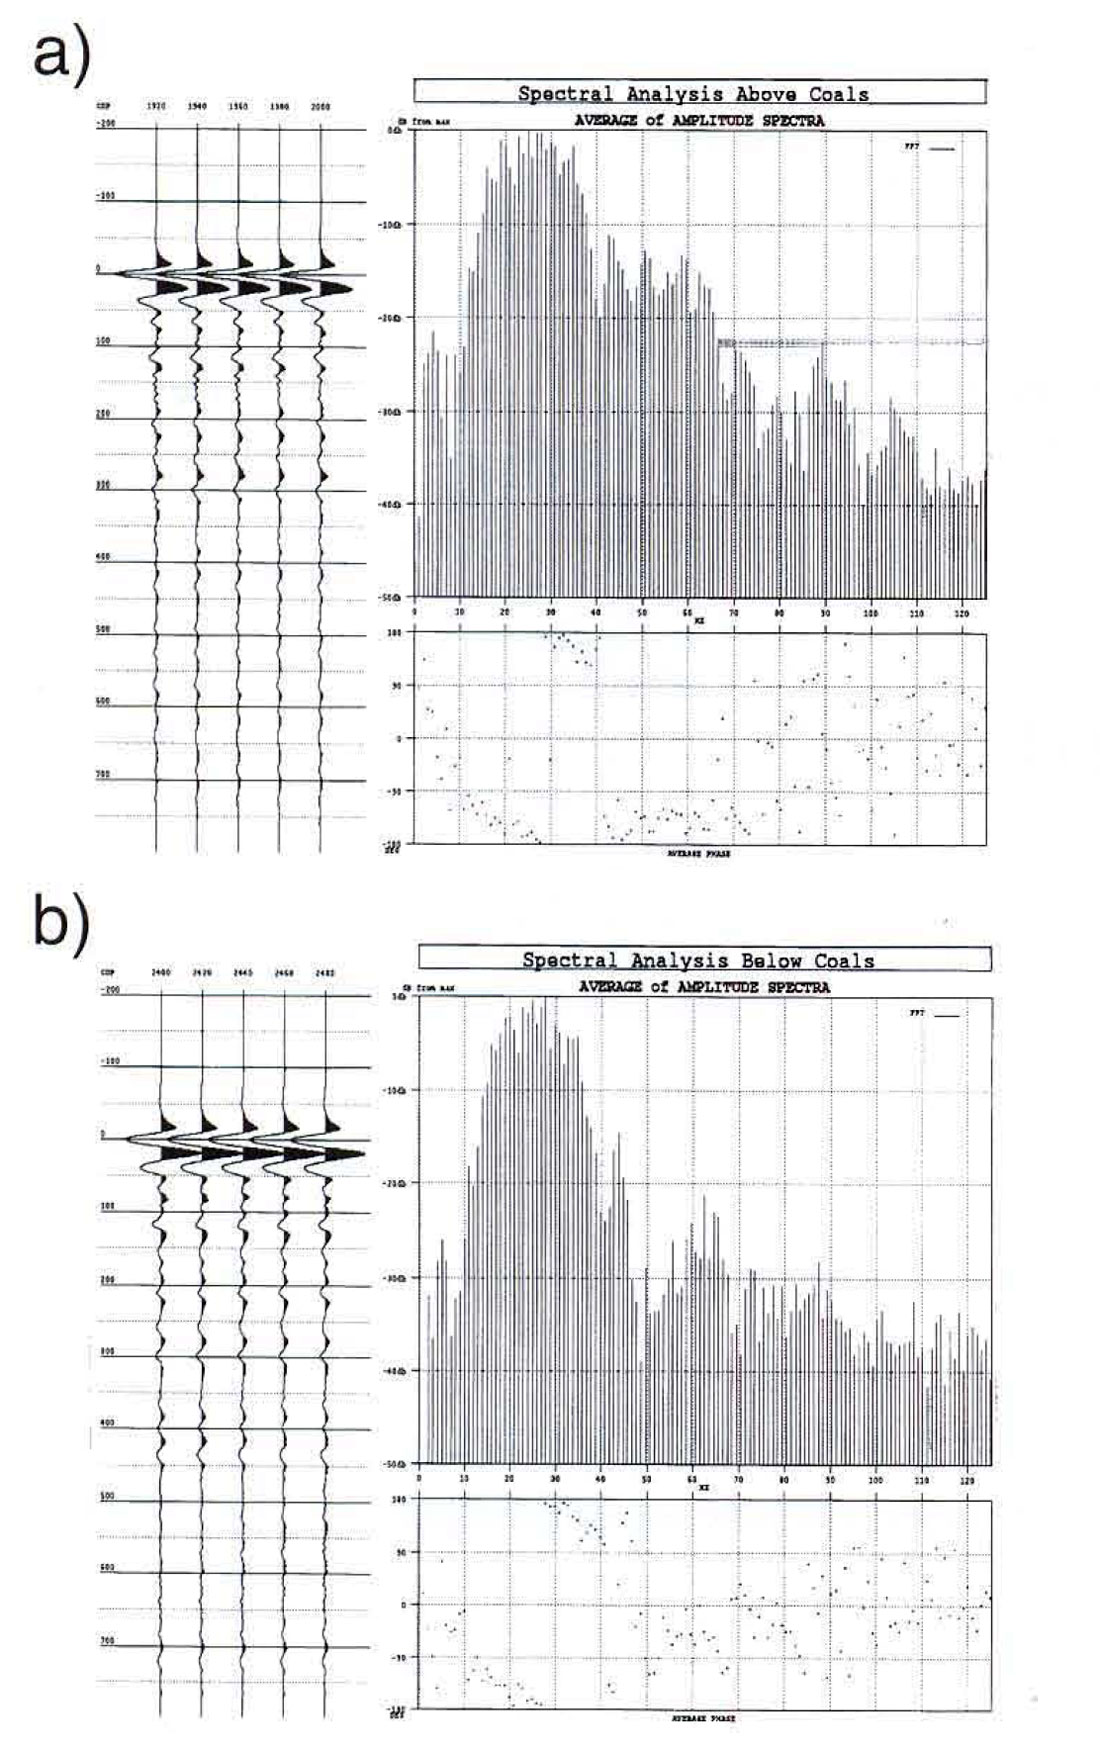
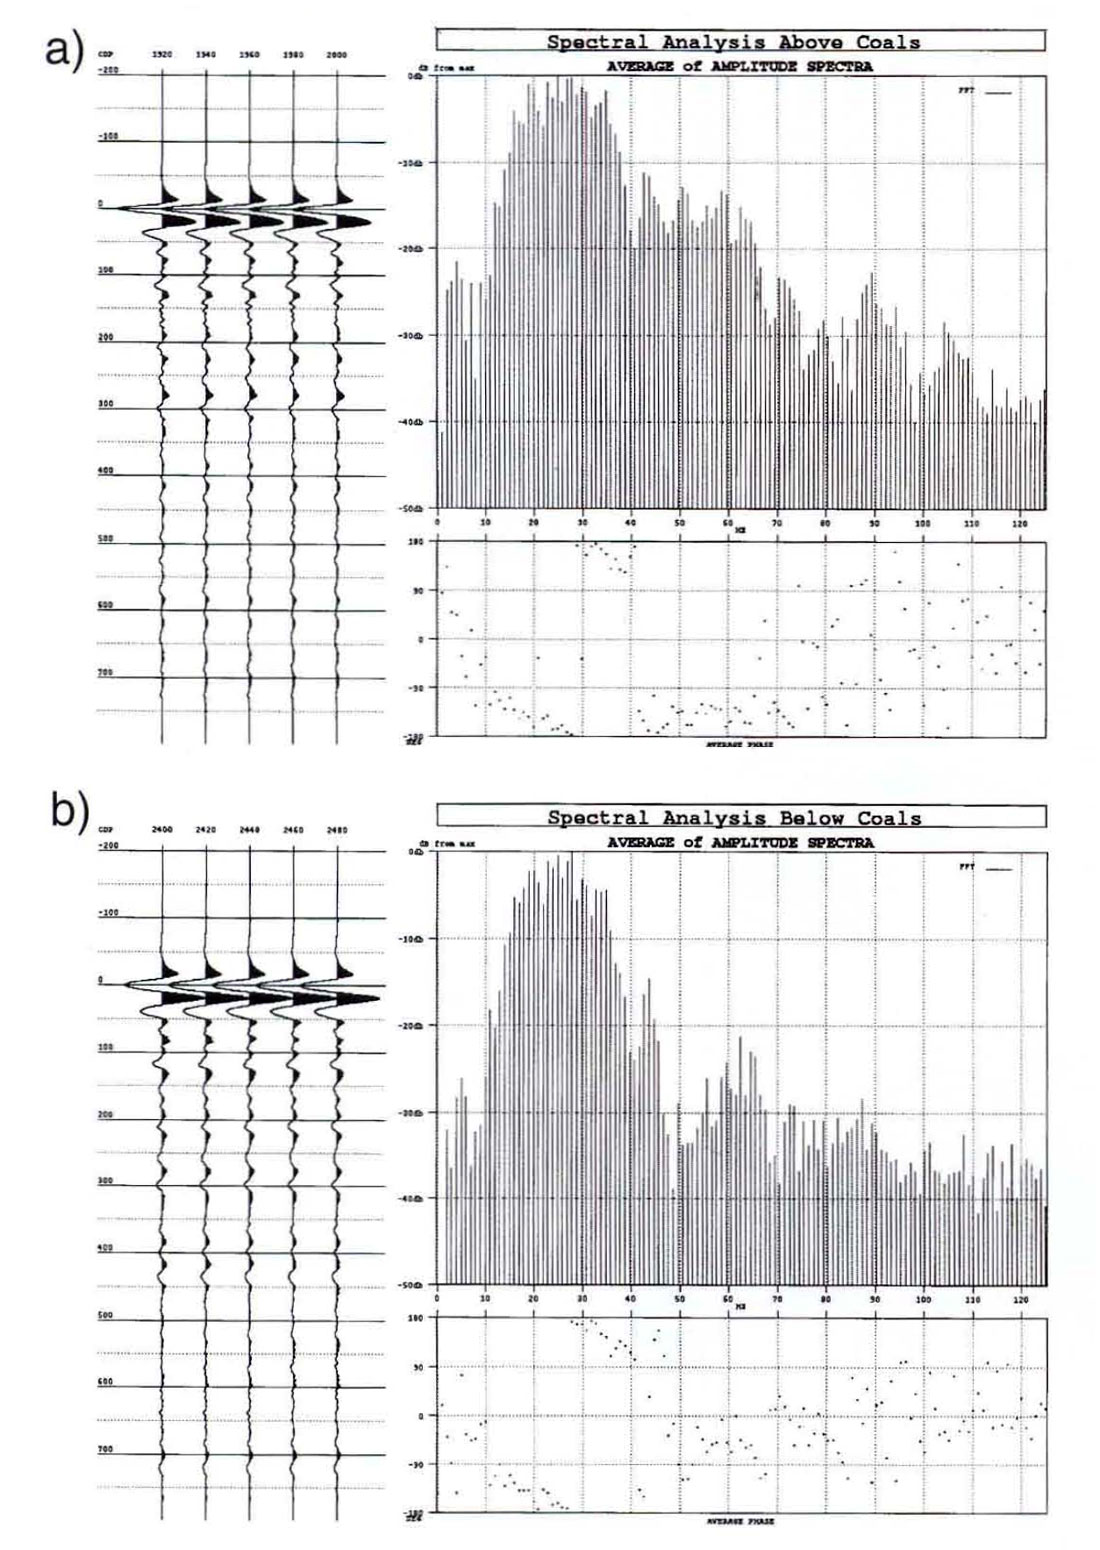
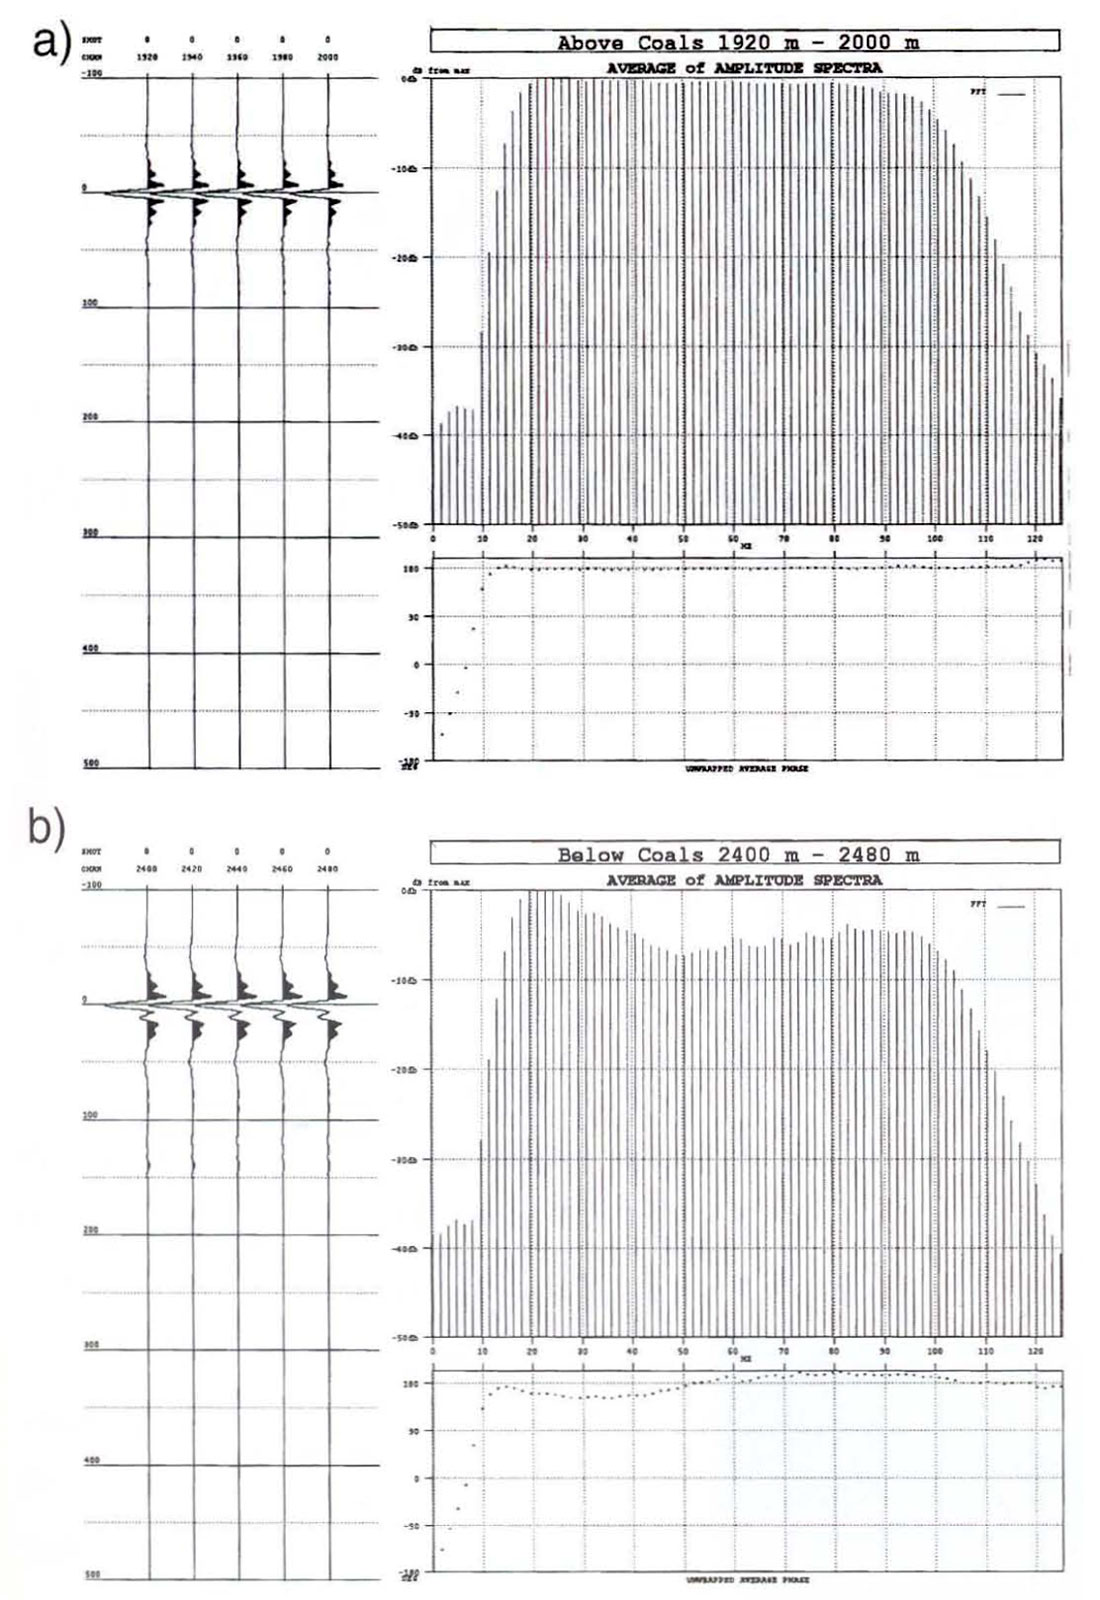
Spectral analysis of the waveforms above and below the coals quantify the measurements (Figure 6). The data above the coals are broadband with usable frequencies of 10-65 Hz. Below the coals, a pronounced notch is apparent at 50 Hz. The bandwidth of the signal is 10-45 Hz below the coals. Obviously, transmission through the coals has a substantial effect on the seismic waveform. It occurs over a short time window (100 ms), which is about three periods.
Modeling
We have attempted to model the observed phenomena using two different approaches. In all cases, the velocity model is derived from the sonic log trace measured in the well (Figure 3). The density profile is also shown in this figure. It was generated using a constant density of 2200 kg/m3 for the entire well except for the coals, which were give a density of 1200 kg/m3.
Elastic wave finite difference. Figure 7 displays the raw VSP modeled by SOLID, an elastic wave finite difference algorithm. The source waveform mimics an impulse response. Figure 8 shows the modeled downgoing VSP wavefield and its amplitude envelope. On these data, the coals generate an obvious side lobe that trails the main event by 10 ms. Spectral analysis of these data (Figure 9) do show the attenuation of frequencies centered at 50 Hz, but the severe notch in the observed VSP data is not replicated.
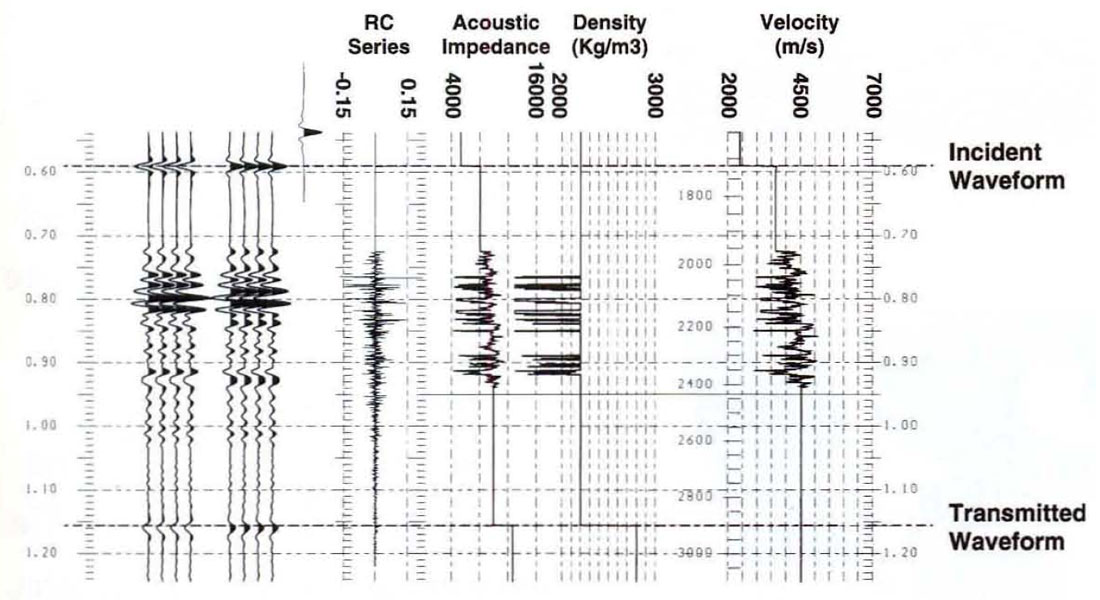
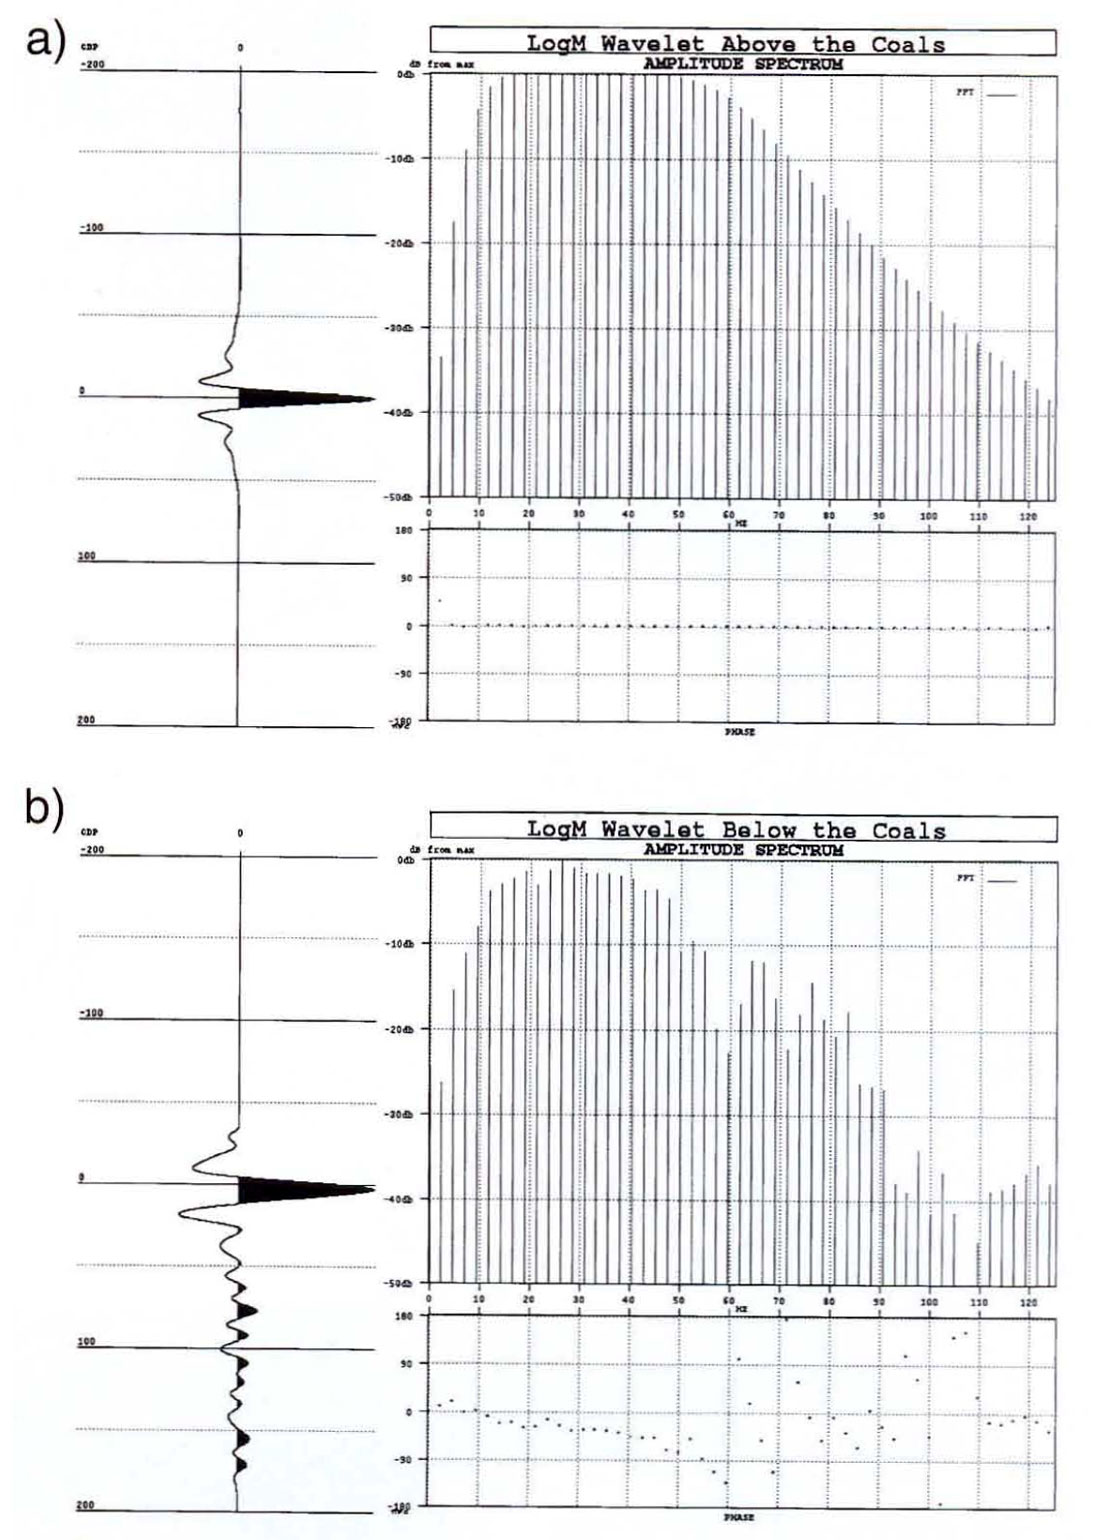
LogM synthetic with multiples. The effect of the coals can also be simulated using LogM (a 1-D convolutional modeling package). We have altered the sonic log by adding a step in impedance above and below the coals to capture the incident and transmitted waveforms. We have also turned on interbed multiples (Figure 10). Spectral analysis of the waveforms generated in this manner do show that a notch appears at 60 Hz in the spectrum below the coals (Figure 11) . Note also that the phase distortion suggests a minimum phase filter.
Transmission filter
Throughout our discussion, we have been stressing the idea that the coals generate interbed multiples that are equivalent to a transmission filter.
This idea was introduced by O'Doherty and Anstey (Geophysical Prospecting, 1971). Their theory suggests that a given RC series generates a transmission filter which is minimum phase and has the amplitude spectrum
F(ω) = exp(-R(ω) Δt)
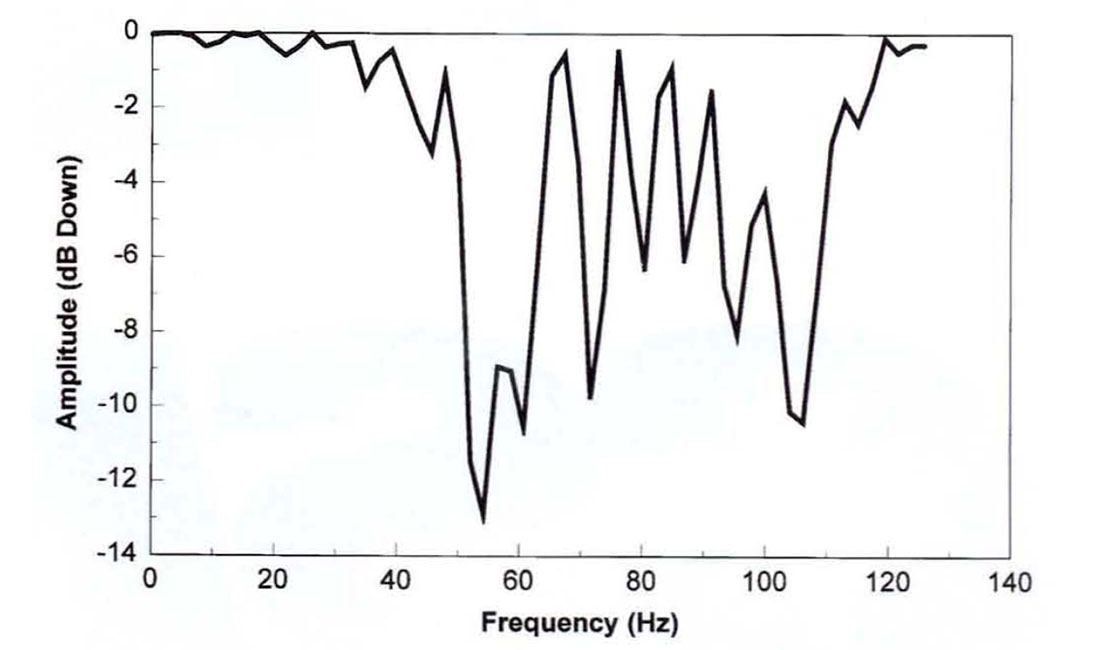
where F is the amplitude spectrum of the transmission filter. R is the power spectrum of the RC series and Δt is the transit time through the RC series. The amplitude spectrum for a transmission filter generated by the coals and calculated by this formula is shown in Figure 12. Notice the significant notch between 55 and 65 Hz and minor ones at 75 and 110 Hz.
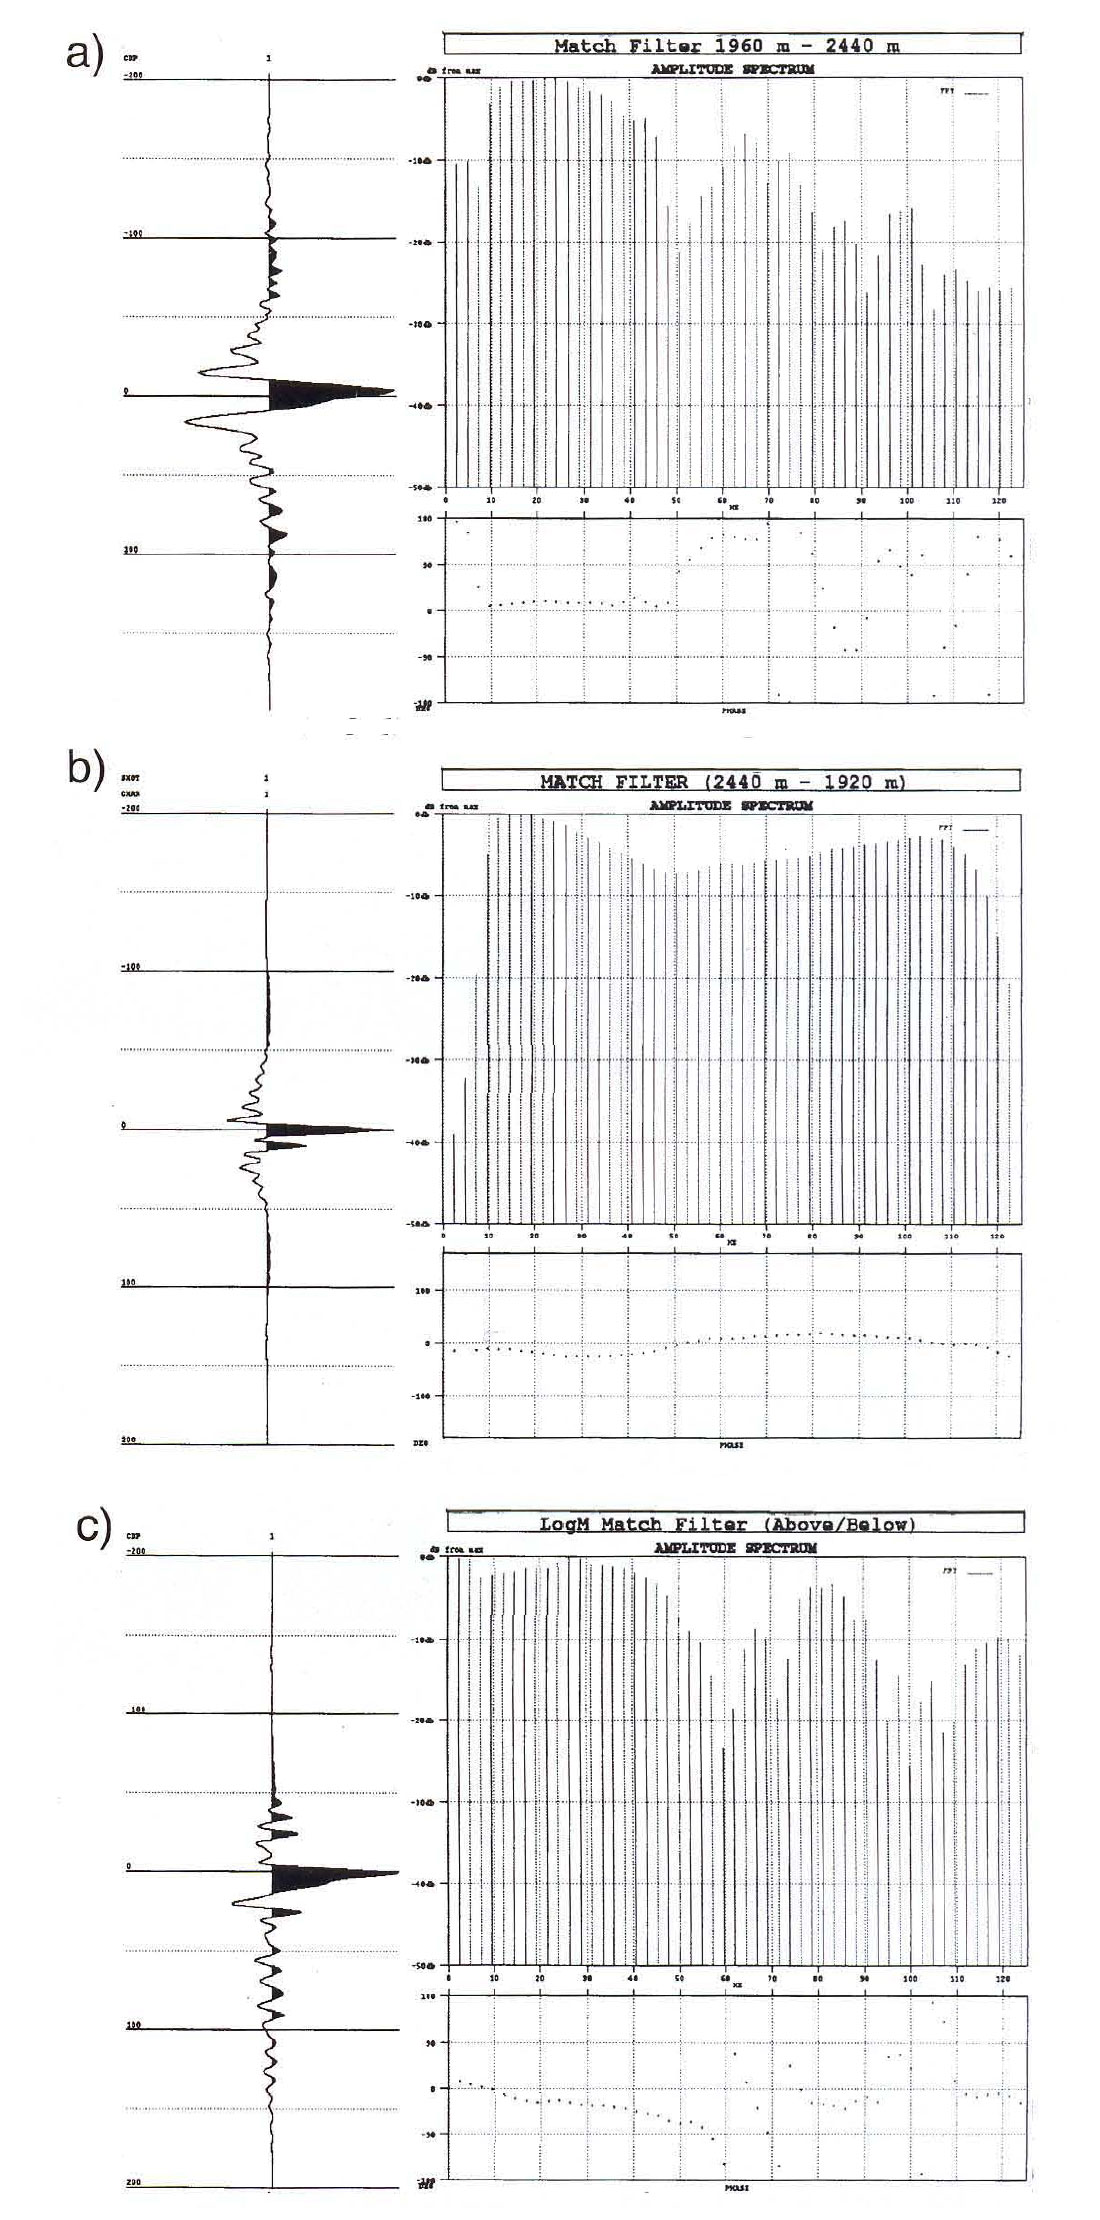
By match filtering the waveforms measured below the coals to those above, the representative transmission filter for the real VSP and modeled data can be created. These filters are displayed in Figure 13. They all show a notch forming at 50-60 Hz though the exact magnitudes and positions are not identical to the theory.
Acquisition and processing considerations
We now have an explanation for why it is hard to record broadband data in the Devonian in the Simonette area. The coals act as a transmission filter and create a notch in the data between 50 and 65 Hz. If the data above the coals do not contain energy above 65 Hz, it is difficult to identify the notch and thus the data below the coals appear bandlimited. We have shown that the transmitted signal is attenuated by the coals, so extra effort (high fold, for example) must be made to record broadband data from below the coals.
Another consideration is the deconvolution process. Previous to his analysis (at Chevron Canada Resources), character anomalies in the Devonian that coincided with changes in the coals were deemed risky because of exploration failures. We have shown that the coals create a nonstationary wavelet in our data because they act as a minimum phase transmission filter. It is not surprising that changes in the coals can create character anomalies if only single gate deconvolution is used.
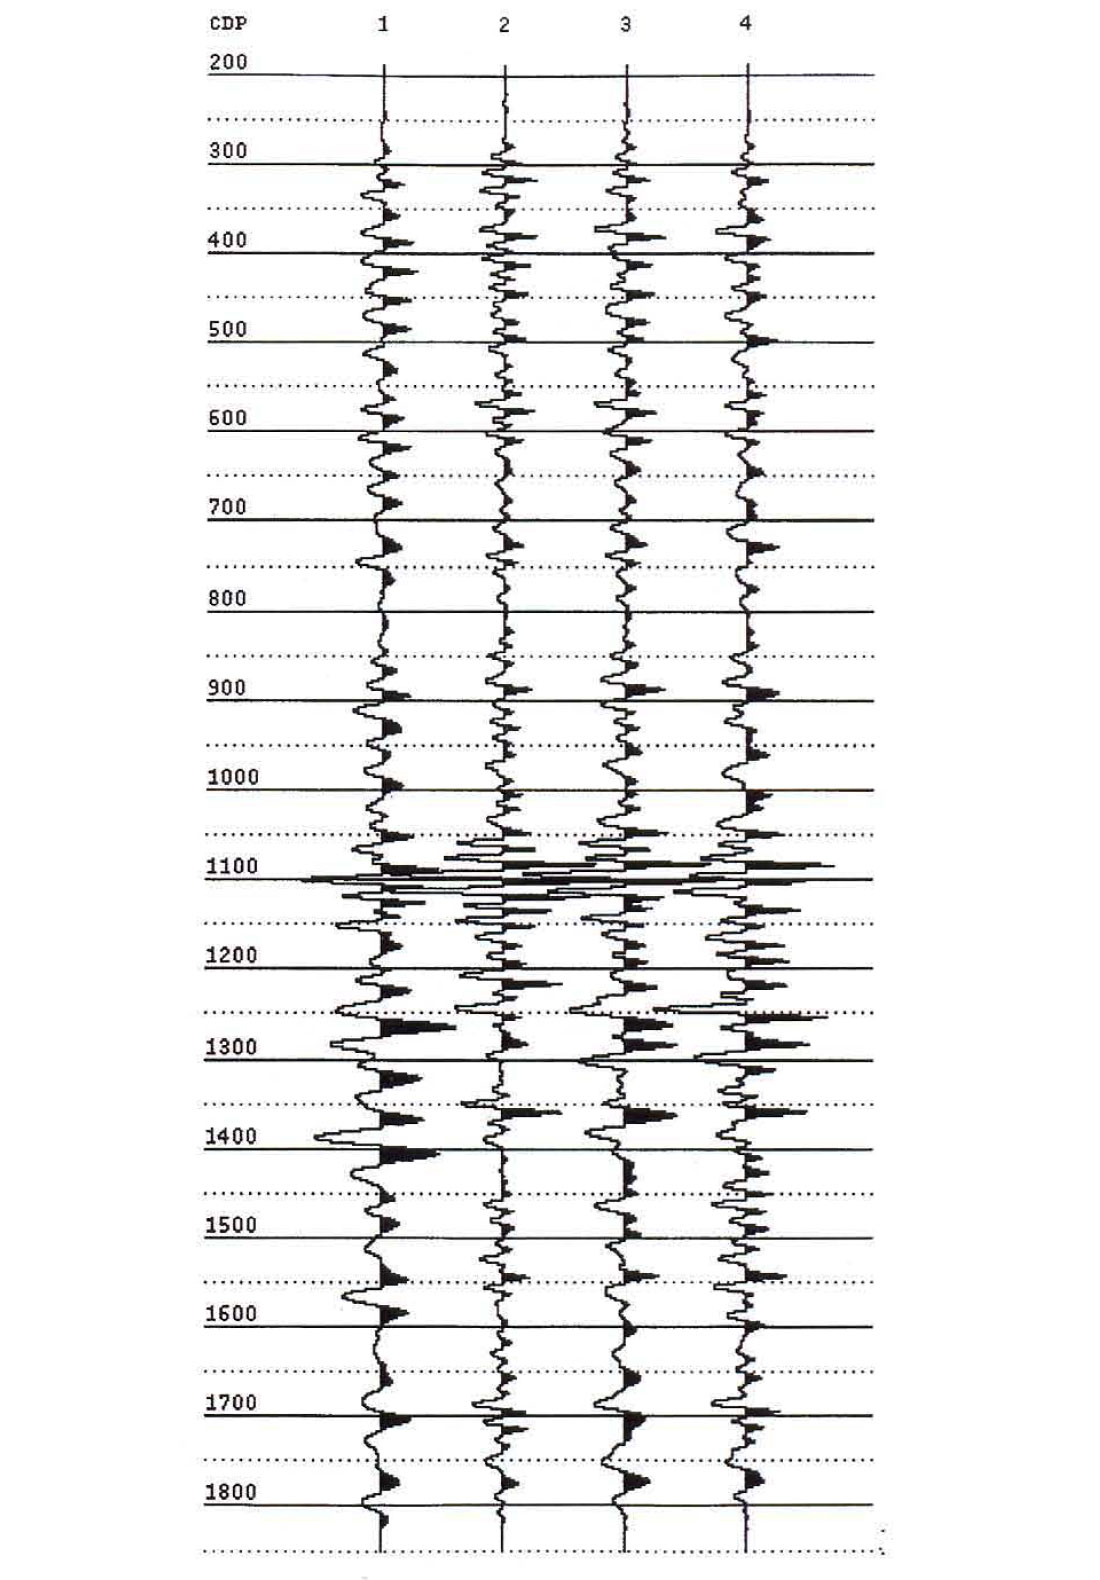
Figure 14 demonstrates the effect (on synthetic data) of nonstationarity on the choice of deconvolution, Trace 1 is the RC series from the study well convolved with a minimum phase version of the time varying wavelet measured in the VSP. It is the input trace. Trace 2 (the zero phase bandlimited RC series) is our desired output. The results of a single gate deconvolution and a zero phase bandpass filter applied to trace 1 are shown on trace 3. Note that below the coals (at 1100 ms), the output does not look much like our desired output. It is of visibly lower frequency and is phase rotated. Trace 4 is the result of a two gate deconvolution, followed by a zero phase bandpass filter where the design gates are above and below the coals, respectively. Trace 4 better matches our desired output (trace 2).
On surface seismic data, single gate deconvolution whitens the entire spectrum and, as a result, does not correctly remove the effect of the coals. Two gate deconvolution (with the design gates above and below the coals) removes the transmission filter caused by the coals and gives the interpreter increased confidence in the character integrity of the data. Our standard processing flow for data from Simonette includes two passes of deconvolution. The first is one gate surface consistent deconvolution (to estimate and remove the source and geophone wavelets, both of which are stationary). Poststack (because of increased SIN), we apply a two gate spiking deconvolution as a residual deconvolution.
Conclusion
We have shown that the Mannville coals act as transmission filters that affect our surface seismic data. They place a notch at 50 - 70 Hz in the spectra of data recorded below the coals, which limits the bandwidth and adds phase distortions. The transmission filter has been measured on a VSP, modeled by two different methods, and confirmed by theoretical considerations.
This analysis has caused Chevron Canada Resources to change its acquisition parameters by increasing the fold in an attempt to record data with broader spectra and thus higher resolution in the Devonian (below the coals). In addition, we have altered our processing flow to include a posts tack two-gate deconvolution to help remove the effects of the transmission filter caused by the coals.
Finally, because wavefields recorded by VSPs are easier to analyze and less subjective than those of surface data, the former allow us to identify the effect of the coals. Perhaps VSPs should be recorded more frequently in the continuing effort to improve surface data.

Acknowledgements
We would like to thank Chevron Canada Resources for allowing us to publish this paper. We also thank C. Frasier, H. Martin and N. Ross for insightful criticism.
Craig Coulombe received bachelor's (1990) and master's (1992) degrees in geophysics from The University of Calgary. He consulted for Schlumberger's Seismic Product Development group from 1990-92 before joining Chevron Canada Resources. Craig is a member of the SEG, CSEG and APEGGA.
D. Neil Bird received a master's degree in geophysics from the University of British Columbia (1981). He had been an interpreting geophysicist with Chevron Canada since graduation with the exception of two years at Chevron's research facility in La Habra, California. Neil Bird is presently with Woodrising Consulting Inc., 132 Main Street, Erin, Ontario.
This article was first published in the September 1996, Vol. 15 issue of The Leading Edge and is re-printed here with permission from the authors, The Leading Edge and the SEG.


Join the Conversation
Interested in starting, or contributing to a conversation about an article or issue of the RECORDER? Join our CSEG LinkedIn Group.
Share This Article