Conventional vertical seismic profiles (VSPs) are recorded by lowering receivers, usually geophones but increasingly accelerometers, contained within shuttles down a well where they are anchored to the borehole wall using clamps or bowsprings. A seismic source (often located adjacent to the well-head, i.e. at zero-offset) is then activated and data recorded from the receivers. As the receivers typically span only a limited range of depths they then need to be unclamped from the borehole, repositioned to cover a different depth range, and data from the same source point acquired. This process is then repeated until the total depth range of interest, at the required receiver spacing, has been acquired. If multiple source points are required then this process needs to be repeated for each point.
Such surveys can be very time consuming and therefore expensive, particularly off-shore where the majority of the cost of the survey is rig-time. The acquisition time also compares very poorly to other logging runs, and often the VSP component of a job will be cancelled to save time. The obvious way to improve the efficiency of VSP surveys is to increase the number of receivers being used. The systems typically employed, however, have a maximum number of receivers of between 40 and 100. Even for a 100 receiver system this equates to a depth range of ~2,500 feet (assuming a 25 foot interval) still insufficient to cover the total depth of most wells. The time taken to rig-up such large systems, and the cost involved in purchasing them, means that much smaller systems are typically used, particularly on land where arrays of just four shuttles are standard.
In this paper we describe how the efficiency of VSP surveys can be improved drastically through the use of fiber-optic recording. We begin by describing distributed vibration sensing (DVS), also known as distributed acoustic sensing (DAS) before describing a typical DVS recording system. We the show some recent survey results before discussing the implications of this new technology.
Distributed Vibration Sensing
An optical fiber is created by melting a preformed rod of glass and drawing it into a long, thin strand containing the desired structure, namely a core surrounded by a cladding of slightly lower refractive index. The refractive index contrast traps the light allowing it to be guided with low loss over considerable distances. The drawing process introduces microscopic fluctuations in the refractive index of the glass. These fluctuations scatter light in all directions (Rayleigh scattering) but only a small fraction (~0.25% for typical single-mode fibers) of the angles result in the light being guided back up the cable (Figure 1).
Distributed vibration sensing (DVS) systems (also known as distributed acoustic sensing or DAS) employ the principle of optical time-domain reflectometry (OTDR), this involves launching successive pulses of light into a fiber and monitoring the backscattered signal. The backscattered signal is the accumulation of the scattered light from all of the scatterers falling within the section of fiber occupied by the probe pulse. If the probe has a broad spectrum, then the contributions to scattered light from the different locations within the pulse are randomly related in phase and their energy can be summed. However, if the transmitted pulse has a narrow spectrum (bandwidth of order the inverse pulse duration or less) then the light scattered from within the section of the fiber occupied by the pulse at a given time is coherent, this results in a stable, but random, phase relationship between the contributions to the scattering signal. Specifically, the electric field contributions from each scatterer are summed at the detector and thus the phase relationship between the elemental scattered light contributions is critical. In some areas the scatterers are largely in phase resulting in a strong electric field, in others, with a broad distribution of phases, the electric fields of the scatterers may almost cancel.
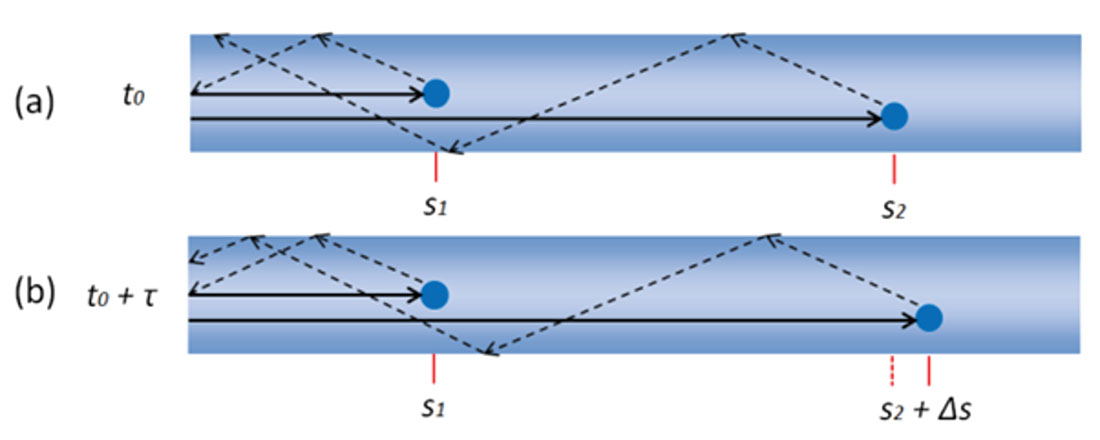
When the cable is at rest (Figure 1a) the distance between scatterers is constant and therefore the backscattered signal is also constant. If a seismic wave disturbs the cable then the distance between the scatterers changes (Δs, Figure 1b). This change in distance results in both amplitude and phase variations in the backscattered signal from the second scatterer. Of course the fiber has a very high density of scatterers so identification of the contribution from individual scatterers is not possible and the response is far more complex than in the case of a two-scatterer model (Liokumovich et al., 2015).
If a section of the fiber is disturbed then the phase of the backscatter at the disturbance will be altered in an unpredictable manner but the phase of all the subsequent sections will be altered linearly with respect to strain. The amplitude of the backscatter will also change but the response is highly nonlinear and thus ill-suited to seismic applications (Hartog et al., 2013). There is, however, an approximately linear relationship between the difference in phase between two sections of the fiber and the strain between these two sections and this is what we wish to measure.
The signal recorded using DVS systems is best described as being the strain experienced along the fiber after the application of a moving average filter whose length is equal to the physical distance between the two points (the gauge length) at which phase is being measured (s2 and s1 in Figure 1). DVS systems are most sensitive to P-Waves travelling along the fiber, with the amplitude decreasing as cos2 of the angle of incidence (Kuvshinov, 2015) as well as varying with wavenumber (Dean et al., 2015). Their angular sensitivity can be improved through the employment of specially wound cables but fortunately for most VSPs the source is essentially placed at the end of the fiber and thus these are not required.
Recording System
The major advantage of DVS systems in terms of efficiency is their ability to record strain measurements at thousands of positions along the fiber simultaneously. The surface components required to do so are relatively light-weight enabling it to be easily mounted within a standard logging truck or placed within another vehicle or building. The system shown in Figure 2a is housed within two packing cases. The upper case houses the optics module which contains the laser, receivers etc., whilst the lower houses a patch panel, a PC for QC and source control software and a processing server.
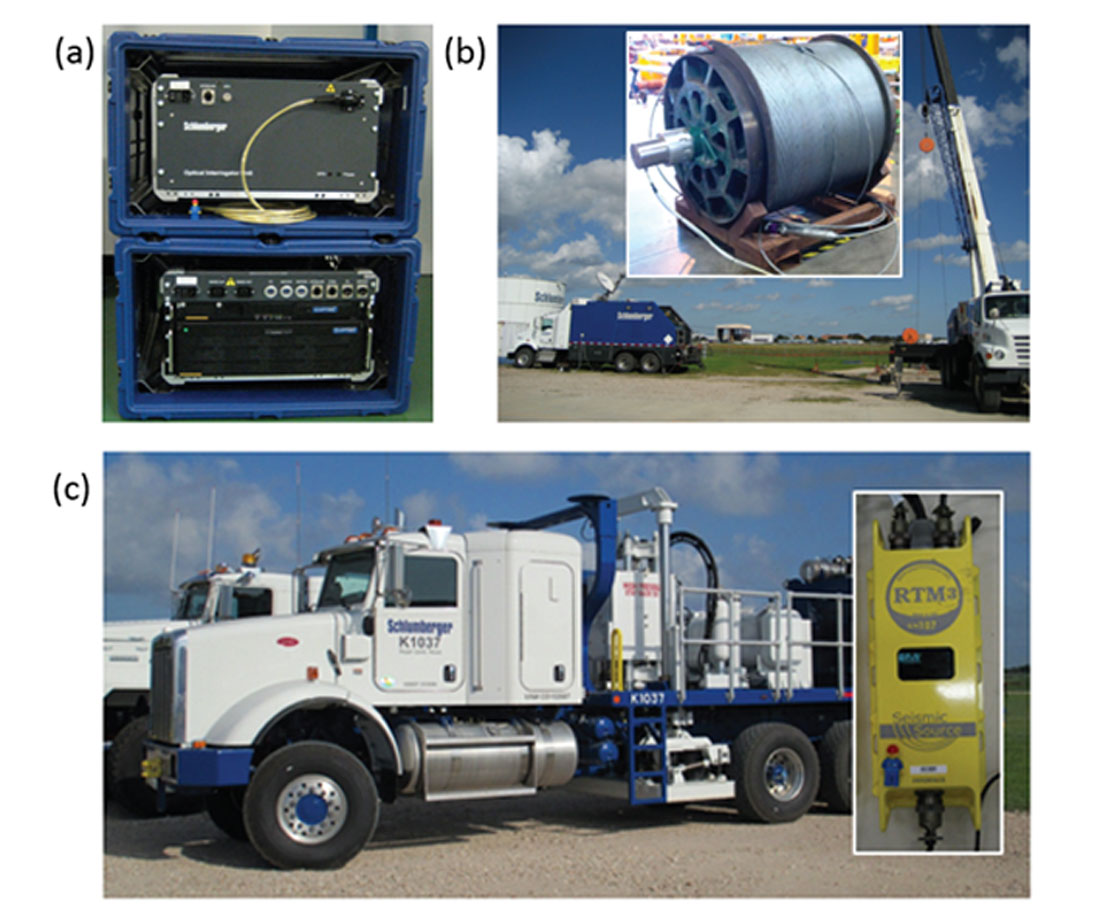
If the well has a fiber permanently installed within it (e.g. for distributed temperature sensing) then data can be recorded using it. If not, then a modified heptacable, a steel-armored, multi-conductor, wireline cable that incorporates single-mode optical fibers can be used (Figure 2b). The advantage of the heptacable is that it can be used with other logging tools attached, enabling the VSP to be acquired simultaneously with other logging runs.
The sources used for VSP surveys span the full range of options, including both impulsive and non-impulsive sources, often consisting of what is locally available. The activation of some sources can be triggered by the recording system (recorder-driven), whereas others, with variable activation times, most prominently weight drops, need to trigger the recording system (source-driven). To maximize efficiency a recording system must support all possible sources and controllers. The system also must not require the often significantly time-consuming determination of the radio delay between the encoder (the source control unit attached to the recording system) and the decoder (the source control unit attached to the source).
To achieve this we incorporate a GPS time-based external encoder and decoder (inset in Figure 2c). The decoder is placed within the source and connects to any standard source controller. In recorder-driven mode the recording system passes an aim-point (the time at which the source should be activated) to the encoder unit which is then transmitted over a radio to the decoder. At the aim-point time the source’s controller is triggered, and QC data are recorded and transmitted back to the encoder. By incorporating a delay within the aim point time sufficient to cover the radio and communication delays, we do not need to spend time synchronizing the units.
In source-driven mode the recording system is continuously recording data into a buffer. When the decoder receives a trigger from the source’s controller it sends the GPS time at which the trigger occurred over the radio to the encoder and thus to the recording system. On receipt of this time the recording system creates a record containing the appropriate time period.
Example Results
The first example included here was acquired in a near-vertical well with a maximum depth of 7,500 ft located in Rosharon, Texas. The well was water filled, the worst-case scenario given the improvement in data quality associated with borehole fluid viscosity found in hydrophone surveys (Greenwood et al., 2012). The well was also vertical, which minimized the sections where the fiber could be in contact with the casing. Figure 3 shows the results from the DVS survey where the vibrator was located at a distance of just over 3,000 ft; the data quality compares well with that from the conventional tool, and first-break picking is easily accomplished. The resulting match between the two time/depth profiles (Figure 3) is excellent. In this case, the six settings of the 16-level tool took 90 minutes to acquire with a single sweep/ position, excluding the time taken to run in and out of hole. In contrast, the DVS data took just 7 minutes to acquire (if a typical four-level tool had been used then the acquisition time would have been over 12 hours). The DVS data consist of approximately 1,700 levels covering the full extent of the well, whereas the conventional data consist of 96 levels covering 32% of the total depth.
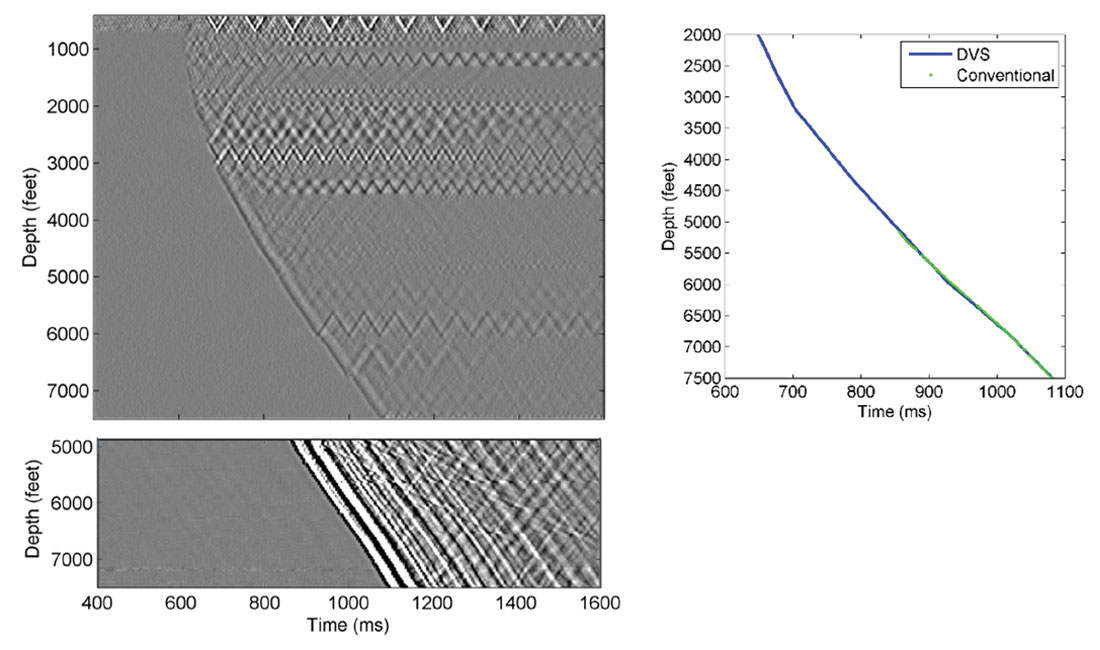
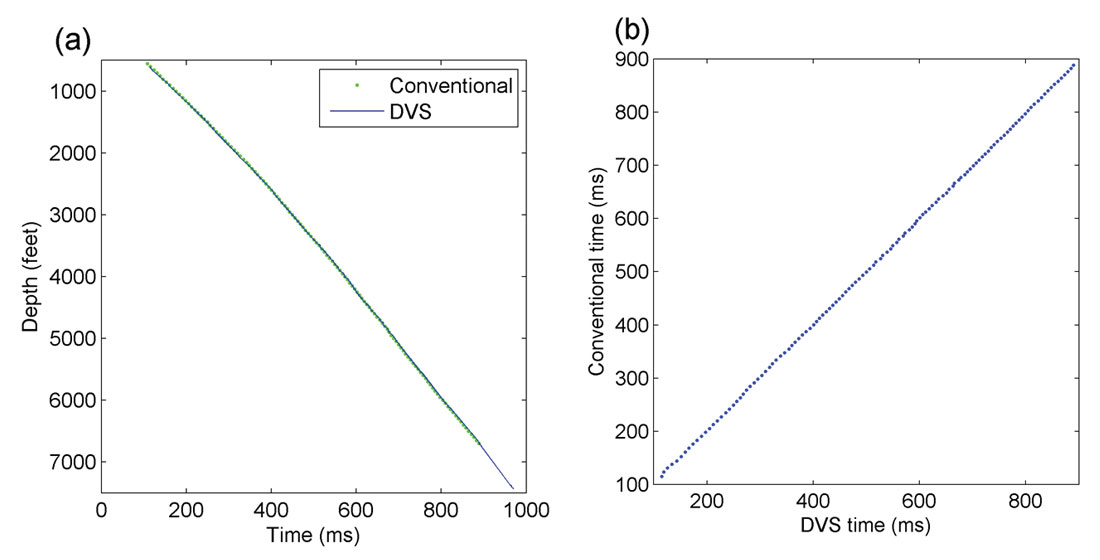
Figure 4a shows zero-offset time/depth profiles recorded using both the conventional and DVS systems. The DVS data (a median stack of 28 records) were acquired using an accelerated weight drop. The match between the two sets of results is excellent, as confirmed by the crossplot (Figure 4b), with the average difference between the two sets of results being less than 2 ms.
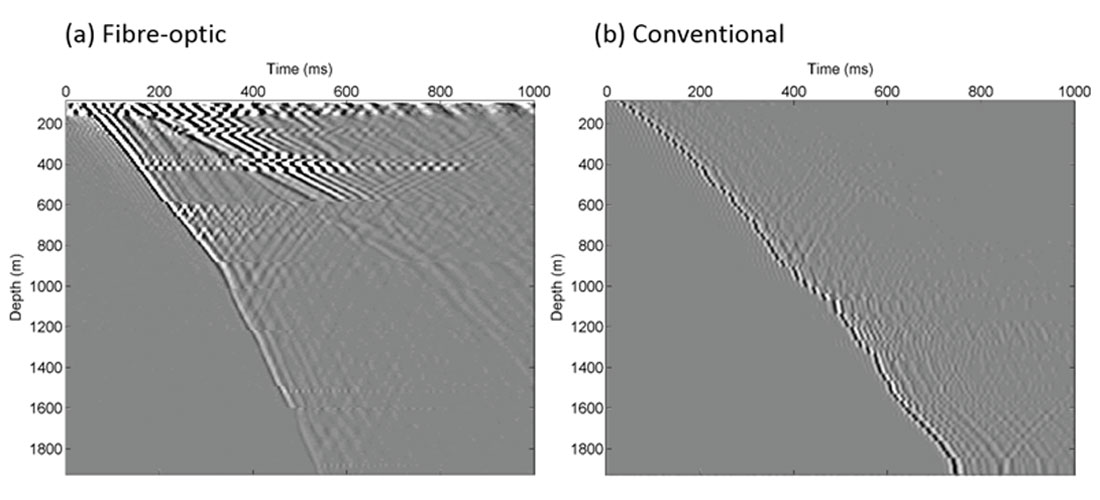
The second example shown here was acquired as part of a walkabove survey over a deviated well. Two conventional borehole sensors were connected to a hybrid heptacable and eight source positions occupied. Data was recorded using the full length of the cable, i.e. from the top of the shallowest sensor to the surface, but for simplicity, only a section of the cable for each source position is shown here. A single 48000 lb vibrator was used as the source sweeping a 12 second, 6 to 96 Hz linear sweep. Five sweeps were acquired at each source position. As seen from Figure 5 the data quality was excellent with the first breaks and multiple reflections clearly visible. The benefits of the much higher spatial sampling of the fiber-optic data are clear when you compare it to the much sparser conventional data; with reflections being far easier to identify.
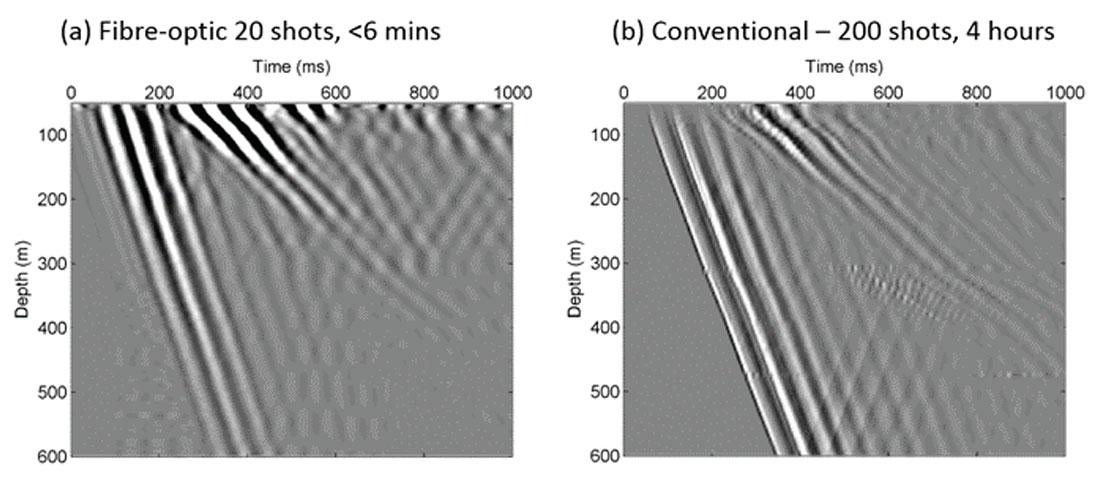
The third example is from a survey acquired in Belgium with a portable airtank gun source (Clark and Mackie, 2013). Data acquired using a conventional, two-shuttle, tool required 200 shots over 4 hours. Data acquired using the fiber-optic system required just 20 shots over less than 6 minutes a saving of 97.5%! The data acquired using the conventional system is better quality but the fiber-optic data is perfectly acceptable for generating a velocity profile (Figure 6).
Discussion and Conclusions
The value of VSP data, both on its own and integrated with surface seismic data, is indisputable, but unfortunately the high cost of VSP acquisition often prevents such data from being acquired. The use of fiber-optic VSP recording systems promises, however, to radically change this situation. The use of such systems, as described here, results in the time required to acquire a simple VSP survey being reduced from hours to minutes. If the data are acquired as part of a conventional logging job then the acquisition does not require any additional well or rig-up time.
The results shown here demonstrate that the results acquired with such a system are consistent with conventional VSP tools, even in suboptimal coupling conditions (a water-filled vertical hole). Generally, the data acquired is suitable for establishing a time-depth relationship but under good conditions (deviated wells, high viscosity muds) the results can be used to generate corridor stacks or even 2D or 3D images.
Generally, changes in acquisition equipment are gradual, witness the steady increase in channel counts for surface systems averaging a factor of 10 every 15 to 20 years (Figure 1, Lansley 2013). The use of fiber-optic VSP acquisition systems, however, constitutes a revolution, channel counts increasing from tens to tens of thousands, resulting in a dramatic reduction in acquisition times and increase in spatial sampling.

Acknowledgements
The authors thank all the colleagues within the Schlumberger Fibre Optic Technology Centre that have assisted in the development of the system; Schlumberger USA-Land Special Services for providing the borehole seismic equipment used in the Rosharon tests; United Service Alliance for the loan of the weight drop and John Giles, Murali Shanmugam, and Kyle Benton for helping with the source control system. We also thank Lundin Petroleum and Niras for permission to show their data.


Join the Conversation
Interested in starting, or contributing to a conversation about an article or issue of the RECORDER? Join our CSEG LinkedIn Group.
Share This Article