In October 2008, Vector acquired and processed an experimental 2D seismic line in Mountrail and Ward Counties ND. In recent years, several operators have been successful drilling long-lateral horizontal wells in the Middle Bakken using surface seismic only loosely for approximate structural control. The efficacy of conventional surface seismic data has largely been discounted for identifying stratigraphic sweet spots in the fracture reservoirs of the Middle Bakken Formation. The seismic signature needed for delineation of Middle Bakken fracture reservoirs was beyond the resolution limits of conventional surface seismic data. Furthermore, differentiation between prolific production in the Parshall Field and the Sanish Field to the west and a dry hole was difficult. As a result, little stratigraphic quality seismic has been recorded and very few wells have been drilled with logs that allow correlation of the seismic signature with production since the discovery of Parshall Field The Behm Edwards 1-33BH in NW NW S33 T154N R 88W, a dry Middle Bakken test drilled in February 2008, provided the opportunity to create a cross-township view from the Behm well through productive wells in both fields. Furthermore, lack of logged well control and the engineering focus on the Bakken alone may have resulted in bypassed and missed pay in shallower horizons within both fields. The Parshall-Sanish Test Line, about 27 miles long was recorded and processed to image the transition between the dry hole on the east, the Middle Bakken production in the center of the profile and prolific production in the Sanish facies on the west.
The Bakken Petroleum System consists of a brittle dolomitic siltstone sandwiched between two excellent, kerogen-rich marine shales. TOC in the Bakken shales can range from 16-25%.
An extremely slow deposition and subsidence history during the early Mississippian and an anomalously high thermal maturation gradient has resulted in a unique system where much of the oil in the Bakken Formation is self-sourced, in-place and trapped in natural fractures in the Middle Bakken. Recent official estimates from the USGS place as much as 4.3 billion barrels of recoverable oil plus 1.8 trillion cubic feet of natural gas in the Middle Bakken alone. Leigh Price, a prominent geochemist with the US Geological Survey in 1999 estimated reserves as high as 500 billion barrels from the Middle Bakken.
The Middle Bakken matrix in the fields is a very tight dolomitic siltstone and must rely on fractures to support economic accumulations of oil. Two mechanisms are responsible for the creation of natural fractures in the Bakken: Tectonic fracturing caused by lateral stress (wrench faulting) has created substantial localized vertical fracture complexes in the Middle Bakken. While generally difficult to see on surface seismic images, these can be mapped in a gross way using satellite imagery and tonal and landform lineaments. Examples of these are well known regional lineaments such as the Nesson Anticline, Wild Rose Lineament, Antelope Field, the Brocton-Froid Lineament, and a pair of NE trending lineaments bounding the core of Parshall Field. The only expected seismic expression of these features is subtle flexures or thickness variations across the faults. As most of the displacement is lateral, vertical expressions require very high resolution seismic to identify. The second fracture mechanism, and likely more prevalent is the dramatic super-lithostatic pressure increase due to chemical conversion of the in-situ kerogen into oil. This mechanism is extensively analyzed by Price (1999), LeFevre and Meissner, among others. Kerogen in the worldclass marine shales comprising the upper and lower Bakken Formation have densities on the order of 1.40 g/cc, whereas the oil resulting from high thermal gradient of the kerogen is about 0.82 g/cc. (Price, 1999). The resultant ~70% volumetric increase provides huge potential energy for creation of horizontal and vertical fracture swarms in the brittle Middle Bakken.
The implications for imaging gross porosity anomalies in the Middle Bakken with seismic then are:
- Vertical fractures will likely be invisible to surface seismic. However, attributes such as azimuthal anisotropy may be useful in inferring fracture presence and orientation. Small errors in predicted seismic interval velocities will provide some indirect evidence of vertical fractures.
- Horizontal hydraulic fractures should be evident in subtle variations in frequency, velocity and waveform. The degree of abnormality clearly depends upon seismic resolution – both from the standpoint of acquisition parameters and processing methods. Therefore, there is a need for high-resolution, fine temporal and spatial sampling and very close velocity control. There is also a requirement for high signal-tonoise ratio.
The current state-of-the art was sufficient for most structural mapping objectives, but inadequate for stratigraphic imaging. Thus, Vector Seismic proposed radically different acquisition and processing methodologies based on the expected changes in reservoir physics to improve the seismic image and provide direct evidence of Middle Bakken fracture reservoirs.
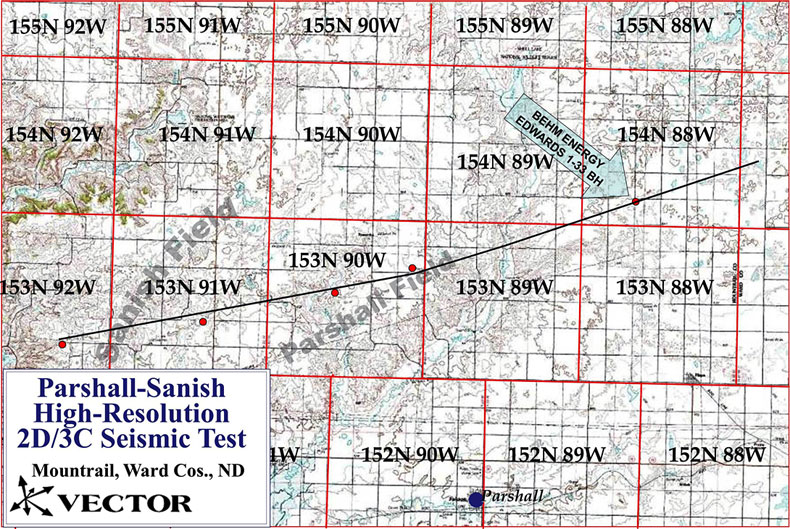
To this end, a dual-source, 3-component, high-resolution 2D seismic line was recorded in TWP 152-153N, RGE 87-92W, in Mountrail and Ward Counties, ND. The line, shown on the map below, was located to tie the Behm Energy Edwards 1-33BH well near the east end and track across the bulk of Parshall and Sanish Oil Fields to the west. Dozens of wells are proximal to the line, including some very prolific discoveries made after the recording of the production line, but most notably:
- Behm Energy Edwards 1-33BH NW NW S33 T154N R88W (Dry)
- EOG Wayzetta 6-12H S SE S12 T153N R90W
- EOG Wayzetta 4-16H NW SE S16 T153N R90W
- Whiting O&G Braaflat 11-11H NW NW S11 T153N R91W (IP 2669 BOPD)
- Three Forks1 Bartleson 44-1H SE SE S1 T152N R93W(IP 104BOPD, 96MCFG)
- EOG Herbert 1-26H SW SE S26 T153N R90W (IP 1267BOPD)
- Whiting O&G Liffrig 11-27H NW NW S27 T153N R91W (IP 2247BOPD, 1700MCFG)
- Fidelity E&P Annala 11-36H NW NW S36 T153N R92W (IP 1009BOPD)
The 2D line was extended east of the Behm Edwards 1-33BH well (dry hole) by approximately 5 miles in order to measure the seismic response in an area thought to be east of the productive extent of Parshall Field and to insure that a full spread and fold is available to tie this well.
The acquisition parameters used to meet the objectives above were Dualsource (Vibroseis and Dynamite), 3- component recording, 1-ms sample rate, point source, and point receiver.
Prior to the acquisition of the production profile, a comprehensive dual-source source test was conducted near the Behm well. Comparative tests were made with variable charge sizes, hole depths, and sweep parameters.
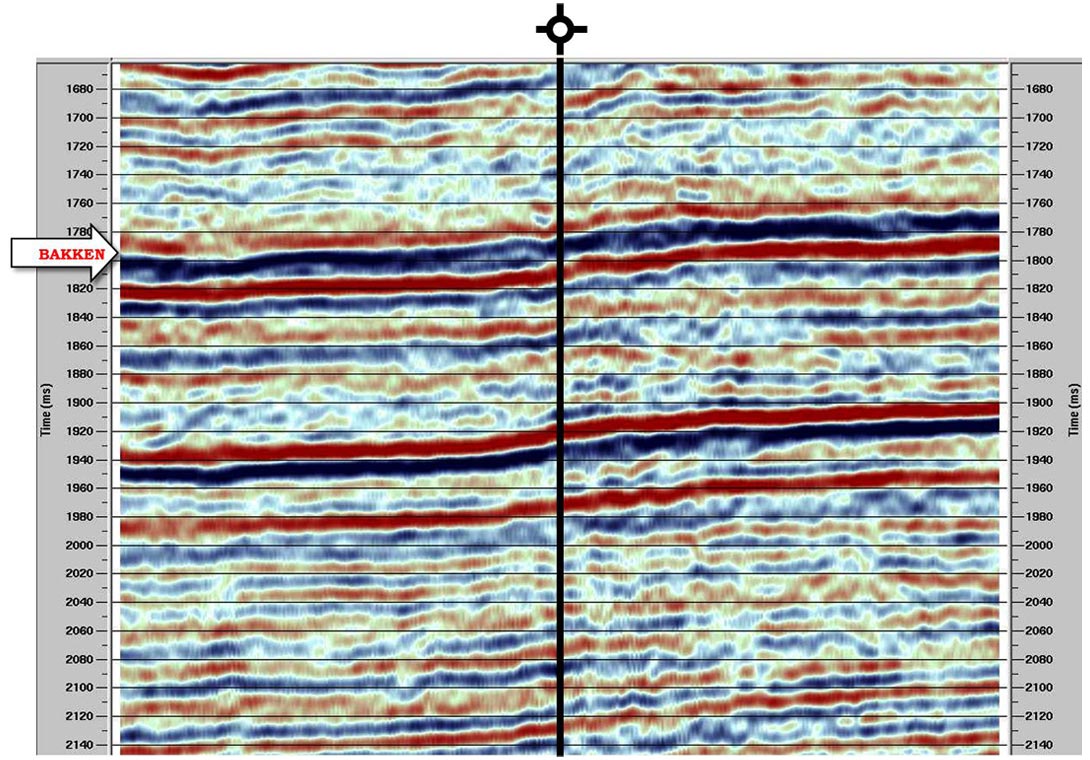
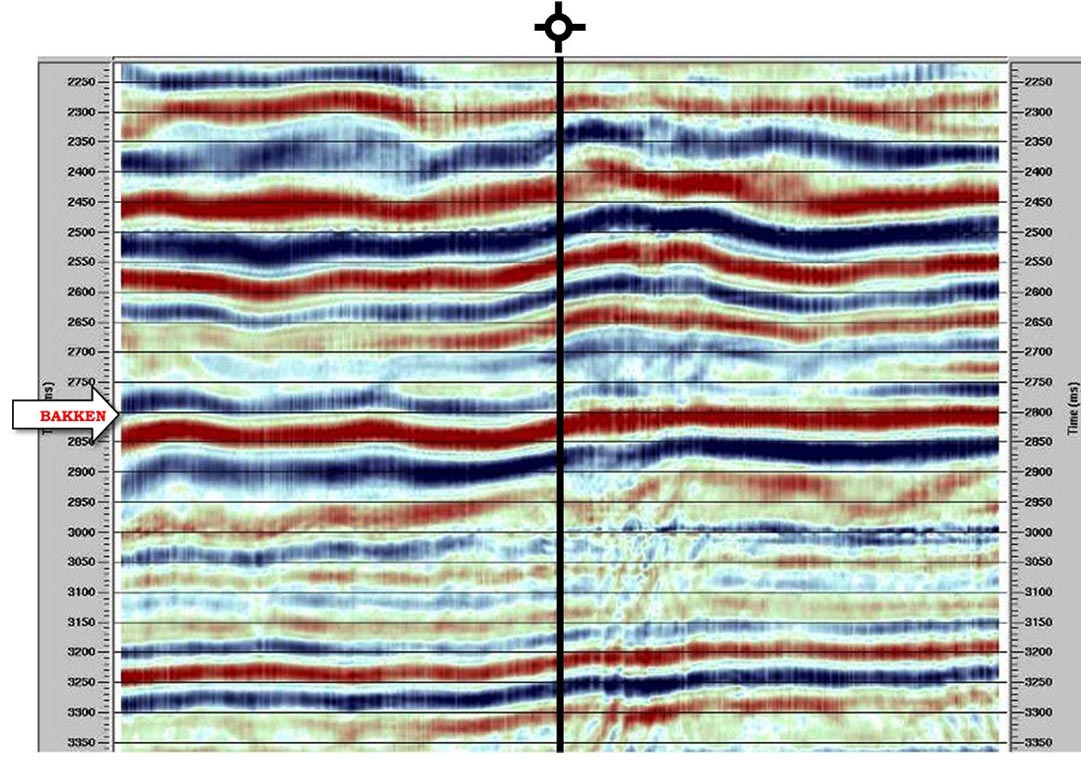
P-wave seismic profiles as seen in Figures 2 and 3 below show virtually no seismic character change between the image at the dry Behm Energy well and the producing wells in Parshall Field. However, converted wave processing and the subsequent common conversion point (CCP) stacks (seen in Figures 4 and 5) show a distinctive seismic character change in the vicinity of the fractured Middle Bakken.

The eastern edge of the Middle Bakken production has been popularly called the Bakken Thermal Maturity Boundary and is defined by the limit of selfinduced hydraulic fractures created by the conversion of Kerogen to oil. This boundary can be clearly seen on the converted-wave seismic data recorded on the Vector Parshall-Sanish Test line.
The imaging techniques used for the Parshall-Sanish Test line have important implications in many other resource and tight reservoir plays, including the Eagle Ford, Utica, Green Point, Macasty, Marcellus, Lodgepole and Exshaw to mention a few. Multi-component surface seismic, properly designed and planned, can be a valuable tool for reducing drilling risk in these areas.


Join the Conversation
Interested in starting, or contributing to a conversation about an article or issue of the RECORDER? Join our CSEG LinkedIn Group.
Share This Article