Introduction
Considerable attention has been directed toward seismic activity in the Crowsnest Pass area of southern Alberta on account of the calamitous Frank Slide in 1903 and numerous rockfalls on Turtle Mountain since then. The mountain is comprised of an unstable anticlinal structure (Jones, 1993; AGS, 2003) with a number of large fractures in evidence on its summit. The mountain’s tragic history, inherent instability, and nearby towns and infrastructure make it a candidate for detailed assessment (Read, 2003).
Turtle Mountain is currently the focus of a multi-disciplinary monitoring effort, incorporating several geotechnical and geophysical systems installed by a variety of groups. The primary goal of the educational monitoring system described in this paper is to detect microseismic events emanating from fracturing or deformation within the mountain.
Monitoring System
The surface microseismic monitoring system is one of two microseismic monitoring systems on the mountain (the other is a subsurface installation). The surface system consists of six remote seismic sensors and transmitters. The stations are in two-way radio (2.4GHz) communication with a control centre (data processing, visualization and archival facility) at the provincially operated Frank Slide Interpretive Centre (FSIC). The sensors are distributed in a pattern such that sources originating from likely zones of seismicity within the mountain are to be detected. Events eminating from inside the mountain may be associated with stress relief and could be landslide precursors. Regions targeted as likely candidates for generating microseismic events are near the South and Third Peak summits as well as on the mountain’s eastern flank on the trend of the historic (post-1903) coal mining operations (Bingham, 1996). Final decisions regarding locations were driven by these targeted regions, as well as the necessity for: visibility from the FSIC (for the radio link); good southern exposure (for maximum solar power generation); accessibility by foot in the summer and winter; and, the unlikelihood of being in rock or snow slide paths.
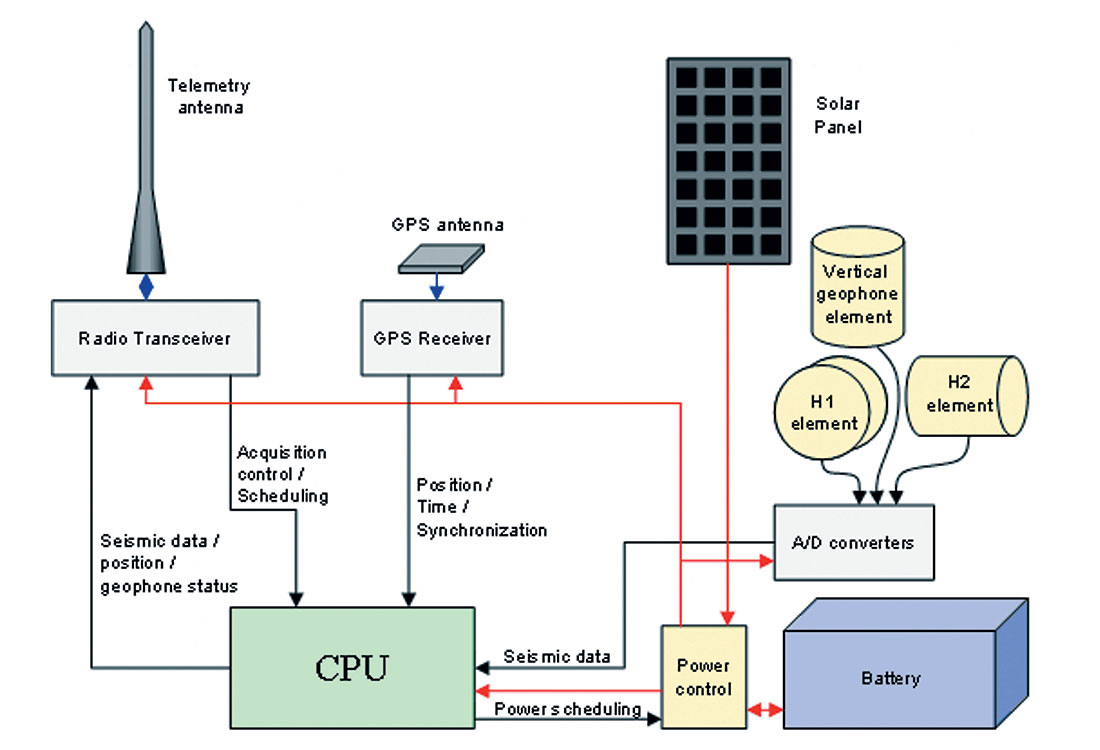
We are using three triaxial (or three-component) geophones connected in series as the motion sensing units. Prior to installing the system, we observed spectra of about 10-650Hz (with dominant energy in the 100-200Hz band) from hammer impacts transmitted through the Mississippian limestone in the near-surface at the Blairmore Quarry. Further, previous studies on Turtle Mountain report vibrational energy in the 10-100Hz range (Bingham, 1996). Thus, 28Hz geophones were set and cemented in outcrops (or the best facsimile thereof) some 10m from the recording equipment. The geophones were then encased in cement and connected via cable in a metal conduit to the data acquisition and pre - processing modules. Each station is also equipped with a GPS antenna for synchronizing the seismic data with recordings from the other stations. Batteries (12V, deep-cycle) and solar panels (100W) provide power to the radio, recording electronics, and the GPS. The components, and their connection to one another, are shown schematically in Figure 2. Photographs showing examples of installed stations are provided in Figure 3.
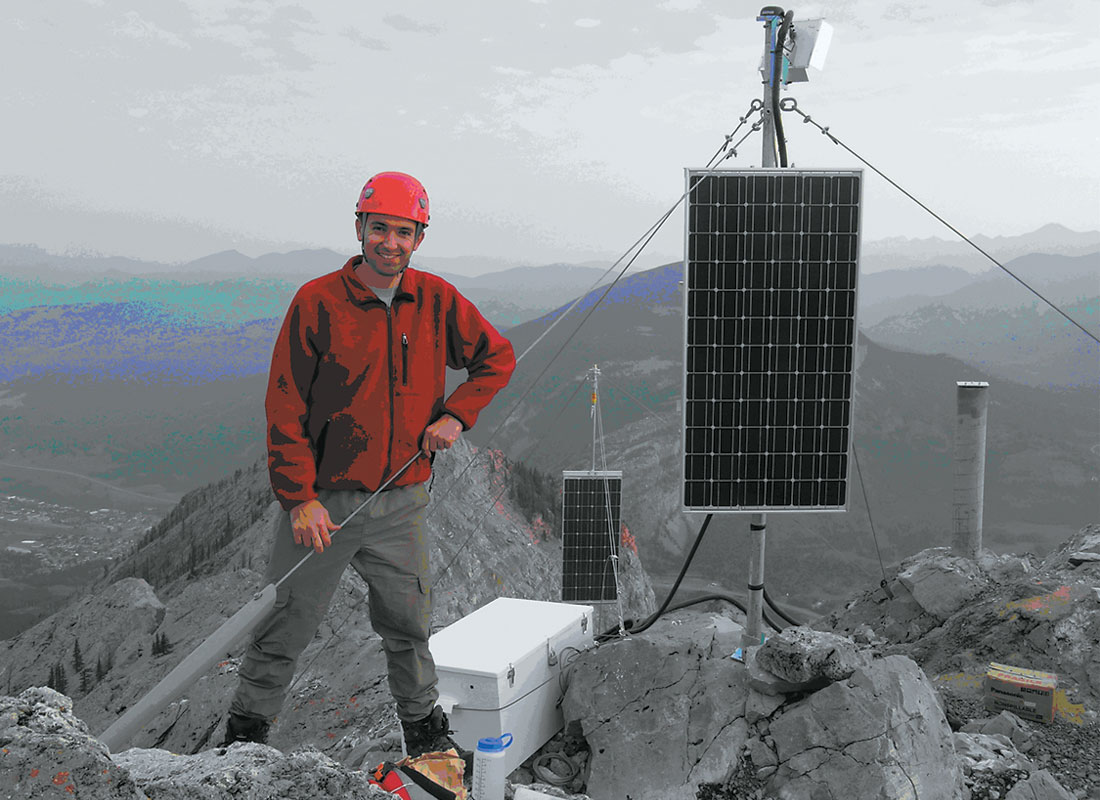
The Crowsnest Pass area features picturesque landscapes along with a fascinating, and periodically tragic and turbulent, history. It is a pleasure to visit both professionally and recreationally. Nevertheless, it is one of the windiest places in North America. During Chinooks, it is not uncommon for the weather station that sits just west of a ridge connecting Third and South Peaks to record speeds in excess of 150 km/h. This necessitated considerable effort designing the stations, in particular the solar panel mounting mechanism, so that they are not buffeted by strong gusts. We estimate that a gust of 180 km/h results in a force of nearly 200 kg on each of the four guy wires supporting the mast.
Installing the Mountain System
Installation began in late November of 2003. Because of the hazardous alpine winter conditions, we contracted Vertical Systems Inc. (VSI) of Canmore to assist us. This began with a mountain safety course which included instruction on clothing, industrial safety and regulations, logistics, emergency medicine, and a trip to Grotto Mountain to practice safe alpine travel habits and route finding skills. As well, during the helicopter-assisted installation trips, VSI helped with the long-line slinging operations and route finding (particularly important given the early snowfall and attendant avalanche hazard).
Bighorn Helicopters Ltd. from Cranbrook, B.C. transported equipment and personnel with an A-Star 350D. Generally, it was possible to lift and deposit the heavy equipment (batteries, vaults, masts, solar panels, and conduit) via long-line slings to within a few metres of all the stations. As well, all the stations were just a ten or fifteen minute scramble to actual helicopter landing sites, thereby minimizing access time for working logistics and in case of emergency.
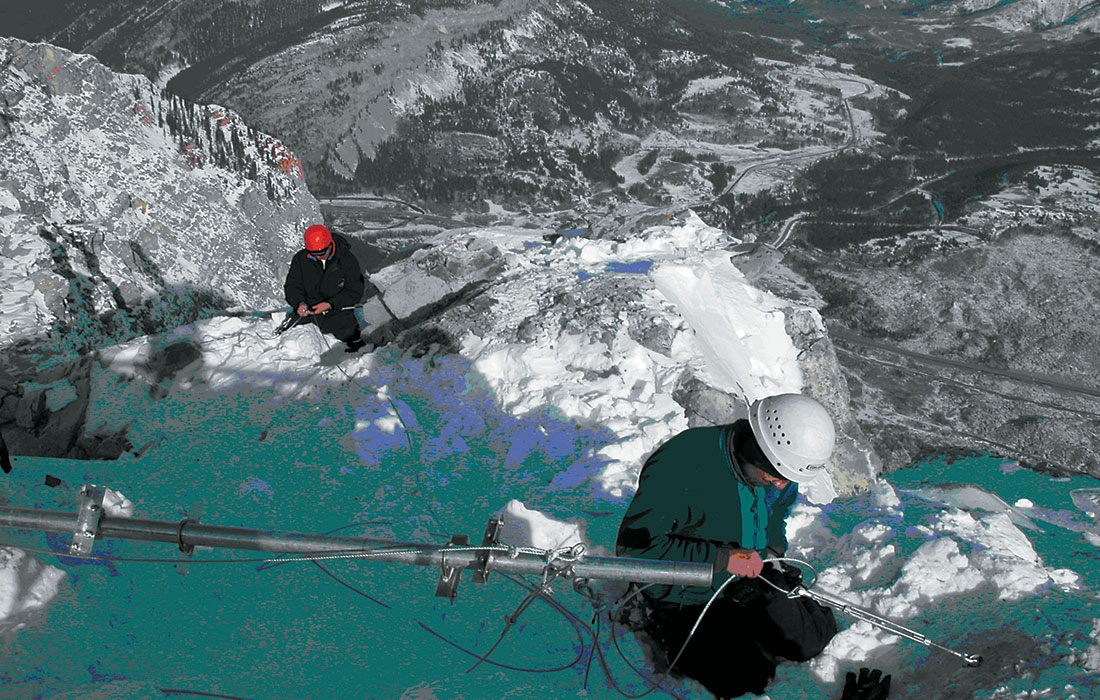
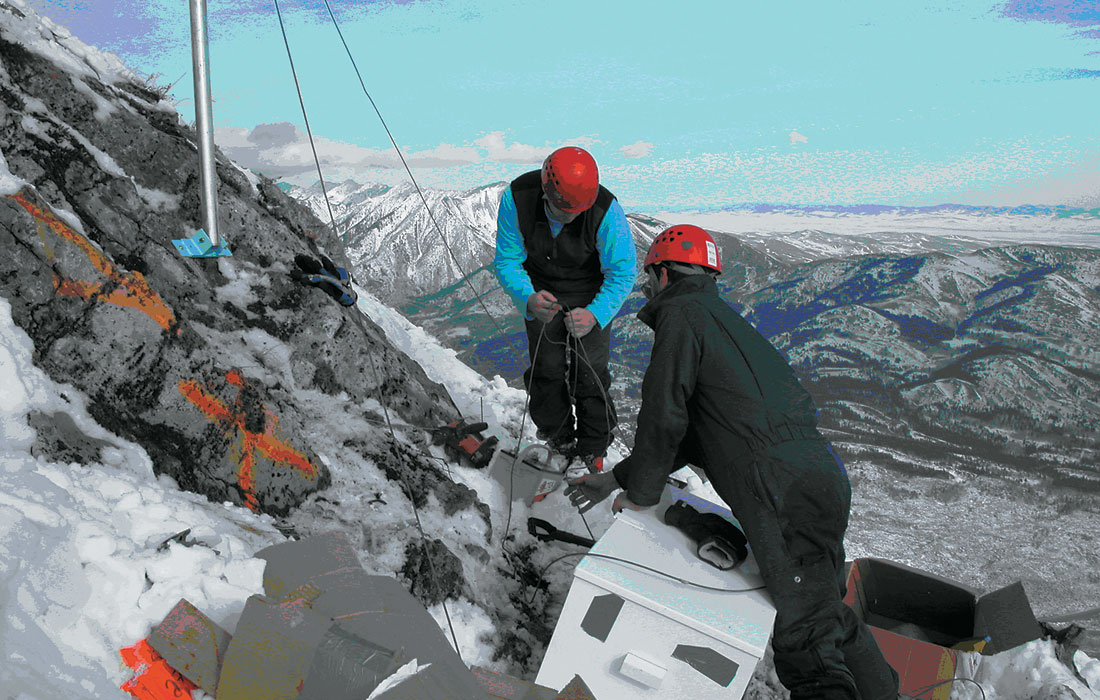
Installation started with drilling and emplacing rock bolts for guying the masts. Once the masts were erected, the battery vaults were secured and batteries deposited in them. Geophone conduit (with previously inserted geophone cable) was then deployed. The crown assemblies with GPS and radio antenna were attached to the top of the mast. Subsequently, the solar panels and electronics enclosures were also attached to the mast. Figure 4 shows photographs taken during installation of the two summit stations.
Station Tests
We tested a portion of the network using a trailer-mounted, accelerated seismic weight drop. This seismic source, generously supplied by Conquest Seismic Services Ltd. of Calgary, has a depth penetration of about 500m. One of the primary aims of this experiment was to evaluate whether the stations were capturing seismic events in the same fashion as an industry-standard seismic recorder. For comparison, a Geometrics R60, 24-bit recorder was connected to a string of three, 28Hz geophones (the same geophones as are used at each of the Turtle Mountain monitoring sites) near the mountain-monitoring geophones at the River Station as shown in Figure 5. For this test, a 1 Hz geophone was also connected to a spare channel on the permanent monitoring station at the River Station.
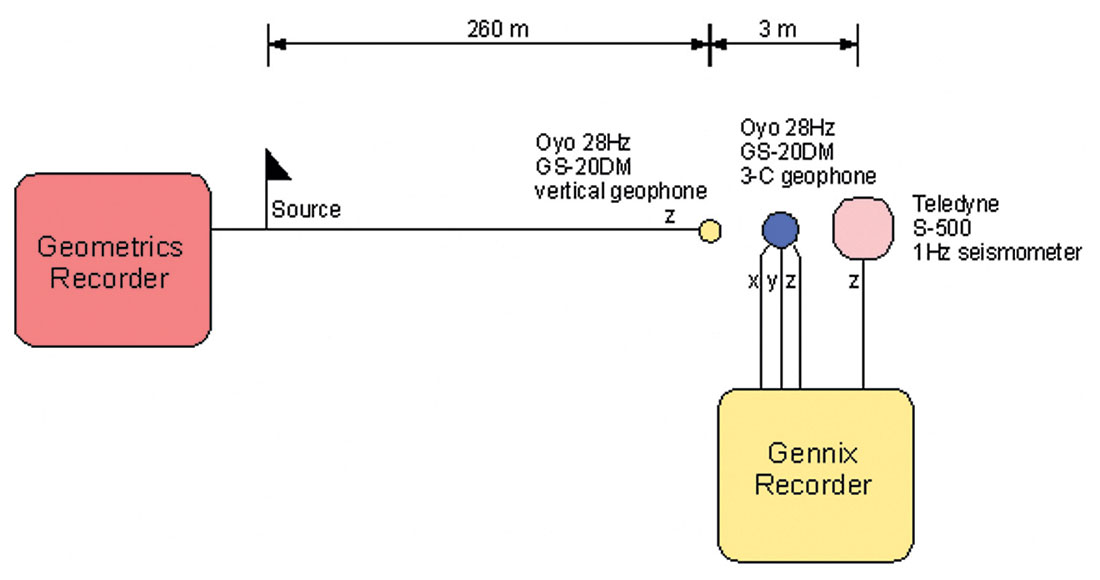
To match the times of the recordings on the permanently installed mountain system and on the Geometrics system, a GPS was connected to the auxiliary channel on the Geometrics recorder and a pulse-per-second (PPS) signal was recorded on each data shot gather. The on-mountain recorder inherently time-stamps all data (using GPS signals) before depositing it in the database at the control centre. Data were extracted in two-second intervals from the control centre database starting at the nearest second before each source event. The seismic source time-to-PPS time difference was picked on the Geometrics data and this static was applied to the mountain recorder times to shift the source time to zero milliseconds. The result is that both datasets exhibit seismic events at the same time. Multiple shots into the Geometrics geophone spread and mountain recorder are displayed in Figure 6. All recordings were filtered with a 8-12- 100-130 Hz bandpass filter prior to display.
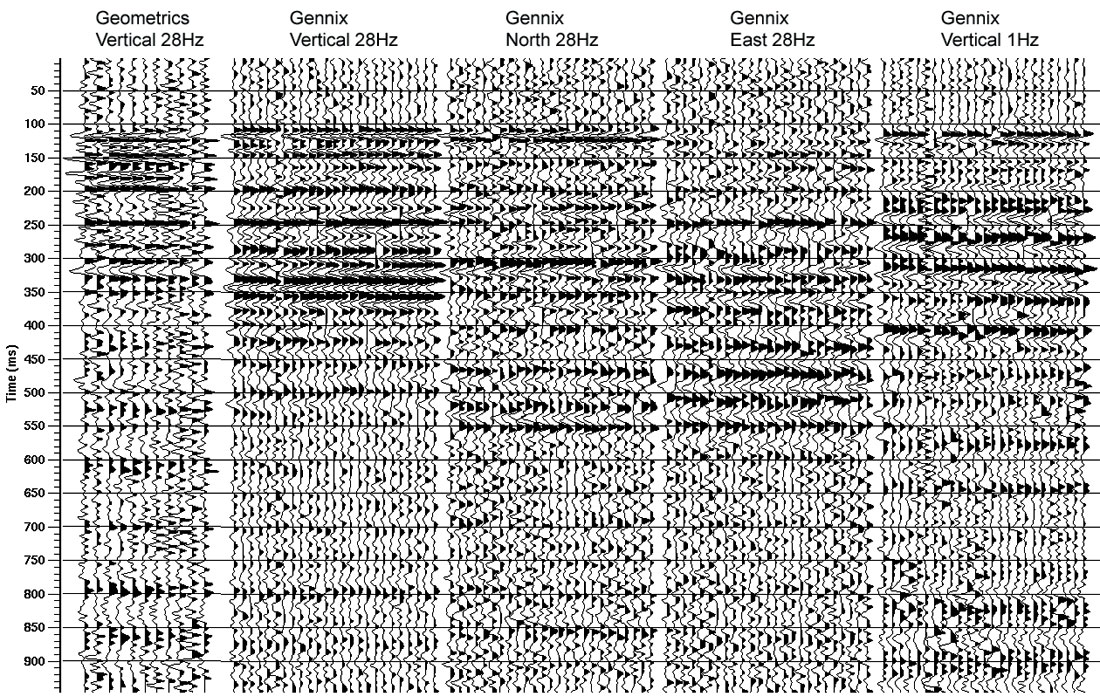
We can make some important observations when comparing these two recordings, keeping in mind that the permanent and Geometrics geophones are at slightly different positions, and the permanent geophones are drilled and cemented in place. Foremost is that both systems display similar events, although the on-mountain system appears to have a higher signal-to-noise ratio. This may be because of better ground coupling as a result of cementation in competent outcrop. Furthermore the permanently emplaced geophones record apparently time-delayed coherent energy on the horizontal channels. These may represent shear waves. Finally, the 1Hz geophone displays significant energy even after low-cut filtering. Thus, the mountain system appears to be performing at least as well as an industry-standard set of instruments and a full spectrum of wave frequencies and types appears to be in evidence.
Summary
The surface seismic array on Turtle Mountain consists of remote, radio-enabled seismic sensors and transmitters. The stations are distributed in a pattern such that seismic sources originating from likely zones of seismicity within the mountain are to be detected. The station locations were chosen to be proximal to likely sources of microseismicity, but were also constrained by topographic, safety, and vegetative factors. The rugged nature of the mountain and its adverse weather influences the design of many of the station components. Each station includes a geophone, a recorder, a GPS antenna, a radio, and solar-charged batteries. A test of seismic data recording on the mountain, transmission to the Frank Slide Interpretive Centre, archiving, and retrieval indicates that the system is recording, storing, and retrieving with fidelity comparable to an industrial seismic recording system and should be able to detect similar events generated by rock movement inside the mountain.

Acknowledgements
Much of this work has been accomplished by Gennix Technology Corp. of Calgary under Contract DS00215 (WP04.01) to the Ministry of Municipal Affairs, Government of Alberta. We also express our appreciation to Alberta Energy Research Institute (AERI) for COURSE Grant #1432, under which technology complementary to this project was developed, the University of Calgary, and CREWES staff for further supporting this effort. We are also grateful to Drs. Willem Langenberg (EUB) and Doug Bingham (consultant) for respectively sharing their expertise regarding Turtle Mountain geology and microseismic monitoring. Further, both gentlemen enthusiastically provided helpful advice during reconnaissance visits to select station locations. Further, we extend our thanks to Rod Read (RSRead Consulting Inc.) for project management, Ben Firth and Dave West (Vertical Systems Inc.) for expert assistance on the mountain, and Greg Carter and Herb Presley (Ministry of Municipal Affairs) for handling purchasing and logistics. Conquest Seismic Services Ltd. of Calgary provided the source used for testing the system.


Join the Conversation
Interested in starting, or contributing to a conversation about an article or issue of the RECORDER? Join our CSEG LinkedIn Group.
Share This Article