Introduction
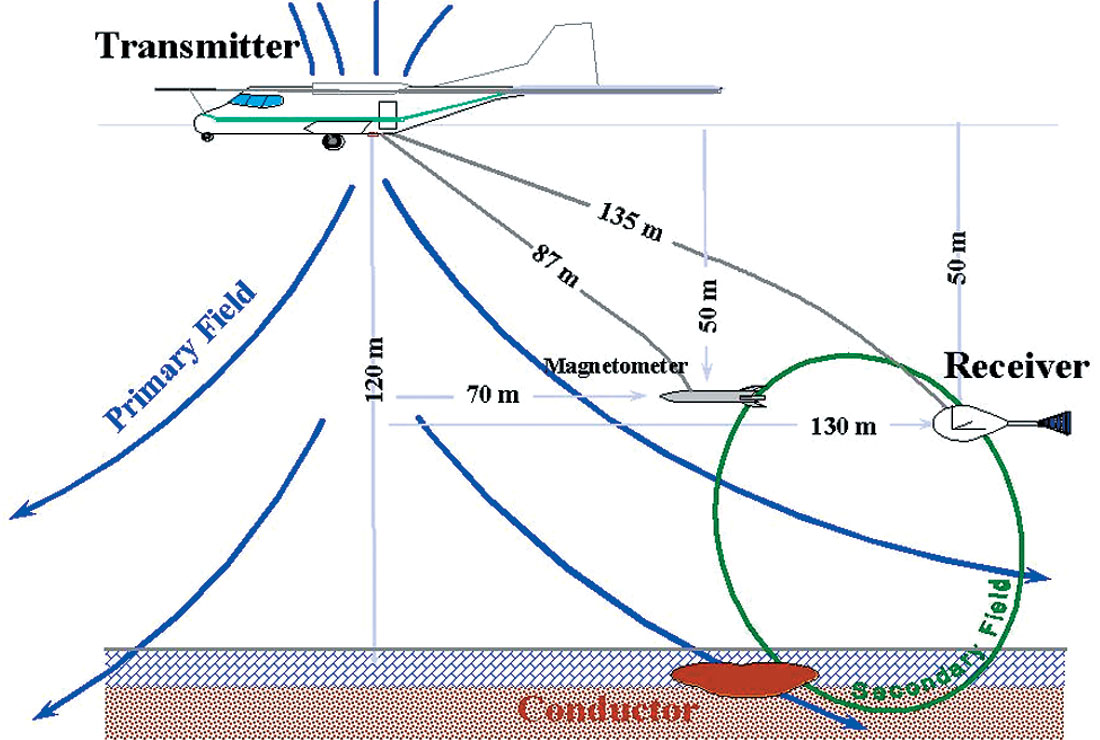
In the mid-1980s, Geoterrex (later Fugro Airborne Surveys) introduced the GEOTEM system, a fully digital airborne electromagnetic (AEM) receiver, using the same transmitter that had previously been used, very successfully, on the INPUT system (Annan, 1990). The GEOTEM system is mounted on a twin engine CASA 212 aircraft, and the transmitter loop is wound around the nose, wing tips and the tail of the aircraft (Figure 1). This transmitter excites eddy currents in the subsurface with periodic pulses of the “primary” magnetic field. The decay of these currents is measured with a receiver that is towed behind the aircraft in a “bird”. When the eddy currents decay slowly, this is generally indicative of material in the subsurface that is conductive. Figure 2 shows a schematic diagram of the system showing the towed receiver bird. Airborne electromagnetic systems typically also measure the intensity of the Earth’s geomagnetic field. For the GEOTEM system the magnetometer is in a second bird that is also towed behind and below the aircraft. Having magnetic data is useful for mineral exploration, as it can help to distinguish between conductive suphides (which are often associated with magnetic sulphides – for example pyrrhotite) and other conductive features like clay, graphites and shear zones (which are not magnetic). The magnetometer towed-bird location puts the magnetometer sensor close to the ground and provides high-resolution data.

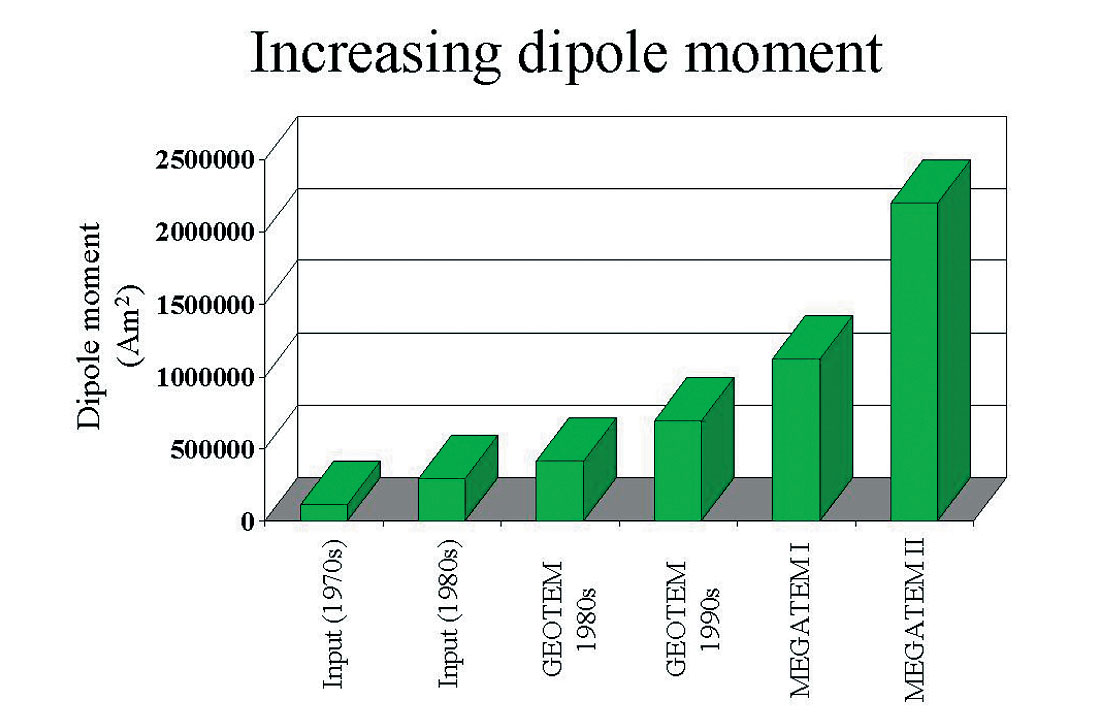
One measure of the strength of an AEM system is the transmitter dipole moment, the product of the current flowing in the transmitter loop, the area of the loop and the number of turns of wire in the transmitter. For the GEOTEM system, the peak dipole moment has been 0.69 million Am2 since the early 1990s.
The GEOTEM system has been used in many different types of terrain and for many applications (Smith and Annan, 1997). The system was recently attributed with discovering the Storliden deposit in Sweden (Posey, 1999).
In the mid 1990s, the GEOTEM system on a CASA had been deployed by BHP (now BHP Billiton) for exploration at relatively high altitudes (less than 2400 m) in the Altiplano regions of the Andes Mountains of South America. By 1996, BHP was interested in exploring in areas above 2400 m altitude.
Unfortunately, the CASA fixed-wing aircraft carrying a GEOTEM system is limited to flying in areas when the altitude is less than 2400 m. In order for a twin engine aircraft to fly surveys safely, the aircraft must be able to maintain altitude (or climb) after it has lost the use of one engine. When the aircraft is surveying at high altitudes (and temperatures) the ability of the aircraft’s wing to provide lift is reduced.
Effectively this means that the aircraft cannot fly safely at high altitudes, particularly when the temperature is high either at the airport or in the survey area. The additional weight and drag of the transmitter loop mounted on the aircraft means that the performance of the CASA with a GEOTEM system is not equivalent to a standard CASA.
BHP wanted to extend the capability of the existing GEOTEM system without compromising safety. In order to satisfy BHP’s requirement for airborne electromagnetic surveys at the higher altitudes, it was felt a new type of aircraft was needed.
As a consequence of this need, BHP was supportive of installing the GEOTEM system on another aircraft. The aircraft selected was the de Havilland DHC-7 (Dash-7) aircraft, primarily because this aircraft had four engines, and losing a single engine would not be as critical – there would still be three engines remaining in operation to maintain the altitude of the aircraft.
The MEGATEM development
A major project was then begun in 1997 to install a transmitter loop and the associated EM equipment on the Dash-7 aircraft. The primary task was to design a transmitter loop and the attachments to the nose, wing tips and tail of the aircraft. The engineering design of a safe transmitter loop is a major task, so basing the loop and installation as much as possible on the existing six-conductor CASA installation minimized the technical complexity. An attempt was made to construct an eight-conductor loop, but this loop was unstable in flight, so the design reverted to a six-conductor loop.
At the time, a deliberate business decision was made to minimize the technical and financial risk by simply installing the existing EM transmitter current pulser and the receiver system onto the aircraft. However, it was acknowledged that because the aircraft was capable of supplying more electrical power and carrying heavier EM equipment, the Dash-7 could be upgraded at a later time to carry a higher power transmitter pulser.
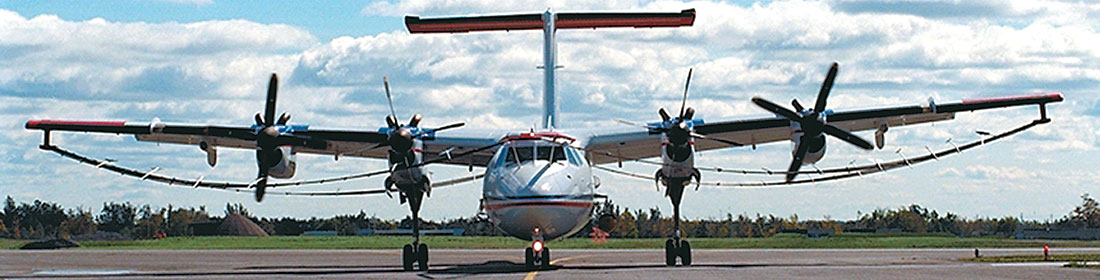
The Dash-7 mounted system was flight tested in late 1998 and was found to be able to operate safely up to altitudes of more than 4400 m when operating on three engines. Being able to operate at these altitudes opened up a large percentage of the High Andes for exploration with fixed-wing AEM equipment. The larger size of the aircraft meant that the area of the transmitter loop was 406 m2 compared with 232 m2 for the CASA installation (an increase of 75%). Thus, although the EM transmitter was not upgraded, the peak transmitter dipole moment of the system also increased by 75 % to about 1.1 million Am2. Because of this larger dipole moment and the physical size of the Dash-7 aircraft, the system earned the name MEGATEM. A picture of the system is shown on Figure 3.
The MEGATEM system was deployed for almost a year in South America and returned to Canada in late 1999. At that time, Noranda explorationists were carrying out a reevaluation of the Matagami camp. An historical analysis of the depth to the top of discovered deposits and ore bodies raised the question as to whether historical fixed-wing AEM systems had been as effective as had previously been thought. As a consequence, Noranda undertook an evaluation of all existing AEM systems over a test area near Matagami that included the Caber deposit. This deposit is a difficult target for AEM systems, being shaped like a cigar standing on its end and having its top buried more than 125 metres deep. The MEGATEM system flew this test area in December 1999. The results from the MEGATEM survey and from other fixed-wing AEM systems have been presented by Gingerich and Allard (2001) and these are summarized below.
For historical purposes the results from an INPUT survey executed in the early 1980s are shown in profile form in the top panel of Figure 4. There are a number of curves on this profile plot. The navy blue curve at the top is the measured Earth’s total magnetic intensity. The red and then orange traces are the response measured at early delay times after the pulse. At later delay times (yellow, green, blue) there is no anomalous response, suggesting that no good conductors can be identified below the profile. The location of the Caber deposit is marked with an X and the INPUT system clearly did not see the deposit. The QUESTEM system (operating at a pulse repetition rate of 25 Hz) was tried over the deposit, and no anomaly was present (data not shown). When GEOTEM (operating at a pulse repetition rate of 30 Hz) was tried, there was an anomaly, but it was relatively noisy (not shown). ASPECTREM survey did show an anomalous response that was detectable, but not strong (also not shown). The X component SPECTREM response was interpreted to show no clear response and a weak response on the Z component.
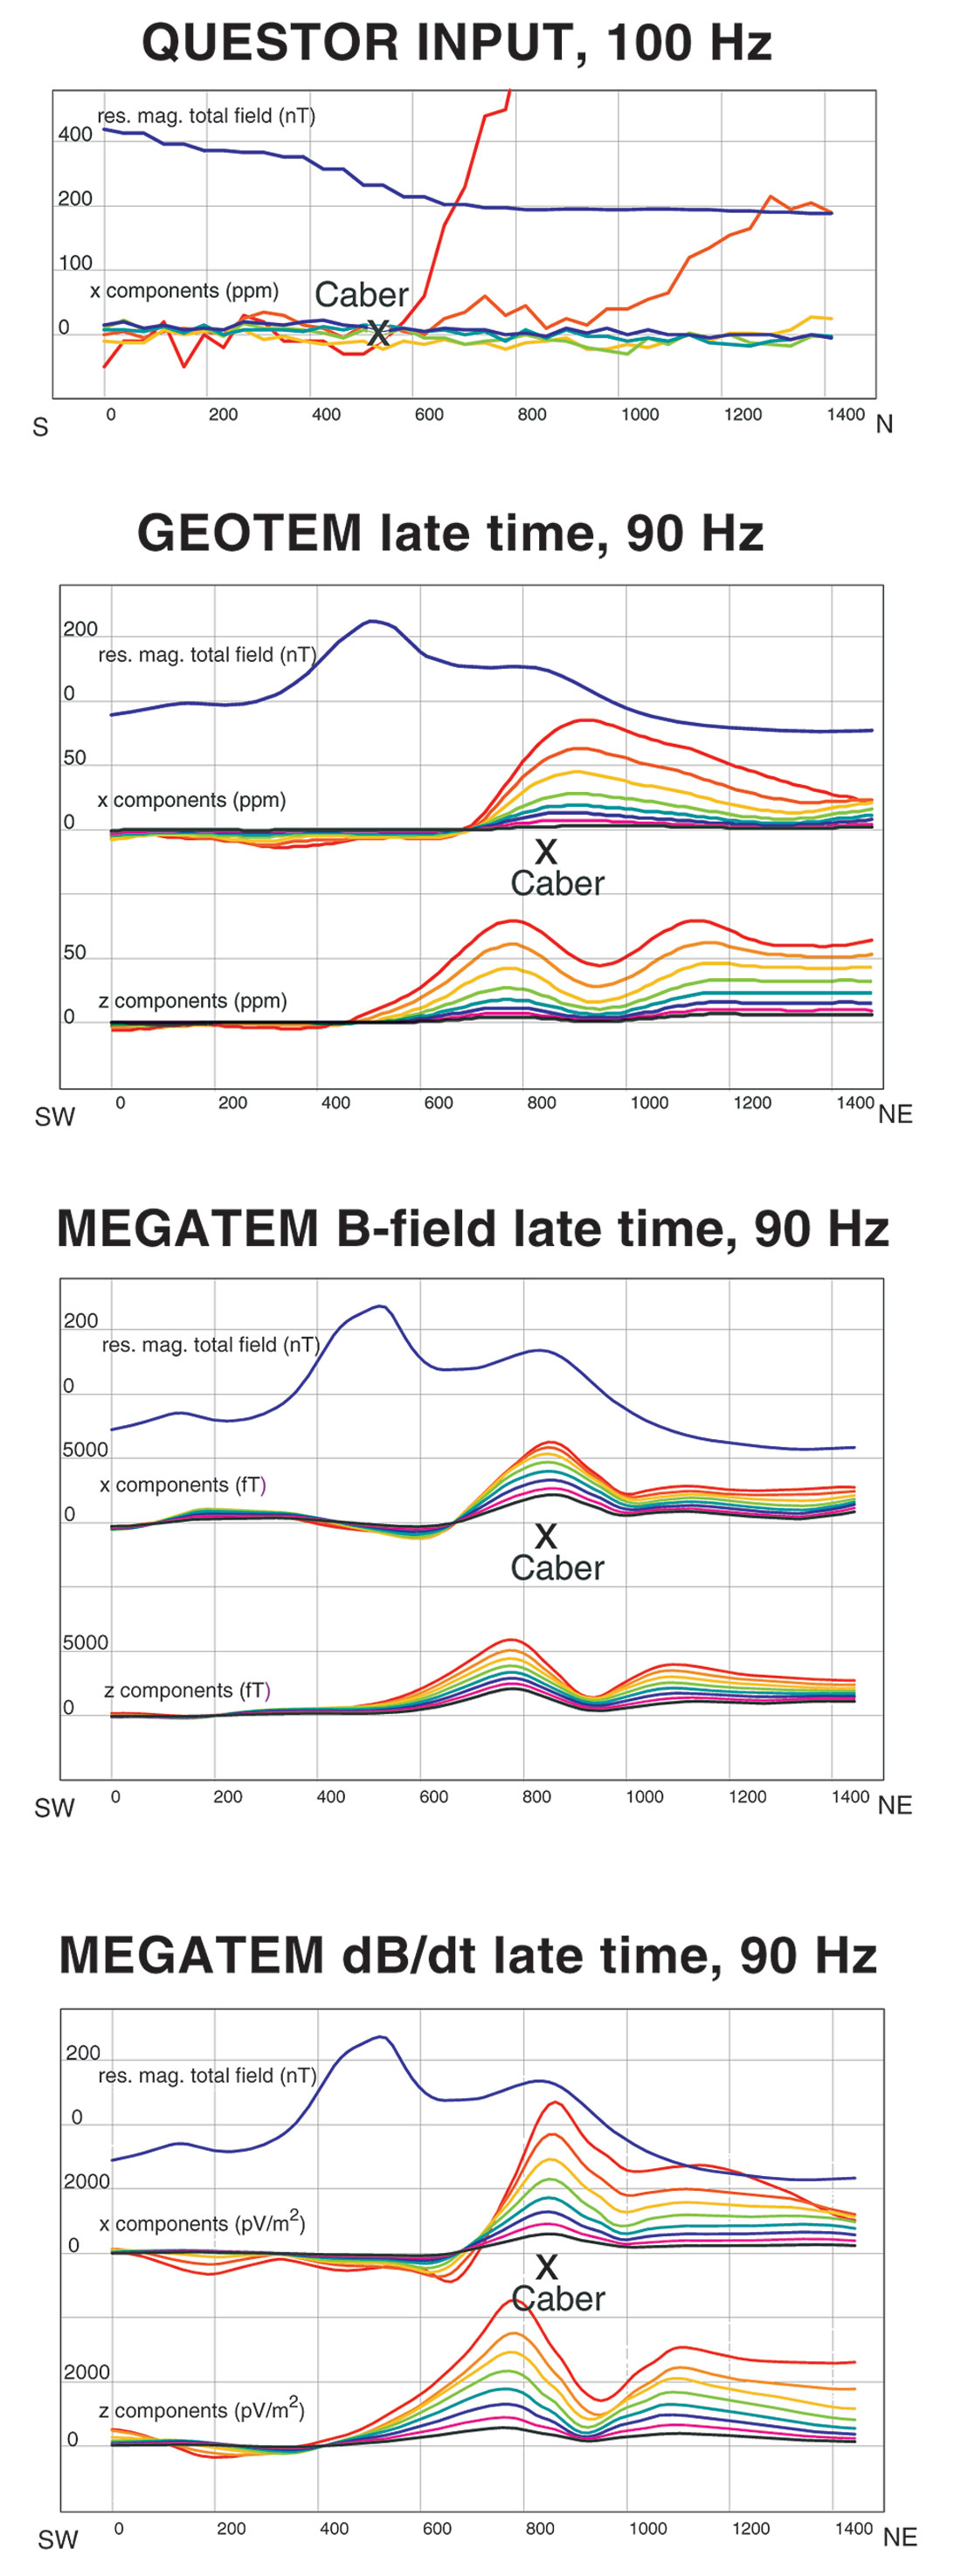
The GEOTEM results at 90 Hz (Figure 4, second panel) show a clear response on both the X and Z components. Compared with the poorer 30 Hz response, the better results at 90 Hz is a combination of two factors: 1) There are more pulses available for averaging, and 2) the shorter pulse is better tuned to exciting eddy currents in the Caber deposit. Note that the late-time responses on the GEOTEM 90 Hz data are not clearly anomalous, being close to zero.
MEGATEM 90 Hz profiles acquired during the test survey are shown in the bottom two panels of Figure 4. The clearest anomalies are seen on the B-field response (third panel), but for comparison with GEOTEM results on the second panel, we have also presented the dB/dt MEGATEM results on the bottom panel. The dB/dt response is as measured by the sensor, and the B-field data have been digitally integrated (Smith and Annan, 2000). Note that unlike the GEOTEM dB/dt data, the MEGATEM dB/dt response at late times shows a strong signal well above the zero level. The anomalies also appear sharper on the MEGATEM profile. Note that the Caber deposit has a distinct, but not strong, magnetic response (navy blue trace).
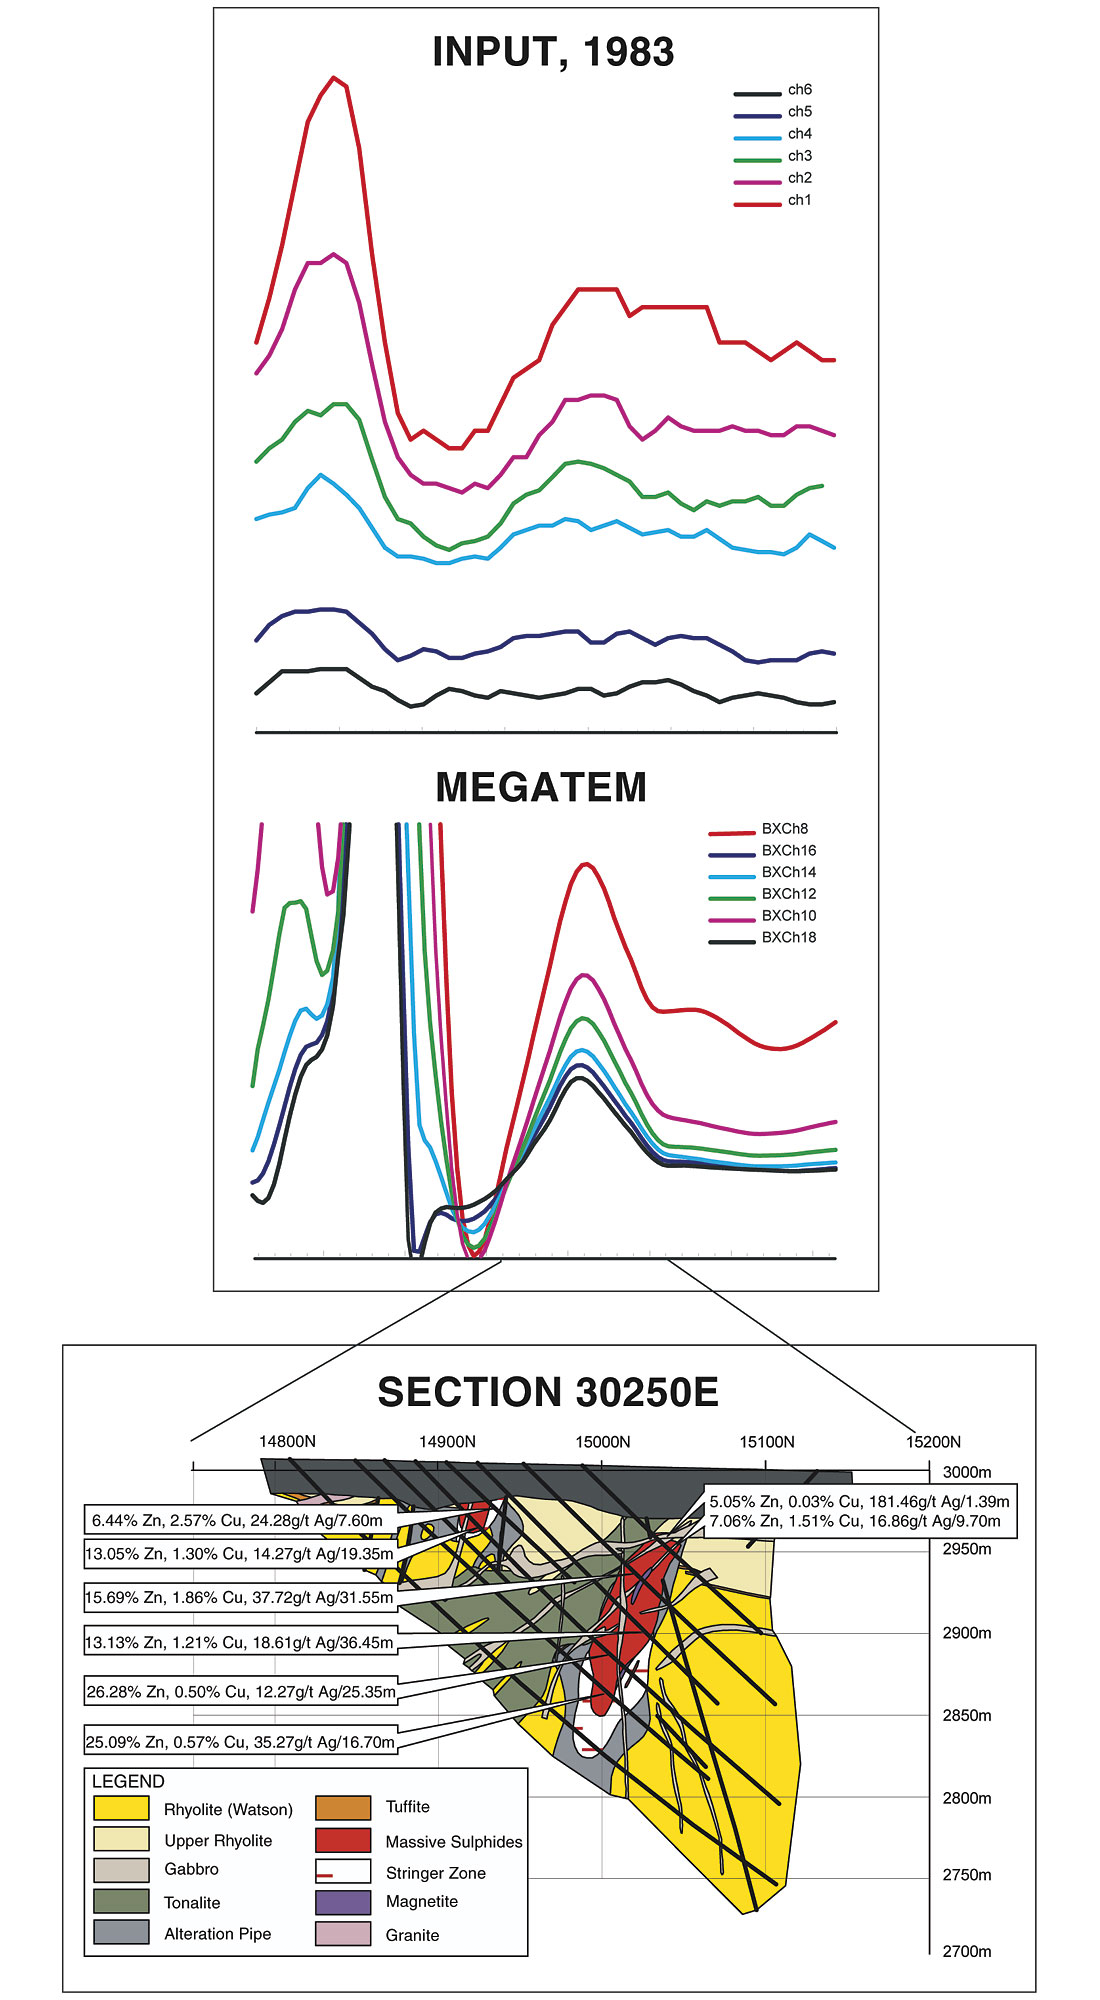
On the basis of this comparison, Noranda then decided to fly a MEGATEM survey over a prospective part of the Matagami camp (Gingerich and Allard, 2001). This airborne survey lead directly to the discovery of the Perseverance deposit on March 21, 2000. Within a month, two more deposits, Perseverance West and Equinox, had been discovered within one kilometre of the initial Perseverance discovery. Figure 5 shows the response collected in 1983 on a INPUT profile over Caber. There is a strong anomaly on the left associated with a power line that runs along a road to the Matagami airport. However, the response over Perseverance (just right of centre) is not clear and looks only marginally more anomalous than the overburden response on the extreme right of the profile. However, the MEGATEM response profile shows a distinct anomaly over the ore-body that is clearly different from the overburden on the right of the profile. Here the body is clearly a good conductor, as the late-time response is anomalous, being well above the nose level. From comparing these profiles, it is easy to see why the MEGATEM data lead to the discovery, while the INPUT data did not.
Subsequent developments
As noted previously, the Dash-7 aircraft is capably of supplying more electrical power and carrying heavier EM equipment than the CASA aircraft. With Noranda’s encouragement and support, the MEGATEM system underwent a further upgrade in early 2001. This upgrade took advantage of the power available from the AC generators on each engine. The total power available is about 40 kW, this power was converted to DC and used to drive an upgraded transmitter pulser. The four-fold increase in power resulted in a two-fold increase in peak transmitter dipole moment to 2.2 million Am2. This upgrade to the MEGATEM system has been designated MEGATEM II. Figure 6 shows how the transmitter dipole moment of the MEGATEM II system compares with other time-domain AEM systems.
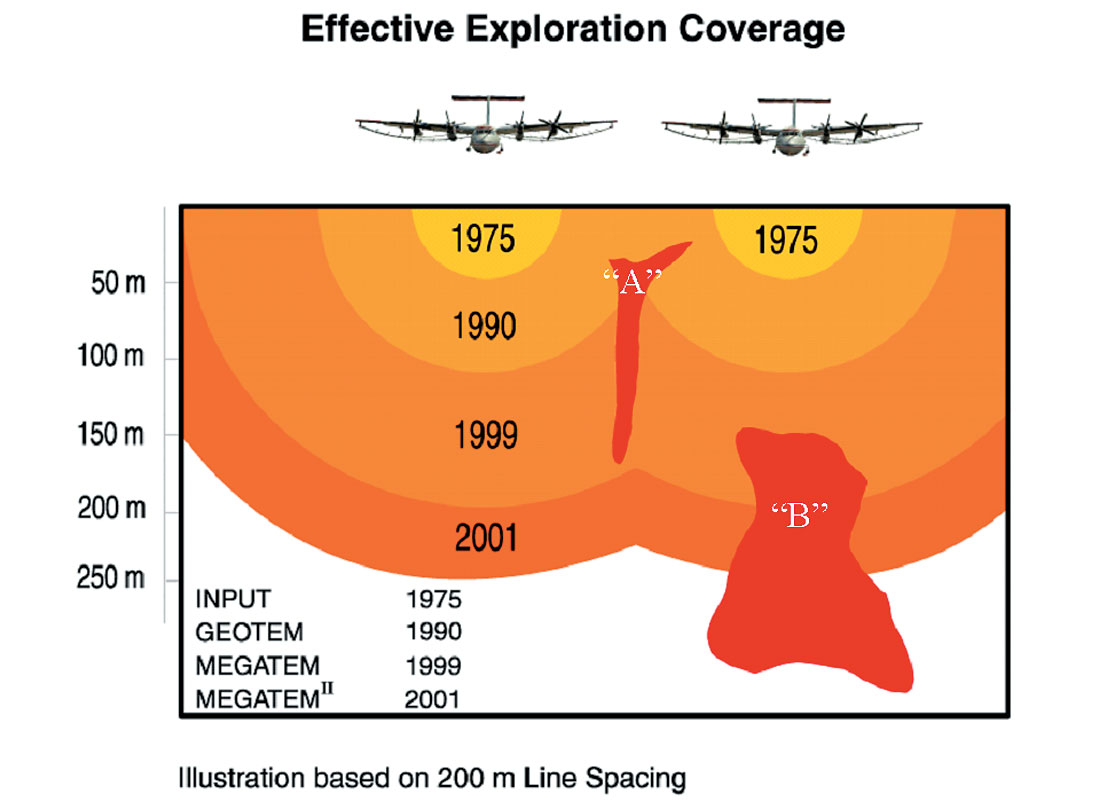
Unfortunately, doubling the dipole moment does not double the depth of exploration. The strength of the primary magnetic field from the transmitter falls off as the inverse distance cubed. Hence, a system with a dipole moment that is bigger by a factor of two will only see about 25% deeper. Noranda geophysicists put together a schematic cross section to show the depth (or volume) of ground that would be investigated by the various systems in the Abitibi greenstone belt (Figure 7). The locations of two flight lines (200m apart) are indicated with the aircraft image. Below the flight lines are circles indicating the effective exploration coverage for a thin vertical pipe-like body. Different colours represent different vintages of AEM systems. Body “A” would not have been detected by an INPUT system flown in 1975, positioned as it is half way in between the flight lines. With more recent systems it is possible to see the small conductor between flight lines. It is apparent that the MEGATEM system sees to a depth of 250 m below the flight lines and only marginally less between the flight lines. Body “B” would be seen by MEGATEM and even more clearly by MEGATEM II.
Recent results over the Reid-Mahaffy test site indicate that the signal to noise of the new system is indeed significantly better than the initial MEGATEM system. Figure 8 shows a comparison of the GEOTEM and MEGATEM results over a bedrock conductor in the Reid-Mahaffy test site.
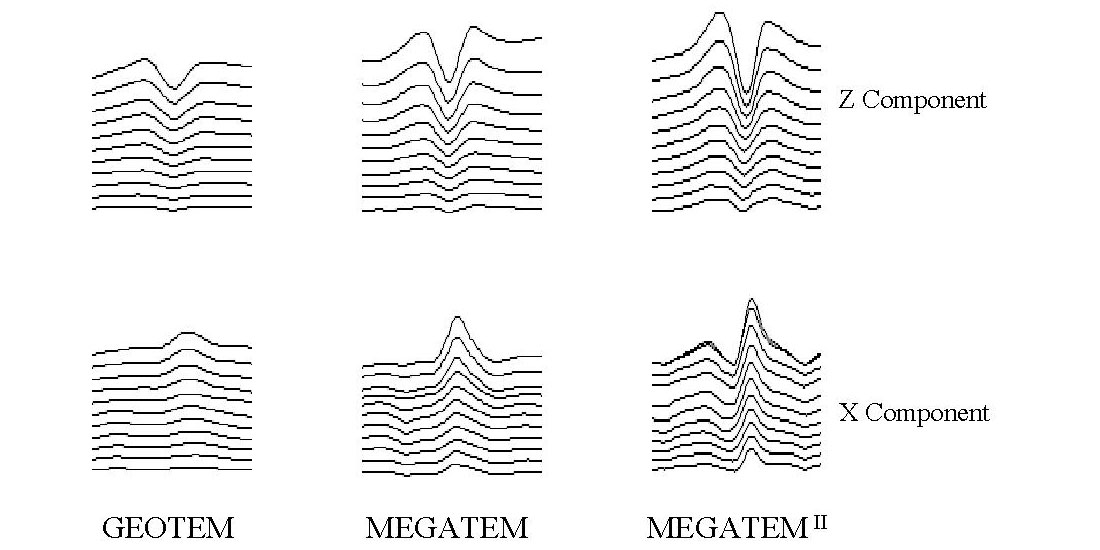
On the GEOTEM profiles of Figure 8, the Z component response is moderate at early time, but is barely visible at the latest delay time. The X component the GEOTEM response is bare l y apparent after the first four or five windows. The MEGATEM anomalies are larger in amplitude and show clearly evident late-time responses in the Z and X component profiles. The MEGATEM II profiles show an even larger response at late time and are sharper and easier to interpret. The X component even shows a smaller peak to the left. This peak is consistent with the vertical conductors known to exist in the area.
Conclusions
The development of the MEGATEM and MEGATEM II systems has been driven by specific exploration objectives. The first is to survey in high altitude areas, beyond the reach of AEM systems installed on a twin-engine aircraft. The second requirement is to improve the signal to noise ratio so as to increase the ability of the AEM system to identify deep conductors. Exploration success at Perserverance indicates that the MEGATEM system has successfully achieved both these objectives.
Since the introduction of the MEGATEM II system in July 2001, more than 175 000 line km of mineral exploration and survey lines have been flown. Much of the mineral exploration work has been in highly prospective areas that have already been surveyed by older generation systems.

Acknowledgements
The authors wish to acknowledge the encouragement of Ken Witherly and Randall Nickson of BHP in the development of the MEGATEM system. John Gingerich, formerly of Noranda was very supportive in the development of the MEGATEM II system. We would also like to acknowledge the contributions of Tom Payne, Al Proulx, Jean Lemieux, Brenda Sharp, Mike Carson, George Nader and Dwayne Beattie, of Fugro, who all contributed to the success of the MEGATEM development. Part of this paper was previously presented in Smith et al. (2001). Thanks also go to Fugro Airborne Surveys for supporting this work.


Join the Conversation
Interested in starting, or contributing to a conversation about an article or issue of the RECORDER? Join our CSEG LinkedIn Group.
Share This Article