Airborne electromagnetic methods (AEM) have been widely used for more than 60 years by the oil and mineral industries as a primary exploration method. In the last 30 years, water resource management challenges have prompted the application of AEM methods to basin- or watershed-scale mapping (e.g. Abraham et al., 2012; Viezzoli et al., 2012; Siemon et al., 2009). This increased usage of AEM to map water resources can be attributed to: 1) applicability of airborne methods to map electrical properties of the earth for geological interpretation, 2) advancements in both AEM hardware and software that enable detection and interpretation of aquifer materials, and 3) the need for sustainable management of water resources due to increasing population, expanding areas of irrigated agriculture and economic development, and to the ever‐increasing demand for water worldwide (Wada et al., 2010).
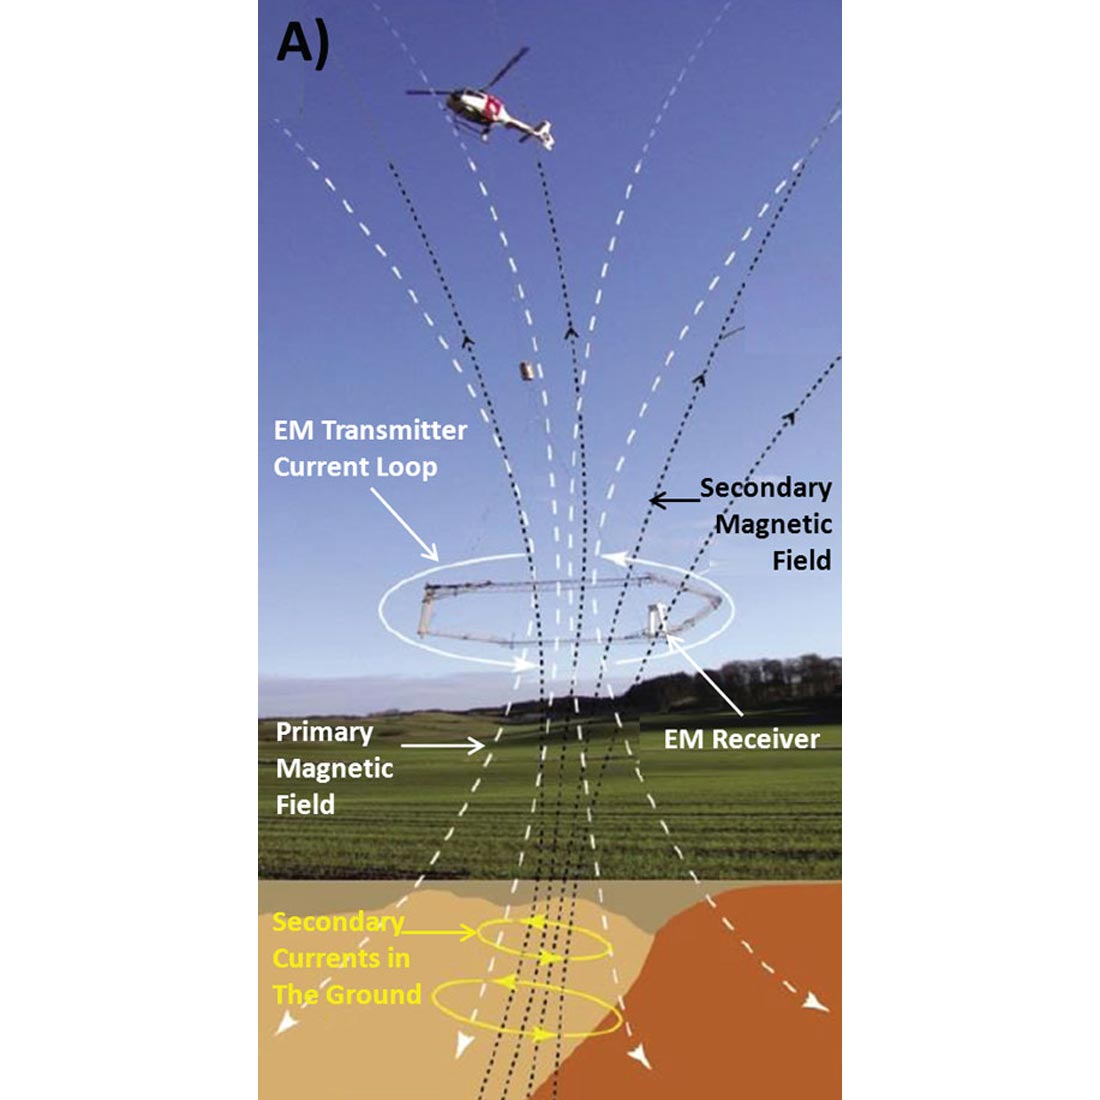
Point source data methods, which include borehole logs, borehole geophysics and surface geophysics, have enjoyed a long history of being the best available technologies to improve our understanding of groundwater and its flow path (Abraham et al., 2011). In order to create hydrogeological frameworks over large areas, these traditional methods require interpolation over long distances. AEM has the ability to: 1) map very large areas continuously along the flight lines, and 2) map geology from the very near surface to depths of many hundreds of metres in a reasonable time and at relatively low costs compared to point source methods. The most common airborne methods currently utilized for groundwater mapping are electromagnetics and magnetics, which are generally measured in one operation. AEM contributes most to groundwater exploration purposes due to its ability to detect the electrical conductivity, or its inverse – resistivity, of subsurface lithology (e.g., clay content, coarse or fine grained materials, groundwater salinity and aquifer conditions (Kirsch, 2006; Auken et al., 2009). The method (see Figure 1) is described in this paper with case studies that show how it has been applied to arrive at descriptions and maps of the subsurface.
The Airborne Method
A unique value of these surveys is that data can be quickly collected without disturbing delicate environments (e.g., arctic tundra) and economically important agricultural crops (e.g., corn and wheat). These transient electromagnetic (EM) datasets can then be processed, inverted, and interpreted to provide information on the structure of the geological and hydrogeological environment.
Hitherto, the data used to build hydrogeologic frameworks has often consisted of sparse borehole lithology and geophysical logs combined with surface geologic maps and occasional surface geophysical soundings. While this may be adequate for some regional studies, groundwater models generally lack sufficient spatial data density for reliable geological interpretation at a local level. For detailed studies of local aquifers and surface water systems, long distances between point data points can introduce significant error into the three dimensional framework to inhibit accurate representation of true site conditions.
Consider that a 6 inch borehole represents less than one-millionth of one acre. A borehole will provide precise information about geology in the immediate vicinity of the borehole, but any inferences made about the surrounding geology are at best an educated guess. Boreholes are expensive and sometimes difficult to drill in certain locations, and the output is often scattered information with low borehole density and few drillings extending to sufficient depths. This can lead to uncertainties and low confidence levels in geological interpretations and hydrogeological models.
Against this background, airborne geophysical surveys are increasingly being employed to provide significantly improved spatial data that can be calibrated to existing borehole logs and other mutually supportive data to create a quantitative and precise subsurface map. The geophysical data collected do not replace, but complement existing borehole data, thereby reinforcing the geological interpretation. Three dimensional maps generated from integration of AEM data with other available information provide a robust method for identifying and locating subsurface features and determining geometry of an aquifer system, including location, thickness and breadth of saturated areas, heterogeneity of aquifer materials, recharge zones, lithologic barriers to groundwater flow, contaminant plumes, salt water encroachment, and connections to surface water systems. This in turn leads to greater certainty of identified economical and productive drill targets. Once the area has been mapped with AEM, the data can be interpreted for geotechnical and environmental engineering studies such as mine tailing site selection, buried pipeline right of way, and appropriate locations for infrastructure development.
An AEM System Specifically to Map Aquifers
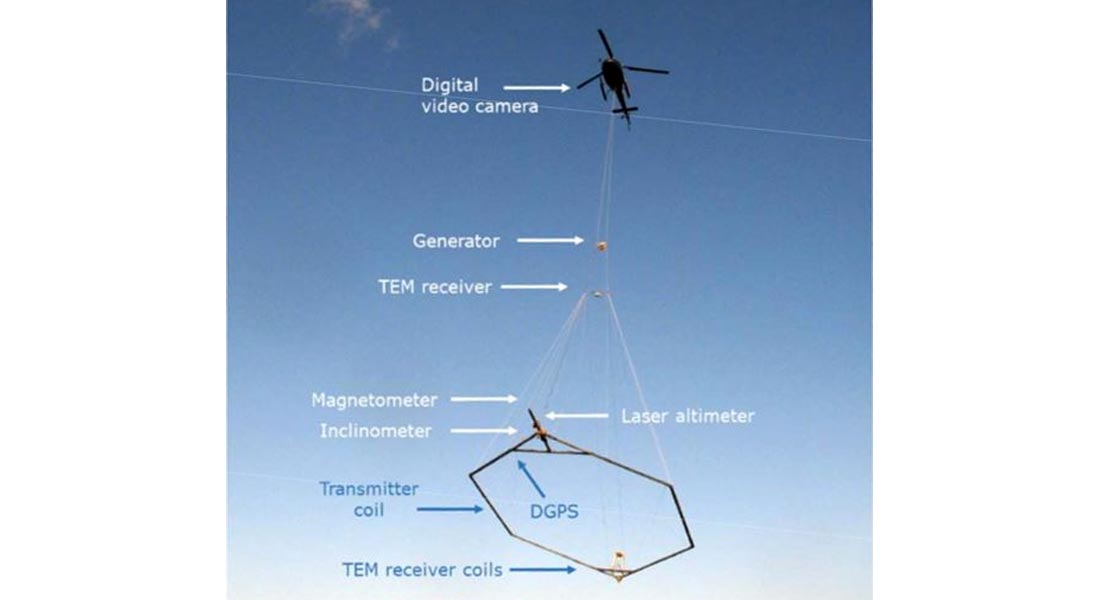
The AEM data collected in the presented case studies were collected with various models of SkyTEM systems – a time-domain (TEM) helicopter- borne geophysical system developed over the past 14 years and designed for hydrogeological and environmental investigations (Figure 2). The basic concepts of the SkyTEM system are described by Sørensen and Auken (2004). In the 1990s, base-metal exploration was concerned with deep targets, and AEM systems began to follow two paths: fixed-wing time-domain systems designed for detection of deep conductive targets, and frequency-domain HEM (Helicopter Electromagnetics) systems intended for high resolution, near-surface, conductivity mapping.
SkyTEM energizes the ground in dual-moment mode with different currents and different numbers of transmitter wire turns. The dual-moment mode comprises the concurrent use of a low moment (LM) to record early times that contain near-surface information and a high moment (HM) enabling great depth penetration (Bedrosian et al., 2016). This feature enables the geology to be mapped in high resolution from the very surface to greater depths, which is crucial for many groundwater applications.
Also of note is the ability of SkyTEM to stay calibrated throughout acquisition so that depth to, and depth of, the groundwater can be calculated with great accuracy. The SkyTEM frame is rigid enough to carry an array of ancillary sensors including a magnetometer, laser altimeters, video cameras and GPS equipment. The system is lightweight, operator-less, and can be configured to operate at a range of base frequencies and delay times to optimize for a range of geological mapping objectives. Because of its high lateral and vertical resolution, the SkyTEM system is increasingly used also in mineral prospecting where accurate definition of high conductivity anomalies is essential.
Case Studies
Hydrogeological Mapping in Northeastern British Columbia
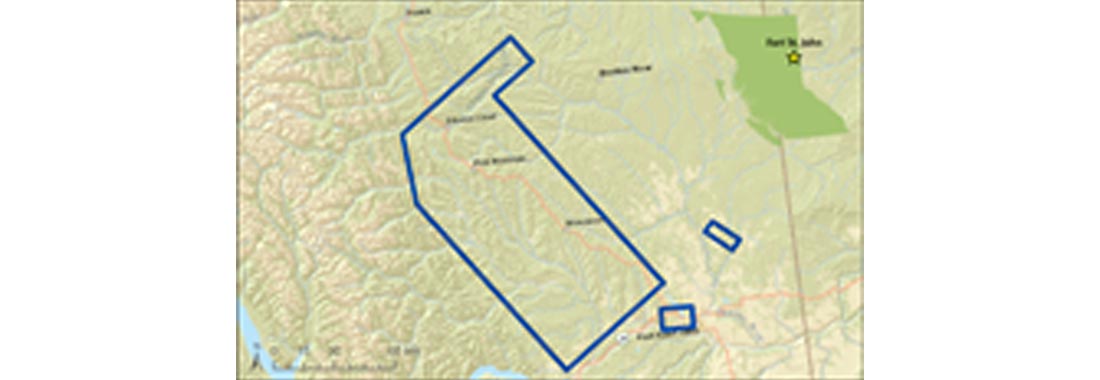
In 2015, Geoscience BC launched the Peace Project – a subsurface mapping project designed to collect new information about groundwater within an 8,000 square kilometer area in northeast BC, Canada, shown in Figure 3. This region of the province has been a focus of petroleum exploration and development since 1952, and participating partner companies included the BC Oil and Gas Commission, ConocoPhillips and Progress Energy, as well as several Treaty 8 First Nations.
The main priority of the project, comprising the collection of 21,000 line kilometers of AEM data, was to map shallow aquifers in northeast BC’s Peace Region through the integration of the AEM data with shallow well data and shallow 3D seismic. A secondary priority was to finish the airborne data acquisition before hunting and trapping season began, requiring all data collection be completed within seven (7) weeks from start up. A SkyTEM312FAST system was employed for the data acquisition. The 337 m2 transmitter was configured with a two-turn low moment and a twelve-turn high moment. The LM current is about 5 A with a turnoff time of 15 μs, and the HM current is in the range of 120 A with a turn-off time of 320 μs, yielding a magnetic moment of approximately 500,000 Am2. The system operates at speeds of 120-150 km/h, and all data were acquired in only forty-three (43) days (Brown et al., 2016).
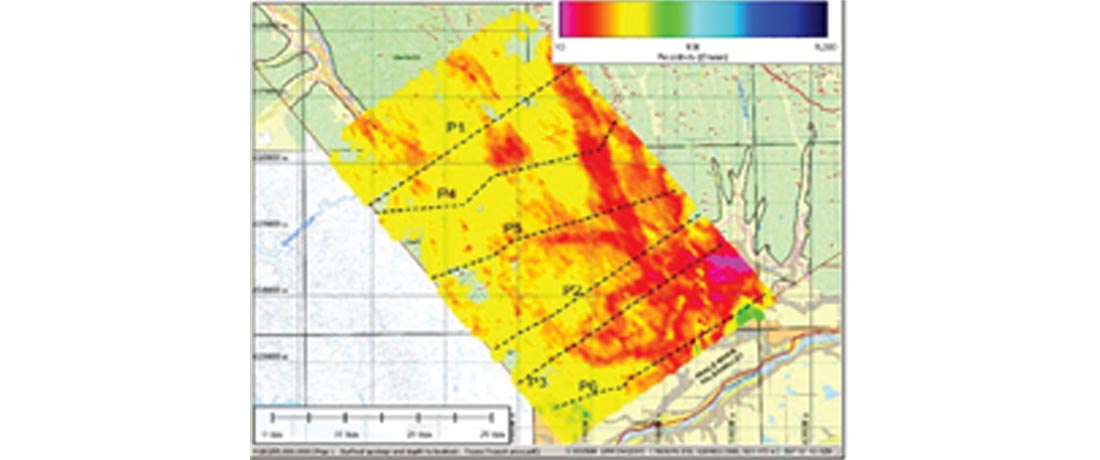
Depth of investigation (DOI) is affected by several factors, one of the more significant being conductive overburden that can limit penetration of the TEM signal. It should be noted that the average depth of investigation in the area was over 400 m. Figure 4 shows a resistivity slice at elevation 500 m, corresponding to an average depth of approximately 200 m. The AEM resolved several interesting features which cannot yet be confirmed as structural or hydrogeological. A vertical resistivity cross section corresponding to P5 is presented in Figure 5. The DOI is shown with a black solid line. Borehole data is included which shows thickness of Quaternary and type of bedrock.
The geological interpretation suggested in Figure 5 is based on integration of borehole data and previously known stratigraphic information. It can be seen that the AEM data corresponds closely with the ground truth information and in general the inverted resistivity models reveal depth to bedrock, both shallow and deep, with good accuracy (Viezolli et al., 2016). The Quaternary sediments of the Sikanni (shales/sandstones) basement are well resolved and reveal a paleochannel as a more resistive layer with a very conductive top. The Dunvegan has a high conductive response which may be the effect of salt water, but this remains to be verified. Its close proximity with Buckinghorse basement indicates a potential fault zone.
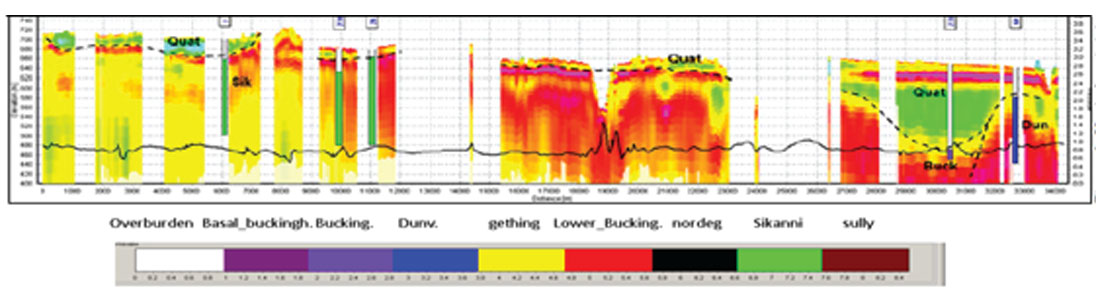
Some formations in the area show consistent resistivity responses, while others vary. This could be due to variations in pore water resistivity, non-uniformity in the rock matrix, or both. Observed vertical resistivity variations in the Quaternary units are most likely due to the presence of glaciolacustrian deposits. The ability to extract information on lithology and hydrogeologic units at such depths over large areas provides land managers with enhanced understanding and clarity of the hidden subsurface. In a resource-rich area like the Peace River region, it allows them to select potential targets for drilling and provides knowledge for managing deeper, most likely saline, aquifers associated with resource development. Comparison with ancillary information is encouraging, and so is the depth of investigation and the spatial resolution obtained. At the time of this writing, seven (7) locations for new exploratory boreholes have been selected and are in the process of being drilled. The technical results from this program will aid First Nations communities and all levels of governments in making informed decisions on groundwater management. Further details can be found in Best et al. (in this issue).
Measuring Volumes of Water
In August 2013 The Lower Platte South Natural Resources District (LPSNRD) in Eastern Nebraska conducted an AEM survey near the towns of Brainard-Valparaiso within the LPSNRD to support creation of a hydrogeological framework in the area. The final report states “Interpretation of the AEM data... provided a superior subsurface characterization of the principal aquifer that correlated with pre-existing geologic information (http://www.enwra.org/media/_LPS_AEM_REPORT_FINAL_text100dpi.pdf). The interpretation also provided a new understanding of the glacial and bedrock features present in the subsurface.” A priori information used in the interpretation of the AEM results was available from test holes and registered well records, historic cross sections and a limited number of geophysical logs.
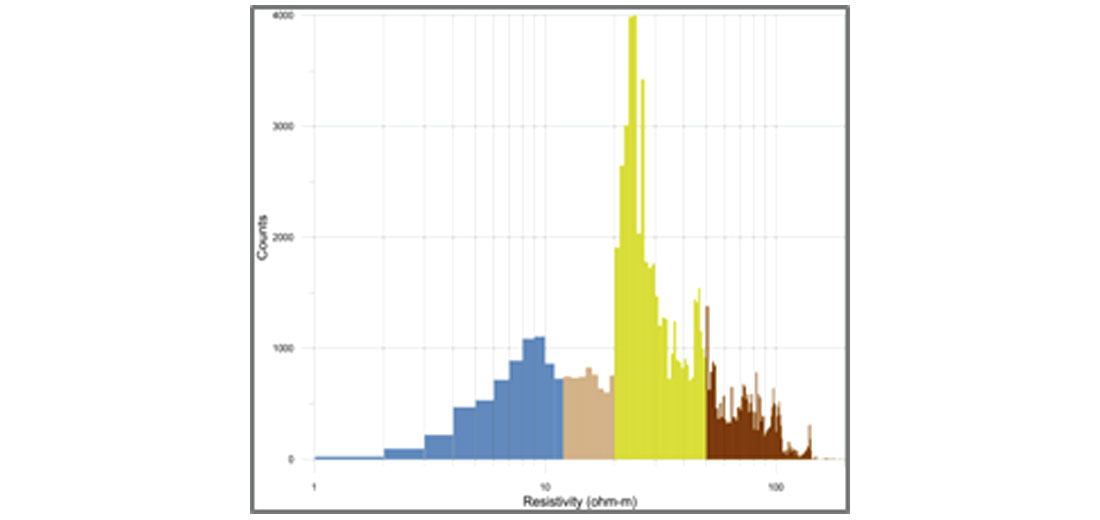
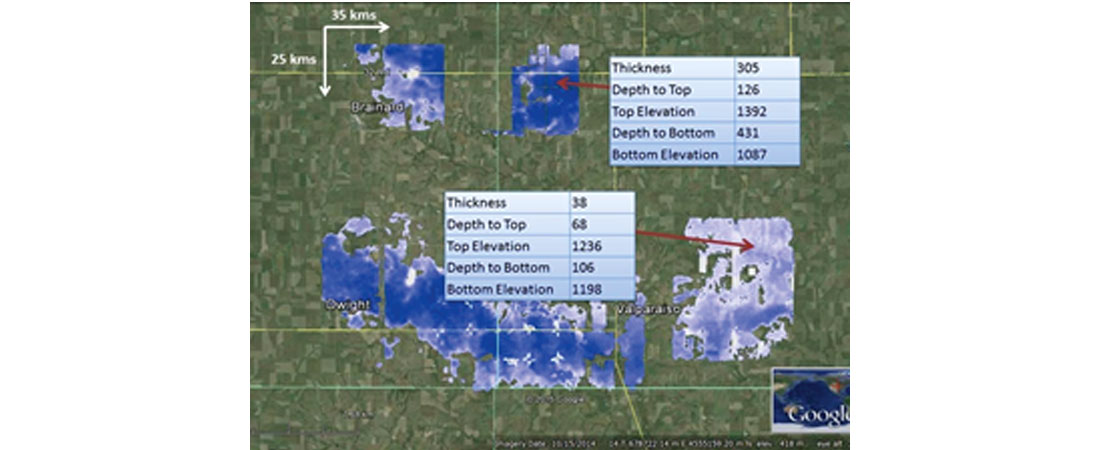
Distribution of aquifer materials and aquicludes in the glacial sediments provided detailed three dimensional verification and quantification of the paleovalleys. The location, orientation, and connectivity of the principal aquifer and the local streams were identified throughout the project area to a depth of approximately 300 m. Also revealed were surface locations likely to provide recharge of the principal aquifer. The ability to accurately map areas of glacial till and loess areas aids in understanding the confined and unconfined nature of the groundwater system. Integration of the AEM and a priori data provided the ability to estimate total aquifer volume and the amount of water available for extraction. In order to calculate the volumes of aquifer material, resistivity thresholds are applied to the lithological interpretation (Figure 6 from http://newra.net/wp-content/uploads/2013/10/roundtable051315.pdf). These were set at between 18 and 24 ohm-m (relatively resistive ground). Below these values, (i.e., the more conductive ground) AEM data are considered to represent confining (aquitard) materials, or areas where the presence of fine-grained material prohibits the development of high-yielding wells. Within the project area, the principal aquifer is estimated to contain nearly 884,000 acre-feet of fresh (non-brackish) water. A screen capture from the LPSNRD website showing a Google Earth™ image is shown in Figure 7. Clicking on the blue/white shaded areas produces a “pop up” box showing depth to and depth of the aquifer in that area.
Locating water for resource development – Orca Gold Inc., Sudan
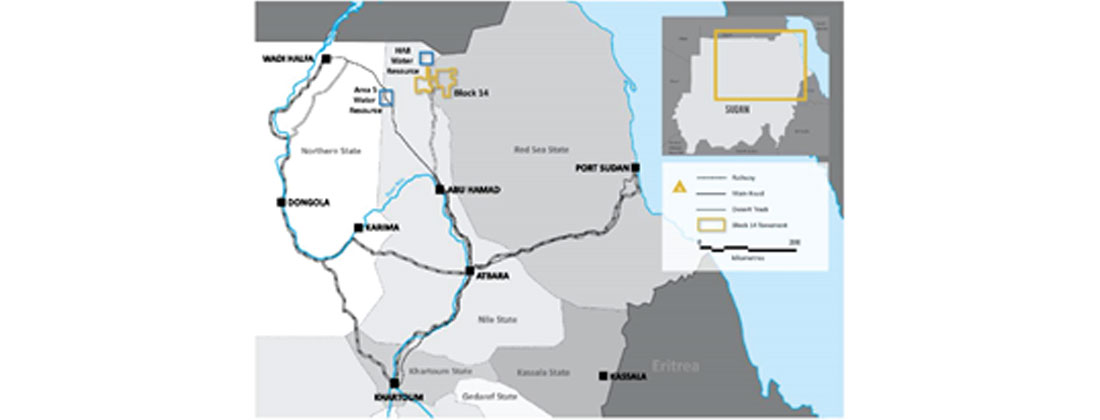
Orca Gold Inc. (Orca), a Vancouver-based company with exploration properties in Africa, determined that their gold project in the Sudan was uneconomic without a reliable source of water (see Figure 8 for Block 14 mine location map). Effectively, one (1) tonne of water would be required to process one (1) tonne of ore. Ground geophysical methods and exploratory boreholes in the immediate area north of the mine indicated that available water contained in a sandstone formation was limited in size and reliability. These studies also revealed that the water had high salinity content and would require costly reagent treatment before it could be used. Construction of a pipeline from the Nile was too expensive, and it was concluded that development of the mine would be economically unfeasible.
Orca and their hydrogeological consultant, GCS Water & Environmental Consultants, decided to employ AEM with two specific objectives. The first was to re-explore an area with a previously identified aquifer to the north to determine if it could be expanded. The second was to explore an area to the west of the prospect and within a radius where water could be economically piped to the mine site. This area was selected because it contained two pump-tested wells that had surprisingly high yields despite what was thought to be known of the hydrology. These two areas of exploration are identified as HA8 (north of mine) and Area 5 (west of mine) in the map shown in Figure 8. A SkyTEM312FAST AEM system was commissioned to collect the data.
Preliminary AEM results from area HA8 in the north reinforced the ground geophysics and borehole results that had indicated water was present but not in quantities sufficient to support mine operations. New targets were identified but were small and did not appear to be economic or were high risk for further exploration. Interpretation of the AEM resistivity data from Area 5, however, identified potential economic zones, and the first boreholes were targeted on the highest conductivity zones. These produced some water but not in usable quantities. Interpretations of the geology were adjusted and the drills were moved to moderate conductivity targets with a down-dip. This approach quickly proved very successful, with a series of boreholes proving high yields of low-salinity water.
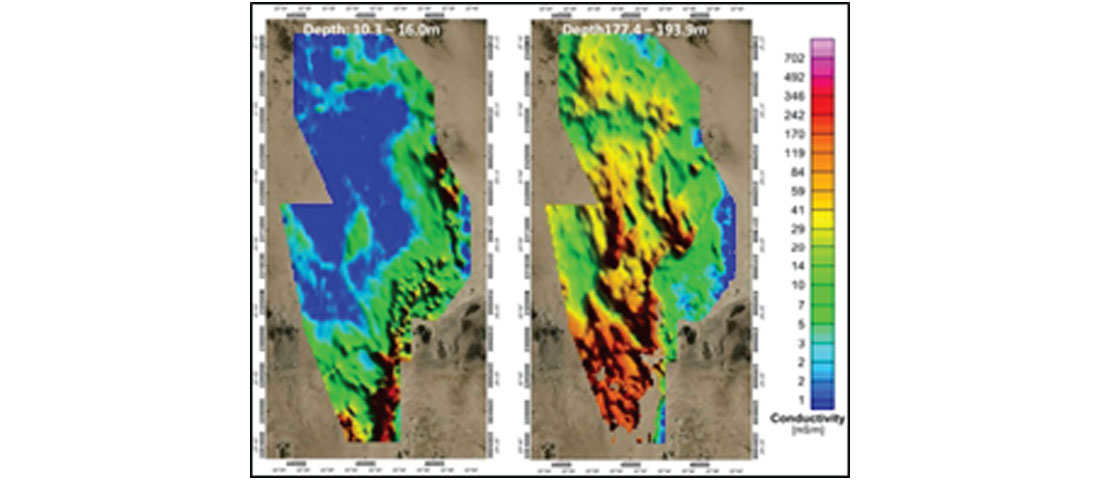
The current interpretation of Area 5 (May 30, 2017) is that conductivities above the water table are uniformly low (shown as the cool colours in the left panel of the Layer Resistivity Maps in Figure 9). Good aquifer material is associated with moderate to high conductivity (10-50 mS/m, see figure 9) in what was interpreted to be a well-defined layer with low clay content and fresh water. Lower than 10 mS/m is likely to be unfractured granitoid basement or dry sediment above the water table. Above 50-100 mS/m is likely to be clay-rich sediments with poor aquifer properties, saline water, or conductive andesite basement. (M. Harwood, personal communication, 2017).
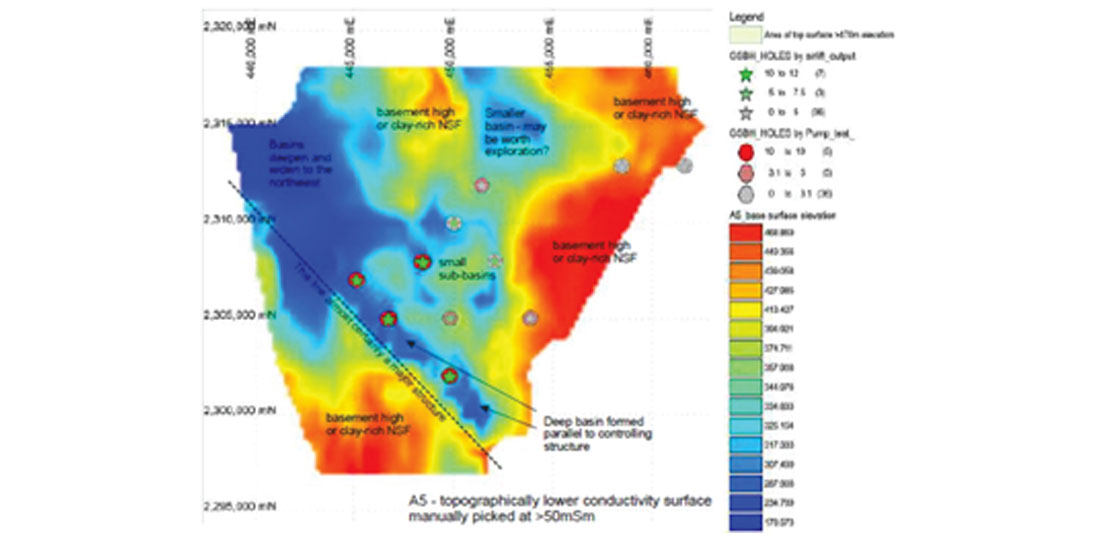
Water yields vary with the proportion of porous sandstone to clay-rich siltstones and mudstones. Figure 10 shows topography for the top of the 50 mS/m surface, representing the lower aquifer boundary. Borehole yields are displayed on top of the map, showing high yields in topographical lows. Conversely, low borehole yields are seen in topographical highs. There is a sedimentary system preserved in the subsurface, and water yields are greatest in zones of thick, laterally extensive units with high porosity and permeability. In May of 2017, after evaluation of the yields and quantities of water produced in Area 5, Orca was able to announce their decision to proceed to a definitive feasibility study at the Block 14 gold project. This was based on increased throughput made possible by the new water discovery that will reduce unit process operating cost, leading to a material increase in the “inpit” resources.
The resistivity values of clay and saline water are difficult to distinguish by TEM methods alone and boreholes and/or good field mapping is required to interpret the results. Extensive interpretation of the AEM data using the a priori ground data helps to map the distribution of the sedimentology throughout the area. The main advantage of TEM is that coverage of the areas, which were large and somewhat remote, required only a few days. Collecting data over these same areas with ground methods would take more time and money than what was available. TEM data is used to quickly develop a rough model of the geology, and data from the boreholes are used to adjust and improve the interpretation and selection of high yield water sources. The AEM defined bounding structures and gave shape and depth to the aquifer basin, and siting of each subsequent borehole was improved. Once the results from a summer 2017 drilling campaign are available, Orca will extend drilling to define the aquifer over a wider area. Having taken the decision to commission an AEM survey, it was decided to survey the mineralised areas as well while the kit and crew were onsite.
Conclusion
AEM has greatly improved the ability to represent the actual hydrogeologic framework in groundwater models to an extent that is not achievable using traditional methods. Data collected with airborne electromagnetic surveys provide a method to characterize large and/ or remote areas quicker than traditional methods, and, when combined with data inversion and statistical analysis, can add to confidence in making earth management decisions. A dual-moment AEM system, along with carefully applied EM inversion modelling, is capable of providing both near-surface resolution (aggregates, engineering materials), as well as the ability to map targets at depth (sand channels, clay caps) and does a good job of discriminating lateral resistivity contrasts and layering.
Water management over the coming decades will be based on the highly accurate groundwater flow models created by these datasets.


Join the Conversation
Interested in starting, or contributing to a conversation about an article or issue of the RECORDER? Join our CSEG LinkedIn Group.
Share This Article