Summary
Human discomfort increases at elevated temperatures (above about 27°C or 81°F). Higher temperatures impact our ability to work accurately and productively as well as to learn. Irritability and inclination to anger can increase, too. Transparency International is an organization that evaluates countries according to their political transparency – a value that attempts to capture the perceived extent of corruption. There appears to be some correlation between transparency and the latitude of the country’s capital: countries farther away from the equator are mostly rated as less corrupt (with several distinct counter examples). Ambient temperature is related to latitude and may be an underlying driver of transparency. Human relations and abilities are challenged by heat, and perhaps so is overall governance – which may explain some of the correlation between corruption and temperature. If this is so, there may be a partial cure: widespread use of airconditioning. The clarity of governance may be associated with temperature and, as such, can be improved.
Introduction
It’s almost too obvious to note that people have trouble working and thinking when they become hot. A poll, reported in USA Today, indicated that, “Most people say summer heat or humidity has a negative effect on their mood and temperament.” In addition, these conditions affected productivity with 45% of those polled indicating that they worked slower and 20% said they didn’t want to work at all (Figure 1).
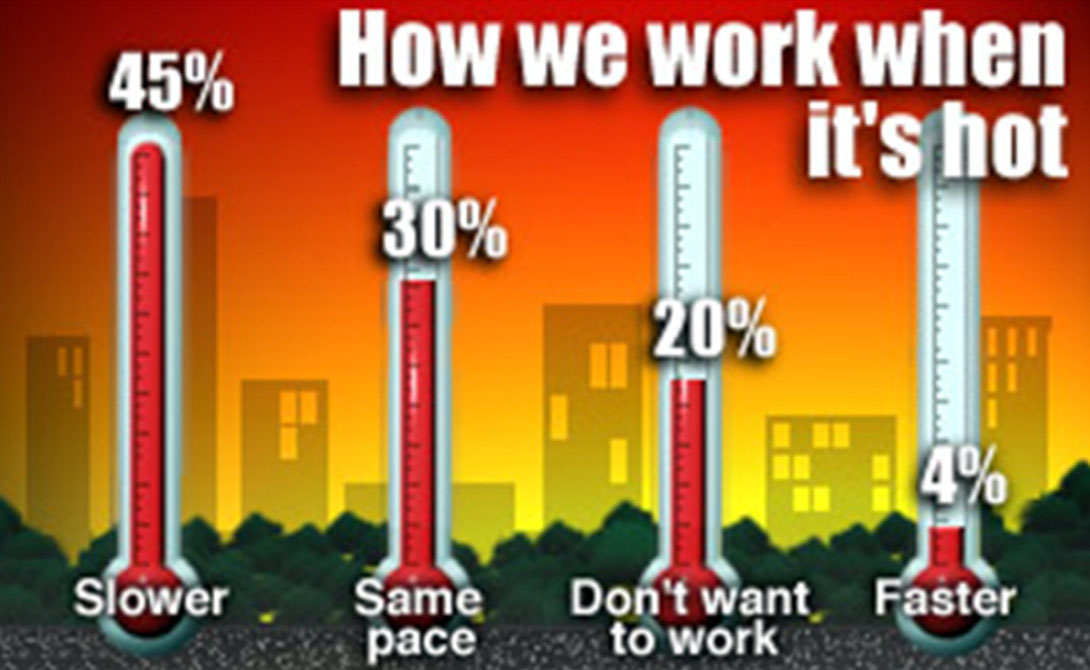
A more recent poll (Earth magazine, 2011) asked “Do you feel like your productivity decreases when the temperature climbs?” 45% of respondents agreed with “Yes, I can’t think as well when I’m hot”. Only 13% said, “No, I am not affected by temperatures.”
Blumberg (2002) in his book “Body Heat: Temperature and life on Earth” discusses just how striking is the impact of temperature on humans, and virtually every other lifeform for that matter. A human’s internal biochemistry works best only in a narrow range around 37°C. This internal range is most comfortably associated with an external temperature of about 20°C-27°C. Numerous studies on learning and temperature (e.g., Pepler, 1971; Schoer and Shaffran, 1973) indicate that students’ performance is significantly related to temperature. Students learned and tested better in air-conditioned classrooms at temperatures from 22.5°C-24°C than when in non-air conditioned classrooms at 26°C-29°C. Anecdotally, having taught in locations such as Hassi Messaoud, Algeria (with outside temperatures of 48°C and inside temperatures at 31°C), I can attest to the lack of quality teaching possible (not to mention learning) at these temperatures (Figure 2).
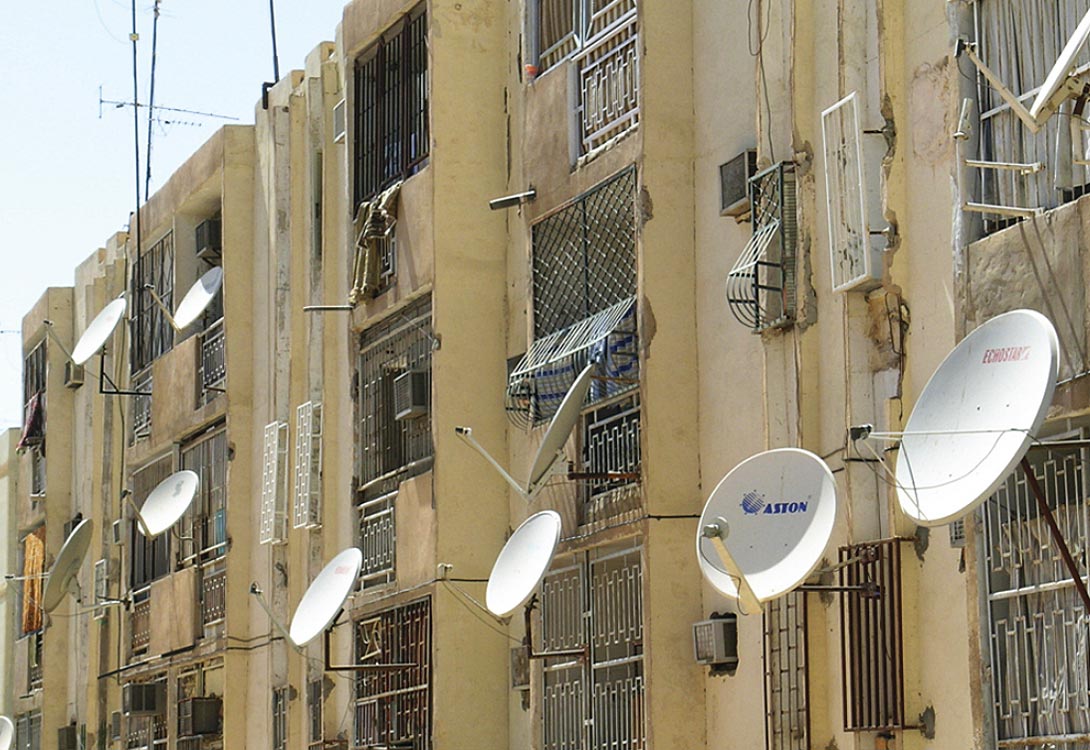
The sciences (IUPAC, 1997) define “standard” temperature and pressure as 0°C and 100kPa (1 bar). This is based on the freezing point of water and the approximate pressure of the atmosphere at sea level. However, many environmental and industrial organizations use temperature standards from 15°C – 25°C (e.g., EPA, 1990) which suggests normal operating ranges of equipment, processes, and personnel. “Room temperature” is roughly considered to be the indoor temperature at which humans are comfortable. It is often quoted to be about 20°C (Allwords, 2006; Aircon, 2006; Tech, 2006). Although, the popular and technical usage varies from about 18°C to even 27°C (300°K).
Six major variables are thought to determine how warm a person feels (Hensen, 1990; CUergo, 2006): his or her activity level, clothing, the air temperature, the mean radiant temperature (average temperature of nearby objects or room elements), humidity, and air speed. Hensen (1990) reports on numerous experiments that generally consider the human thermal “comfort zone” at about 25°C. Fowler (2005) suggests that 72°F-78°F (22°-26°C) is the optimal range of ‘thermal comfort’ for humans indoors. Rosario (2006) outlines numerous examples of bad behavior (from irritability to murder) increasing with ambient temperature. Anderson (1989) states, “Field studies clearly show that heat increases aggression.” Read (2006) quoting E. Boyanowsky states that, “The areas of the world where there are the most violent crimes are also the hottest parts of the world.” As well, there are many terms or phrases that indicate a negative association of temperature with human attitude (hot under the collar, hot-headed, lose your cool, chill out, etc.)
Bessamaire (2006) reports on how temperature affects working. He quotes a NASA Report (Table 1) that shows when in-plant temperatures rise over 85°F (29°C), output drops by 18% and accuracy suffers from a 40% increase in errors:
| Effective Temperature | 75° | 80° | 85° | 90° | 95° | 100° | 105° |
| Table 1. Work output and accuracy as a function of temperature (Bessamaire, 2006 quoting NASA Report CR-1205-1). | |||||||
| (24C) | (27C) | (29C) | (32C) | (35C) | (38C) | (41C) | |
| Loss in Work Output | 3% | 8% | 18% | 29% | 45% | 62% | 79% |
| Loss in Accuracy | — | 5% | 40% | 300% | 700% | — | — |
This type of unease is captured by charts of health effects expected for elevated temperatures. A U.S. index (Table 2), which combines the effects of temperature and humidity, is shown below.
| Heat Index | Health Effects |
|---|---|
| Table 2. U.S. index combining temperature and humidity (from Heidorn, 1998). | |
| 80-90°F (27-32°C) |
Fatigue possible with prolonged exposure and/or physical activity. |
| 90-105°F (32-41°C) |
Heat cramps and heat exhaustion possible with prolonged exposure and/or physical activity. |
| 105-130°F (41-54°C) |
Heat cramps or heat exhaustion likely and heatstroke possible with prolonged exposure and/or physical activity. |
| 130 °F or higher (>54°C) |
Heatstroke highly likely with continued exposure. |
A similar index (Table 3) has been designed for Canada which also relates temperature and humidity effects to comfort level.
| Humidex | Comfort Level |
|---|---|
| Less than 29 °C | No discomfort |
| Table 3. Canadian index combining discomfort effects of temperature and humidity (from Heidorn, 1998). | |
| 30 to 39 °C | Some discomfort |
| 40 to 45 °C | Great discomfort; exertion should be minimal |
| Above 45 °C | Dangerous conditions, exertion should be avoided |
| Above 54 °C | Heat stroke imminent |
We can inquire as to where these temperatures are likely to occur. A map of the average annual temperature over the world (Figure 3) indicates that many equatorial countries are exposed to temperatures that could be classified as uncomfortably hot.
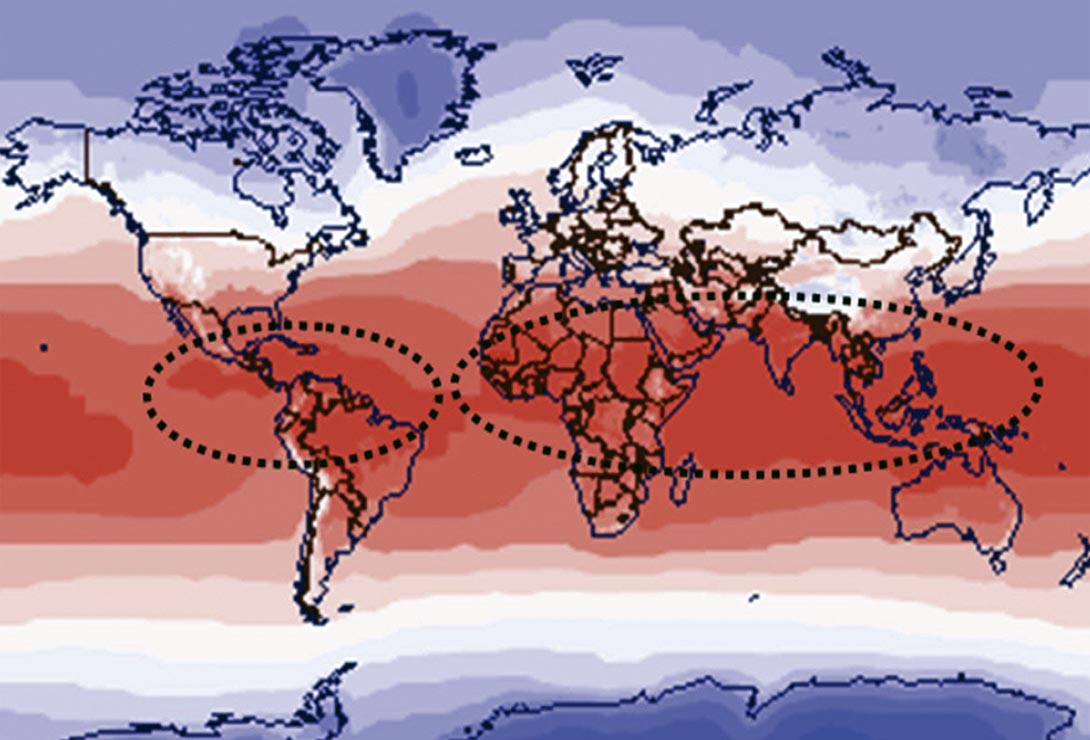
Some travelers and workers may have noticed that visiting tropical or equatorial regions can entail an adventure into a less “developed” world. Clearly, there are many wonderful things about equatorial countries (e.g., sunshine, diverse wildlife, foodstuff variety, fascinating histories, vibrant cultures, emergent industries). Furthermore, what constitutes “developed” is certainly controversial. However, daily life may be a grim struggle for many near the equator – for example, a recently released Gallup (2011) poll indicates that a “thriving” well being was generally lowest in sub-Saharan Africa. Transparency International (TI, 2011) is an international non-governmental organization devoted to combating corruption. Its International Secretariat is located in Berlin and it consists of more than 85 independent National Chapters around the world, TI works at both the international and national level to curb the supply and demand of corrupt practices. TI compiles data on practices in countries around the world and publishes an annual Transparency Index. Key to TI’s relevance is that it uses surveys in the countries themselves to self-report on the perceived levels of corruption. That Corruption Perceptions Index (CPI) is used here.
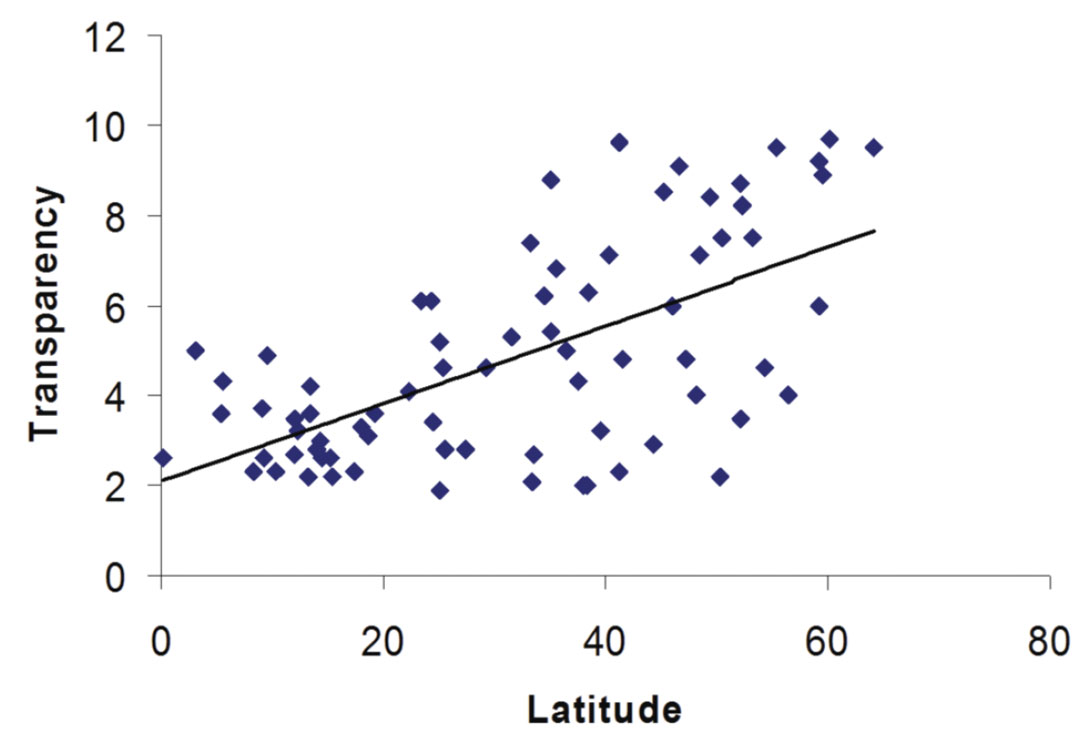
Several years ago, Jon Claerbout of Stanford University correlated political transparency (the lack of perceived corruption) with latitude – that is, countries away from the equator were generally perceived to be less corrupt. Some recent values of a country’s transparency (from Transparency International) versus the latitude of its capital city are plotted in Figure 4.
There are undoubtedly many influences on the politics of a nation as well as those on individual relationships. The Economist (2006) suggests that “Most clearly, poverty and bribery go together.” A plot of national productivity per person appears to support this (Figure 5). The Economist further suggests that while no single factor inclines a country toward corruption, “where there is a lot of government, there is a lot of bribery.”
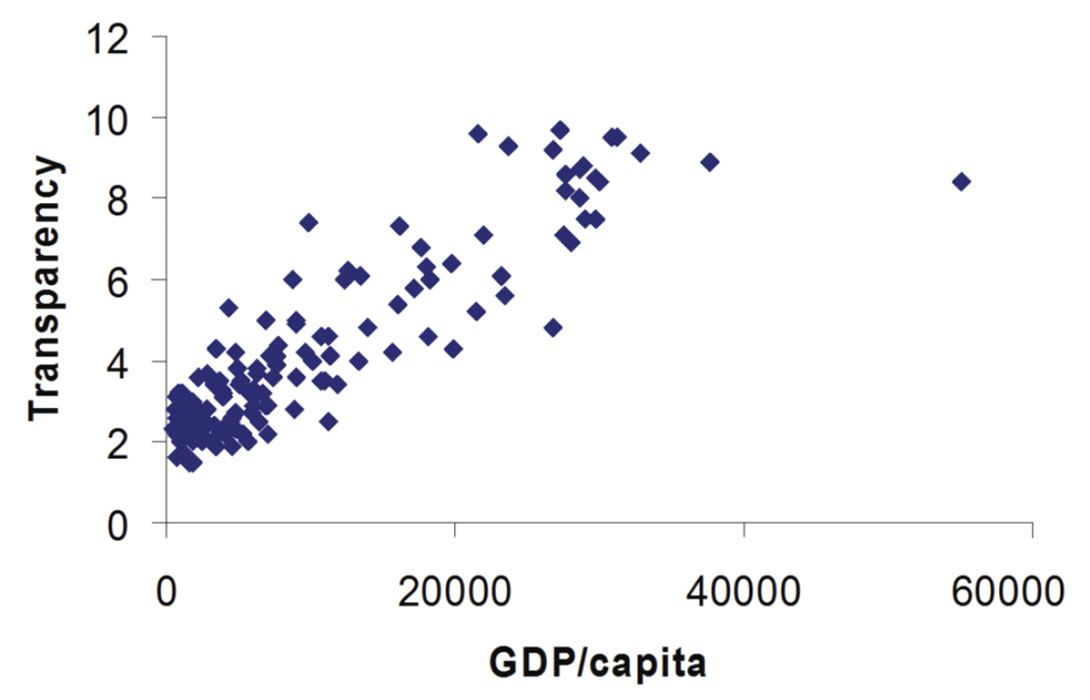
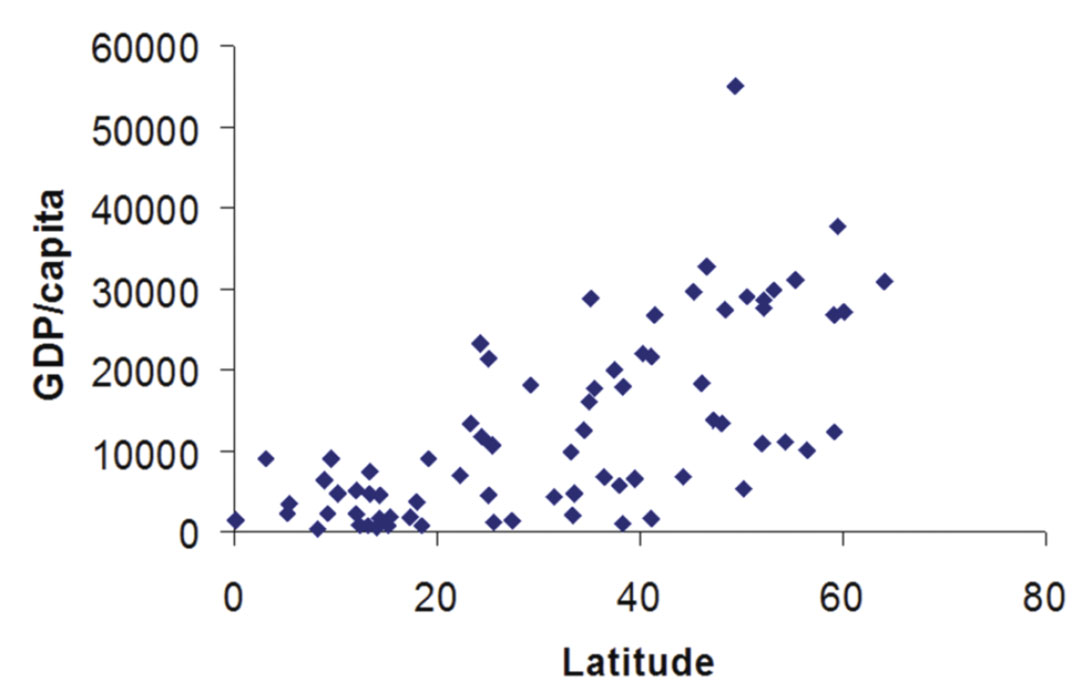
Jared Diamond in “Guns, Germs, and Steel” takes some of these observations farther and proposes reasons for why some countries are more powerful economically and militarily than others. His reasons are generally environmental: geography, relative fortune in domesticatable plants and animals, favorable climate. Economic and political freedom has even been correlated (inversely) with the price of oil (Friedman, 2006). Nonetheless, there does appear to be some association of increasing transparency with higher latitudes. A similar relationship (albeit with scatter) exists when we examine gross domestic product/capita plotted against latitude (Figure 6). Why do more northerly countries generally seem to be more productive and transparent than those near the equator? The question is important as nations struggle to increase their well-being and prosperity.
Latitude is a partial proxy for temperature. From the discussion above, we know that temperature directly affects humans. So, we need to investigate the correlation of temperature with transparency. Numerous factors affect the temperature of a location including latitude, elevation, and local geography (proximity to oceans, currents, mountains, winds, etc). However, in this work, I will take the average annual temperature of the capital city of the country to represent the temperature variable. When we plot our transparency values versus temperature of the country’s capital city (itself a proxy for the country), we find another correlation (Figure 7).
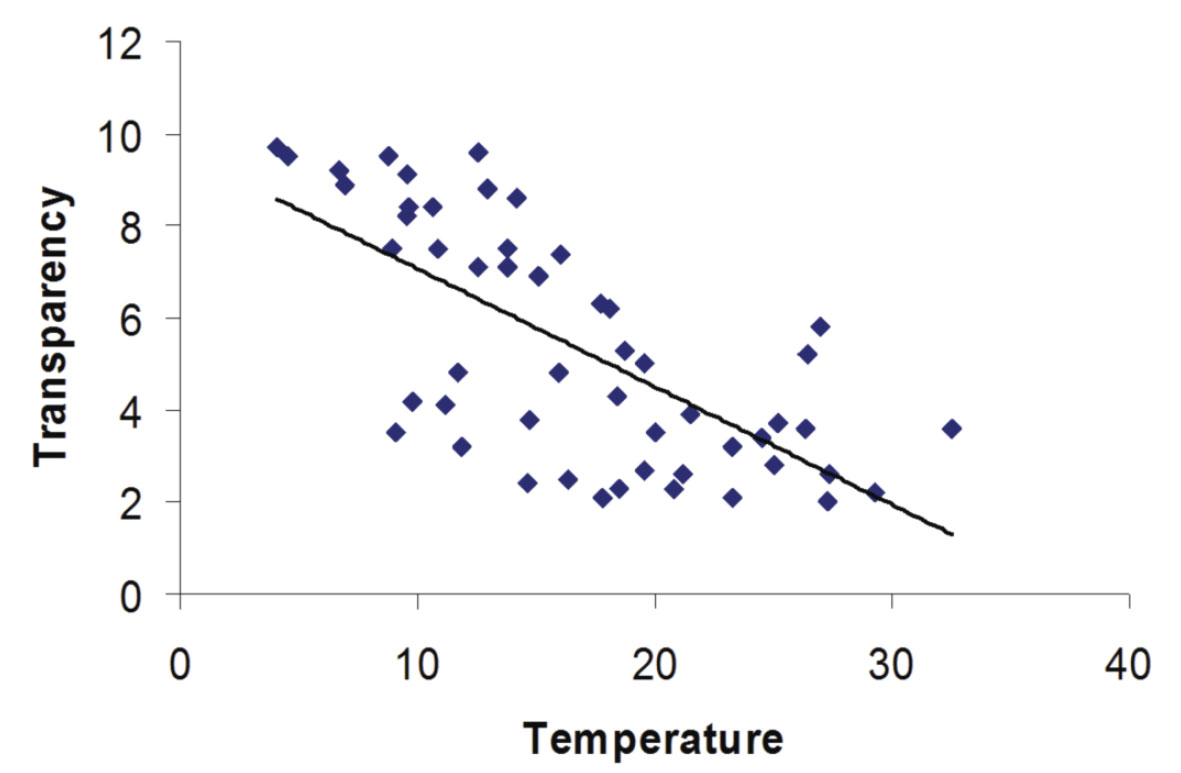
Statistical inferences, general statements about nations, and evaluations of corruption are all discussions fraught with danger, sensitivities, and misinterpretation. Correlations are not necessarily causations. Plus, there is considerable scatter in the data as shown. But, it does seem that as average temperatures increase there is less transparency. If global temperatures increase in the future, will that have implications for governance?
Discussion
So heat makes us uncomfortable (possibly irritable), less able to learn, fatigued, inaccurate, and less productive. However, life must go on and some tasks need to be performed. Can thermal discomfort lead people to try to find easier ways to do things; cut corners; not bother to undertake some necessary activities; have others do work for them either by unseemly means or force? All in all, people are not necessarily acting at their best when they are hot. This may lead to questionable practices and corruption.
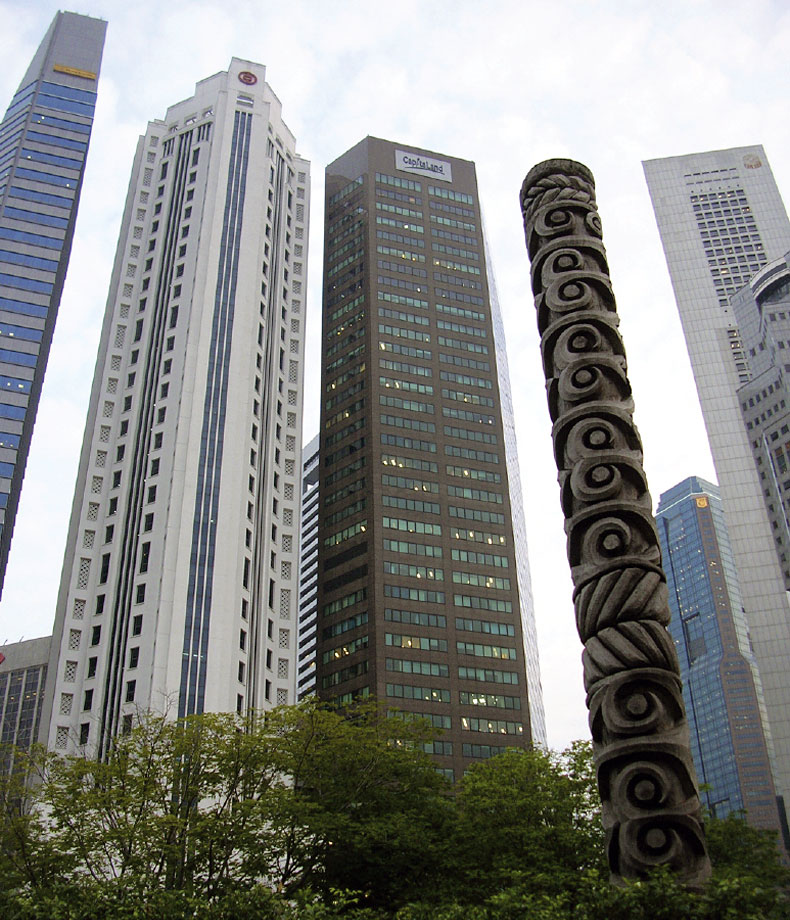
Now, Singapore is near the equator and so, according to the previous correlations, should have a low transparency, but that is not the case. The city-state is reported to be quite transparent. Does this refute the temperature-transparency thesis? Perhaps not. In fact, Lee Kuan Yew, the first elected Prime Minister of Singapore (Figure 8), was famous for his oft-quoted statement that air-conditioning was the most useful invention of the millennium. Lee suggested that air-conditioning, “lifted the tropics out of their traditional torpor to the energy levels of those in the more temperate climates.” (Stephens, 2001). Often, where there is advanced work being accomplished in the tropics (Figure 9), it will be in an air-conditioned (that is, cool) office.
On the other hand, Russia should be fairly transparent according to temperature. It is not evaluated as so. Other factors are certainly at work. However, Anderson et al., (1996) have suggested that both hot and cold temperatures can increase untoward behavior. Uncomfortable cold may have a negative effect as does excessive heat for some countries. However, humans have been able to warm themselves for thousands of years via fires, insulating with heavier clothing, and seeking some kind of shelter. It is generally easier to warm than cool as becoming cooler requires more technical sophistication. Of course, one can rest under a shady tree, swim, shower, or use a fan. However, most of these cooling techniques are short-lived, require effort, or imply forgoing other necessary activities. Sustained cooling had to wait for the advent of refrigeration – an energy-intensive process. Wide-spread heating is taken for granted, but nonetheless, where it is compromised there could be transparency effects.
Sometimes culture or even origin are blamed for sorry practices; the intent of this paper is to further challenge those notions and seek other underlying causes.

Conclusion
Elevated temperatures make us uncomfortable. We are less able to learn, work, and generally perform tasks. Thermal discomfort saps the ability to work on one’s own behalf and, perhaps more so, for the benefit of others. Countries toward equatorial latitudes are largely warmer as are their capital cities. The political transparency of a nation is somewhat correlated with the latitude and temperature of the nation’s capital. If there is a casual relationship between corruption and elevated temperature, there are a number of possible reasons for it: These could include less comfort, lowered activity, less efficiency, compromised ability to learn, lowered interest or ability do work oneself, more difficult working conditions. Nonetheless, there is considerable scatter in the transparency data. This undoubtedly has to do with a number of other factors, including the other end of the temperature spectrum: Discomfort from cold. However, given the relative ease of heating versus cooling, comfort may be more easily gained in northern environments. If there is a relationship between temperature and political transparency, corruption may well be lessened by air-conditioning.

Acknowledgements
I appreciate the efforts of Dr. Zimin Zhang (formerly of the University of Calgary, now Shell Oil, Calgary) and Mr. Jeff Thurston, formerly of the CREWES Project at the University of Calgary, for helping assemble data used in this paper. This paper is a continuation of an article first published in the 2007 CREWES Research Report. I express my gratitude for the general support of the CREWES Project; however, all of the opinions expressed here are solely those of the author.


Join the Conversation
Interested in starting, or contributing to a conversation about an article or issue of the RECORDER? Join our CSEG LinkedIn Group.
Share This Article