Abstract
In the last ten years, it has become recognised that crack-induced shear-wave splitting, with azimuthal anisotropy, is an inherent characteristic of almost all rocks in the crust (and upper mantle). This indicates that most in situ rock is pervaded by stress-aligned fluid-saturated cracks. The evolution of such stress-aligned fluid-saturated grain-boundary cracks and pore-throats in response to changing conditions can be calculated, in some cases with great accuracy, by anisotropic poro-elasticity (APE). APE is tightly constrained, yet dynamic modelling with APE currently matches a large range of phenomena about anisotropy, shear-waves, and cracks. In particular, APE has allowed the anisotropic response of a reservoir to injection pressures to be calculated (predicted), and the time and magnitude of an earthquake to be correctly stress-forecast from observations of shear-wave splitting. The reason for this calculability and predictability is that the microcracks in the crust are so closely spaced that they form a critical system. This is a new style of geophysics which has profound implications for almost all aspects of pre-fracturing deformation in the crust.
The past, present, and future speculations about shear-wave splitting are briefly reviewed. Shear-wave splitting is seen to be a dynamic measure of the deformation of the rock mass. There is bad news and good news for hydrocarbon recovery. Many accepted features are no longer valid at high spatial and temporal resolution, but at least in some circumstances the behaviour of reservoirs may be calculated, predicted, and possibly controlled by feedback. We need to exploit these new opportunities of the crack-critical crust.
1. Introduction
Shear-wave splitting is not a fixed property, a measure of the anisotropy of the rock mass, that can be recorded, classified, interpreted, and henceforth (possibly) ignored. Shear-wave splitting is monitoring a new understanding of dynamic rock deformation. If conditions change the shear-wave splitting responds to the changed rock mass or reservoir. This has major implications for producing oil (as well as many other Earth Science activities). Shear-wave splitting is integral to all high-resolution detailed evaluations of the behaviour of in situ rock.
This review indicates that shear-wave splitting is a measurement monitoring the dynamic internal deformation of fluid-saturated microcracks in in situ rock, and that changes in splitting are controlled by the same parameters that control the low-level (prefracturing) deformation. More-over, since the evolution of fluid-saturated microcracks can be modelled, the effects of known changes can be calculated, so that in effect, the response of the rock mass can be predicted. There is one example to date where the response of a reservoir to two known fluid injections was successfully predicted, and one example where the time and magnitude of an M=5 earthquake was successfully stress-forecast. This development is believed to be a fundamental advance in understanding fluid-rock interactions before fracturing occurs.
Shear-wave splitting (seismic birefringence) is the most diagnostic, informative, and easily observable feature of azimuthal seismic anisotropy (Crampin, 1981, 1985). The last ten years have seen remarkable progress. Azimuthal anisotropy is now recognised as characteristic of the fluid-saturated stress-aligned grain-boundary cracks and pore-throats in almost all rocks (Crampin, 1994, 1996; Winterstein, 1996). This means that any interpretation of in situ rock, which does not allow for the presence of compliant stress-aligned fluid-saturated microcracks is at best incomplete and at worst significantly in error. During these ten years, the evolution of fluid-saturated cracks under changing conditions has been modelled with anisotropic poro-elasticity (APE) (Zatsepin & Crampin, 1997). Since APE-modelling broadly agrees with all relevant observations of cracks, stress, and shear-waves anisotropy (Crampin, 1999a), we can justifiably claim that we are at last beginning to understand how distributions of fluid-saturated cracks behave in in situ rock (Crampin & Zatsepin, 1997).
There are limited calibrations of APE in laboratory stress cells (Zatsepin & Crampin, 1996; Crampin et al., 1997, 1999b), and currently, there are few examples where the effects of APE can be effectively in in situ rock. These various results confirm that APE is at least a good first-order approximation to rock deformation and show that the deformation of in situ rock can be calculated and in appropriate circumstances predicted (Crampin, 1999a). These ideas have stimulated the development of a Stress- Monitoring Site (SMS) using state-of-the-art borehole instrumentation to monitor shear-wave splitting between existing boreholes which happen to be in a suitable configuration (Crampin et al., 2000; Crampin, 2001). SMSs should be able to identify the build up of stress before earthquakes and volcanic eruptions.
This is remarkable progress. However, the implications of why the response of the immensely complicated heterogeneous/inhomogeneous crust below 500m-1km, say, should be calculable, monitorable with shear-wave splitting, and in some cases the response predictable, is even more remarkable. The fluid-saturated cracks in the crust (and probably upper mantle, Crampin, 1995; Blackman & Kendall, 1997; Mainprice, 1997) are so closely spaced and so near fracture-criticality at the percolation threshold that the cracks behave as critical systems (Crampin, 1998, 1999a; Crampin & Chastin, 2000). [Fracture-criticality is the level of cracking when shear-strength is lost and the rock necessarily fractures (Crampin, 1994; Crampin & Zatsepin, 1997).]
Critical systems of cracks are a new style of geophysics, with profound implications for the detailed high-resolution properties of in situ rock (Crampin, 1999a). If current levels of detail and resolution are satisfactory, then the crack-critical nature of the crust can be ignored; however, if greater detail and higher resolution are required, then the crack-critical crust influences almost every measurement. In particular, there are likely to be profound effects on reservoir characterisation and oil recovery (Crampin, 1999b).
The future of shear-wave splitting and seismic anisotropy is a very broad field with many implications and applications. The past, present, and speculations about the future of shear-wave splitting will be briefly reviewed.
2. Shear-Wave Splitting – The Past Ten Years
Shear-wave splitting (seismic birefringence), where shear-waves split into typically two approximately orthogonal fixed-polarisations with different velocities is characteristic of propagation in media with some form of elastic anisotropy (Crampin, 1981). Such splitting writes easily recognisable signatures into the three-component particle motion of shear-wave arrivals, so that shear-wave splitting is the key diagnostic phenomenon for analysing seismic anisotropy.
2.1 Note that TIV-anisotropy will not be discussed
[editor’s note: also known as VTI-anisotropy]
TIV-anisotropy is transverse isotropy (hexagonal anisotropic symmetry) with a vertical axis of symmetry where the shear-waves split into strictly SH- and SV-polarisations. Such symmetry is characteristic of finely-layered horizontal sedimentary strata due to the interactions of thin layers. It is also characteristic of many shales, clays, and mudstones, where the anisotropy is caused by horizontal platelets of mica and other clay minerals. Such TIV-anisotropy has different vertical and horizontal move-out velocities which causes severe problems in migration and in establishing well ties in exploration seismics. These problems are comparatively well understood and can be accommodated by processing (Tsvankin, 2001), although, like almost all anisotropy, the behaviour in in situ rock is only recently being effectively calibrated (Winterstein & De, 2001).
Thus TIV-anisotropy is well understood and has few surprises left. Almost the only geophysical information it carries is that the rock was laid down in some sort of sedimentary process in some sort of fluid, and that gravity is vertical. We shall not refer to TIV-anisotropy again except in passing.
2.2 Shear-wave splitting with azimuthal anisotropy
This review refers specifically to shear-wave splitting varying azimuthally, sometimes called, not wholly correctly, TIH-anisotropy - transverse isotropy with a horizontal axis of symmetry. TIH-anisotropy is the elastic symmetry of parallel vertical cracks typically aligned, like hydraulic fractures, perpendicular to the direction of minimum compressional stress. Such symmetry leads to the polarisation of the faster shear-wave being parallel to the direction of maximum horizontal stress in a broad band across the shear-wave window. It is such approximately parallel polarisations which are the characteristic feature of observations of shear-waves in most types of rock (Crampin, 1994). The polarisations are only approximately parallel because microcracks have a range of orientations with crack normals averaged about the direction of minimum compressional stress, which means that the anisotropic symmetry is only approximately TIH. [The shear-wave window is the cone of ray paths with angles of incidence to the free surface of less than 35° to 45° (depending on details of near-surface structure), in which unperturbed shear-waves can be observed at a free surface (Booth & Crampin, 1985).]
Ten years ago, Crampin & Lovell (1991) published a review of the first decade since stress-aligned shear-wave splitting was first positively identified in records within the shear-wave window above small earthquakes (Crampin et al., 1980). Crampin & Lovell asked three questions about shear-wave splitting: what does it mean? what use can we make of it? and what should we do next? Although substantial progress has been made, reviewed below, these questions are still relevant. We believe we are beginning to understand the answers, which are very exciting, although they are not always the answers we expected.
2.3 What does shear-wave splitting mean?
Crampin (1994, 1996) and Winterstein (1996) reviewed all the then available (~80) examples of shear-wave splitting recorded above small earthquakes and in exploration record-sections, principally vertical seismic profiles. With the few exceptions of the TIV-anisotropy mentioned above, all sedimentary, igneous, and metamorphic rocks below 500m to 1000m display azimuthal stress-aligned shear-wave splitting. There is a minimum shear-wave velocity anisotropy (SWVA) of about 1.5% and a maximum in ordinary unspecified rock of about 4.5%. Higher values of SWVA are found nearer the surface and in heavily fractured rocks and areas of high heat flow.
The polarisations of the faster waves are sub-parallel to the direction of maximum horizontal stress. Since the only phenomenon common to all rocks which has such symmetry is stress-aligned microcracks, this strongly suggests that the shear-wave splitting observed in most rocks is caused by cracks - the extensive dilatancy- anisotropy (EDA) of Crampin et al. (1984). It can be shown that the percentage SWVA of parallel cracks is approximately equal to a 100 times the crack density (Crampin, 1994), so the values of observed SWVA indicate crack densities of 0.015 ≤ ε ≤ 0.045 in ostensibly-intact rocks. Since ε = N a3/v, where N is the number of cracks of radius a in volume v, this range of SWVA indicates a very narrow range of crack sizes. There is a difference in radius of less than a factor of two between the minimum crack density usually observed below 500m to 1000m and rocks which are desegregating at the free surface. Such crack distributions typically lead to time-delays (normalised to a path length of 1km) of less than about 8 to 10 ms/km in most in situ rocks.
Fluid-saturated microcracks are highly compliant, and the evolution of fluid-saturated grain-boundary cracks and pore-throats under changing conditions can be modelled by anisotropic poroelasticity (APE). The driving mechanism is fluid migration by flow or diffusion along pressure gradients between cracks at different orientations to the stress field. Figure 1 is a schematic but numerically accurate illustration of the effect of the APE deformation mechanism on random distributions of vertical cracks as the maximum horizontal stress is marginally increased. Hexagons have isotropic elastic symmetry so the two (solid) hexagons of cracks, at zero differential stress (top left), are a small selection of randomly oriented cracks. As stress increases, stress-induced pressure gradients cause fluid to move between adjacent cracks at different orientations to the stress field (top right), but until the stress is sufficient to close normally-oriented cracks, there is negligible anisotropy. At the critical stress, normalised to one, cracks begin to close (bottom left) and immediately the level of shear-wave velocity anisotropy jumps from zero to close to the 1.5% actually observed in the crust (Crampin, 1994). As stress increases, the cracks increase in aspect ratio and begin to line up. It can be shown that the percolation threshold when the mechanism in Figure 1 leads to through-going cracks is at about 5.5% SWVA, which can be identified with fracture- criticality (Crampin & Zatsepin, 1997). APE shows that the parameters that control low-level deformation before fracturing occurs are exactly those that control shear-wave splitting.
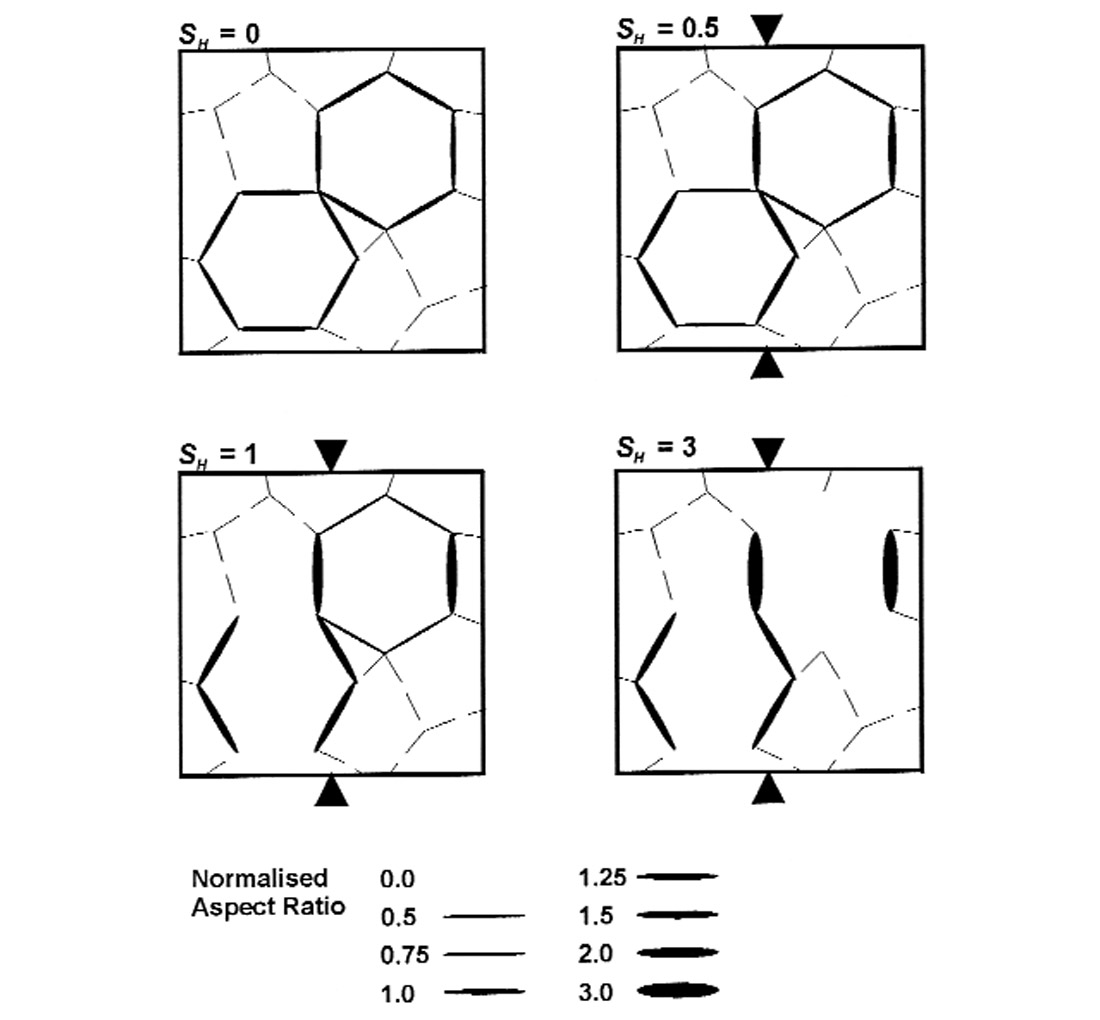
APE is highly constrained with no free parameters yet matches a wide range of phenomena, some of which are listed in Table 1 (Crampin, 1999a, 2000). The match of observations to model in Table 1 is often very accurate. It includes observations of shearwave splitting above earthquakes, where the build up of stress causes changes in shear-wave splitting in those particular directions sensitive to changing aspect-ratio. APE shows that increasing stress causes the level of SWVA to vary. Note that the crack density in Figure 1 is lower at sH = 3 than at sH = 0, as increasing stress tends (not surprisingly) to close cracks and hence lessen shearwave anisotropy. The only unambiguous change as stress increases is the increase in the average crack aspect-ratio. The effect of increasing the aspect-ratio of parallel vertical cracks on shear-wave splitting is to increase the average time-delay along ray paths in directions (known as Band-1) making angles 15° to 45° to the plane of the cracks (Crampin, 1999a). Time-delays in Band-2 (directions ±15° to the crack plane) are sensitive only to crack density. Table 1 also lists matches of APE in hydrocarbon seismology and behaviour before earthquakes (see next section), as well as with laboratory experiments in stress cells.
| STATIC EFFECTS | Ref. (Obs.) | Ref. (APE) | |
|---|---|---|---|
| Table 1. Match of APE*-modelling to observations (Crampin, 1999a, updated ). | |||
| Field observations of SWVA‡ (below 1km-depth) | |||
| 1) SWVA in all rocks independent of porosity and geology. | [1] | [2] | |
| 2) Minimum SWVA in intact rock: observed ≈ 1.5%; APE-modelled ≈ 1.0%. | [1] | [2] | |
| 3) Maximum SWVA in intact rock: observed ≈ 4.5%; APE-modelled ≈ 5.5%. | [1] | [2] | |
| 4) Narrow range of crack density: 0.025 ≤ ε ≤ 0.045. | [1] | [2] | |
| 5) Proximity of fracture-criticality (at percolation threshold) ≈ 5.5%. | [1] | [2] | |
| Other field observations | |||
| 6) Fracture-criticality limit specifies crack distributions with a range of dimensions of about 9 orders of magnitude. | [3] | [4] | |
| 7) #π/2 shear-wave polarisation changes (90°-flips) in over-pressurised reservoirs. | [5,6] | [2,5,6] | |
| DYNAMIC EFFECTS | |||
| Temporal changes in SWVA during production procedures | |||
| 8) Changes before and after pumping tests. | [7] | £ | |
| 9) #Changes before and after high-pressure CO2-flood in carbonate reservoir | [6,8] | [6] | |
| Temporal changes in SWTDÜ before earthquakes | |||
| 10) #Variations of time-delays before earthquakes (with hindsight). | [9,10] | [2] | |
| 11) #Successful forecast of time and magnitude of M=5 earthquake in SW Iceland. | [9] | £ | |
| Temporal changes in SWTD before volcanic eruption | |||
| 12) #Variations in SWTD for some 5 months before 30th Sept., 1996, Vatnajˆkull eruption, Iceland, at distances of: 230km and 200km WSW; 170km SW; and 240km, N. | [11] | £ | |
| Variations of shear waves in laboratory experiments | |||
| 13) Variations of SWVA and permeability in uniaxial stress cell. | [12] | [13] | |
| 14) #Variations of (isotropic) shear-wave velocities to changes in confining pressure and pore-fluid pressure for oil-, water-, and gas- (dry) saturations in stress cells of sandstone cores. | [14] | [14] | |
| 15) #Variations of velocity and attenuation from sonic (transducers) to seismic (resonant bar) frequencies. | [15] | [16] | |
| *APE - anisotropic poro-elasticity; ‡SWVA - shear-wave velocity-anisotropy; #Including recent examples; |
£Effects compatible with APE SWTD - shear-wave time-delays; |
||
| [1] Crampin (1994); [2] Crampin & Zatsepin (1997); [3] Heffer & Bevan (1992); [4] Crampin (1997, 1999a); [5] Crampin et al. (1996); [6] Angerer et al. (2000, 2001); [7] Crampin & Booth (1989); [8] Davis et al. (1997); [9] Crampin et al. (1999a); |
[10] Booth et al. (1990), Crampin et al. (1990, [2] Crampin & Zatsepin (1997); 1991), Liu et al. (1997), Gao et al. (1998); [11] Volti & Crampin (2001); [12] King et al. (1994); [13] Zatsepin & Crampin (1996); [14] Crampin et al. (1997, 1999b); [15] Sothcott et al. (2000a, 2000b); [16] Chapman et al. (1998, 2000). |
||
It is this wide range of agreement of APE-modelling to observations that confirms that the shear-wave splitting with azimuthal variations observed in the crust is typically caused by stress-aligned fluid-saturated microcracks. Large cracks would be stiff and much less compliant. Note that shear-wave splitting is controlled by the crack/pore-throat geometry, and is to a first order independent of the non-crack porosity (equant porosity) (Crampin & Zatsepin, 1997).
The large number of dynamic effects in Table 1 confirm that fluid-saturated cracks make the rock mass highly compliant - if internal conditions in the rock mass are changed in any way, the crack geometry responds, and the response can be monitored directly with shear-wave splitting, and modelled or predicted by APE. Certainly large fractures, if they are aligned, will cause significant shear-wave splitting. However, the only confirmed observations, to my knowledge, are those of Mueller (1992) and Li et al. (1992) in the Austin Chalk, and Angerer et al. (2000, 2001) in Vacuum Field, New Mexico (who models a structure of large fractures and compliant microcracks). Large cracks are comparatively stiff, and the reports in Table 1 suggest, and the results of Angerer et al. (2000, 2001) confirm, that the dominant cause of shear-wave splitting is propagation through the compliant fluid-saturated grain-boundary cracks and pore-throats (microcracks) that pervade most rocks. The effects in Table 1 have been discussed in more detail elsewhere (Crampin, 1997, 1999a, 1999b, 2000).
3. Shear-Wave Splitting – Current Position
Here we attempt to answer the second question of Crampin & Lovell (1991), “What use can we make of it?” The last two years have seen several applications of shear-wave splitting.
3.1 Predicting the response of reservoirs to known changes during recovery processes
Angerer et al. (2000, 2001) analysed, interpreted, and modelled (in effect predicted) the response of the Vacuum Oil Field, New Mexico, to two CO2-injections resulting in pressure increases of 1000psi (an over-pressure), and 200psi, respectively. These were Phases VI and VII of the Reservoir Characterization Project of Colorado School of Mines (Davis et al., 1997; Duranti et al., 2000). The part of the Vacuum Oil Field accessed had a flat layer-cake structure.
Extensive 4-D 3-C reflection record sections suggested that changes in shear-wave splitting were the most diagnostic effects of both CO2- injection pressures (Davis et al., 1997; Duranti et al., 2000). Angerer et al. (2000, 2001) processed the Phase VI records and determined an initial structure of large fixed faults with an internal microcrack structure with 2% SWVA. Synthetic seismograms, calculated by ANISEIS (Taylor, 2000), through the initial model reproduced the shear-wave splitting arrivals in Figure 2a from reflections from the top and bottom of the San Andres Formation target zone, where the CO2 was injected. The three sections in Figures 2a and 2b are the horizontal S1- and S2-polarisations, parallel and perpendicular to the maximum horizontal stress, and the vertical P-wave polarisation. The time-delays between the top and bottom reflections of the target zone in Figure 2a are 176ms for S1 and 178ms for S2, indicating that S1, polarised parallel to the maximum horizontal compressional stress, is the faster split shear-wave in the target zone. [Other investigations at RCP identified the reflections from the target zone, where the other arrivals are various reflections and reverberations.]
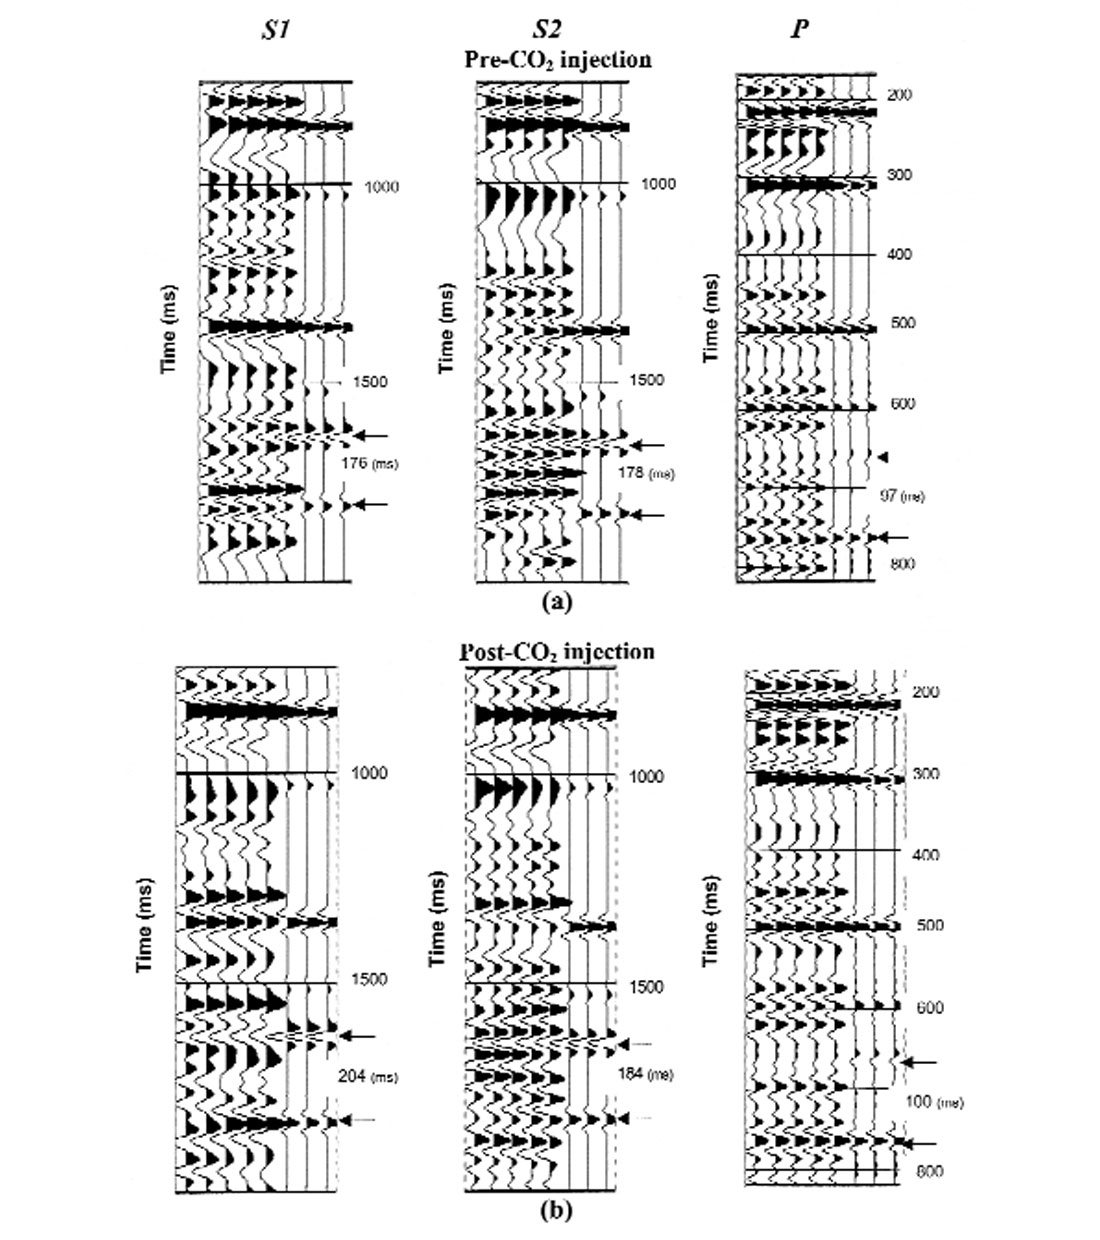
The five traces in the left-hand side of the record sections in Figure 2b show significant changes following the high-pressure CO2-injection. The three modelled traces to the right are calculated by inserting the specific injection pressure into the APE-model of the initial fracture model in Figure 2a. The match of observed to modelled arrivals is again good so that APE has correctly calculated (in effect predicted) the response of the cracked rock mass to the injection pressure. [Note that the changes to the P-wave arrivals also match, but P-wave arrivals contain little information and are essentially easy to match.] APE shows that the difference in the shear-wave response is largely caused by the increased aspect-ratio as the cracks expand with the increased pore-fluid pressure (Angerer et al., 2001).
A similarly satisfactory match was also found for the lower pressure Phase VII CO2-injection (not shown), using the same initial cracked model and inserting the lower pressure in APE. The Phase VII injection was in a similar well with varying conditions with a lower injection pressure. This means that APE has in effect predicted the response of the microcrack structure to two separate injection pressures. This is the best in situ calibration of APE to date.
Figure 2 shows another characteristic of shear-wave splitting. In contrast to Figure 2a, where S1 is the faster wave through the San Andres Formation, in Figure 2b, S2 is faster with a time-delay of 184ms as opposed to 204ms for S1. This means that the polarisations of the faster split and slower shear-waves have interchanged. Angerer calls this a “90°-flip”. Such 90°-flips, together with large values of SWVA, are characteristic of shear-wave splitting in over-pressurised rocks. In over-pressurised reservoirs, 90°-flips have previously been observed in a Caucasus oil field (Crampin et al., 1996; Slater, 1997). Such 90°-flips are also characteristic of shearwave splitting immediately above active faults and have been observed at two places on the San Andreas Fault (Liu et al., 1997; Crampin et al., 1990, 1991) (and on the Húsavík-Flatey Fault in Iceland, not yet published). High pore-fluid pressures are needed to explain the fact that there is fault slip but no observable frictional heat flow.
Thus Angerer et al. (2000, 2001) show that, in some circumstances at least, it is possible to predict the response of a reservoir to specific oil-field operations. Since the response can be monitored by analysing shear-wave splitting, this means that the response of the reservoir to a known operation, such as a fluid injection, can be controlled by adjusting the pressure to get the intended optimised rock mass response. This means that the response can be monitored and controlled by feedback long before production rates have indicated whether the procedures were satisfactory.
Converted phases: One of the difficulties of analysing shearwaves is the expense of using shear-wave vibrator sources onshore and the lack of an efficient shear-wave source offshore. It has long been recognised that P-S converted phases are in many cases a cheaper alternative technique for generating shear-waves (Garotta & Marechal, 1987). Conversions at depth would have the advantage that shear-waves would have the higher frequencies of P-waves. Thomsen (1999) calls such converted waves C-waves and presents a strong case for their use in studying shear-wave anisotropy. The major difficulty as Thomsen recognises is that: (1) results are highly directionally dependent, if the sagittal plane is one of the preferred split shear-wave polarisations, the other split shear-wave will not be generated, with possibly misleading results; and (2) the fixed P-wave polarisations almost never give the opportunity of giving two shear-wave source orientations. This means that C-waves never give the supporting evidence of two shearwave splitting measurements along the same ray path to provide confirmation of the interpretation. Note that a further cheaper optimum technique for monitoring shear-wave anisotropy is suggested in Section 5.1, below.
3.2 Stress-forecasting the times and magnitudes of earthquakes
It had long been suspected (Crampin, 1978) that changes in shear-wave splitting might show changes of stress before earthquakes. Peacock et al. (1988) showed changes in time-delays in Band-1 of the shear-wave window above small earthquakes, which they thought indicated stress-induced changes in aspect-ratios, although this was not proven some ten years later (Zatsepin & Crampin, 1997; Crampin & Zatsepin, 1997). Unfortunately, suitably persistent swarms of small source earthquakes are very uncommon and, until 1997, changes in shear-wave splitting before earthquakes were only observed on four occasions worldwide, before two earthquakes in California (Peacock et al., 1988; Crampin et al., 1990, 1991; and Lui et al., 1997), one in Arkansas (Booth et al., 1991), and one in Hainan Island, China (Gao et al., 1998).
The breakthrough came when shear-wave splitting was monitored in the European Commission funded PRENLAB Projects (Stefánsson et al., 2000) using Iceland as a natural laboratory for earthquake prediction studies. Iceland is above a highly-seismic offset of the Mid-Atlantic Ridge. Increases in time-delays in Band-1 shear-wave splitting were observed routinely before earthquakes and before volcanic eruptions in SW Iceland (Volti & Crampin, 2001). Observations before both earthquakes and volcanoes confirm that changes of shear-wave splitting are due to the changes in the rock mass rather than associated with changes in the immediate source zone of earthquakes.
The underlying assumption is that the rock mass is weak to shear stress (all in situ cracks verge on fracture-criticality), so that the stress released by a large earthquake necessarily accumulates over an enormous volume of rock, probably tens to hundreds of millions of km3 before a M=8 earthquake. In Iceland to date, changes in shear-wave splitting have been observed before earthquakes with magnitudes between M=3.5, and M=5.6 at distances of 14km, and 43km, respectively (Volti & Crampin, 2001). The time and magnitude of a M=5 earthquake was successfully stress-forecast from the data in Figure 3 (Crampin et al., 1999a). This forecast assumed that there was a more-or-less constant rate of deformation from the movement of the Mid-Atlantic Ridge. If stress accumulates over a small volume, the rate of accumulation will be fast for a comparatively small period of time before fracture-criticality is reached and the final earthquake would be comparatively small. Whereas if the stress accumulates over a larger volume, the rate would be slower, over a longer time, but the earthquake would be larger.
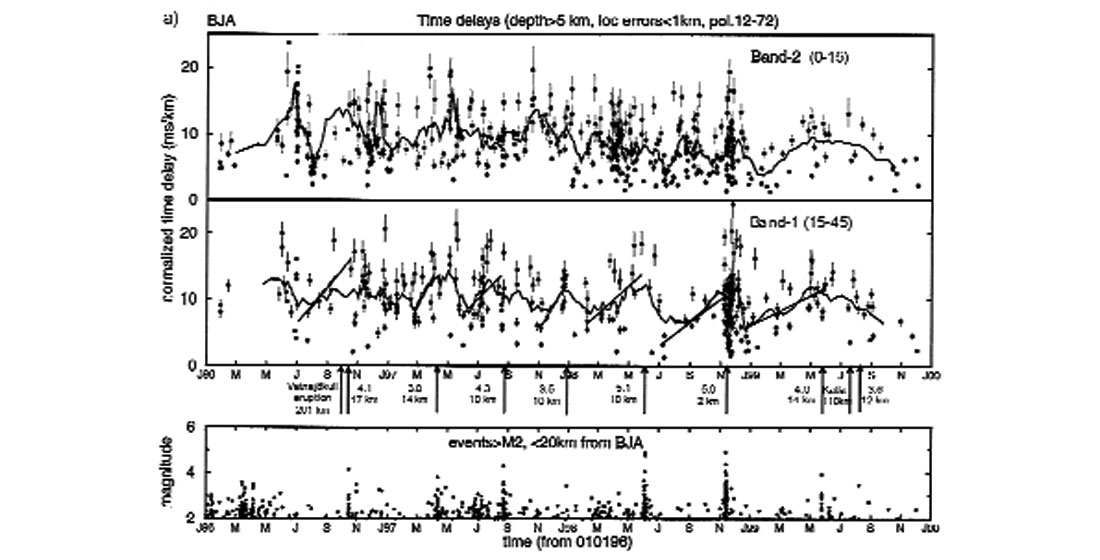
With this assumption, the time of the earthquake can be estimated from the time that the increase reaches levels of fracture-criticality, and the magnitude can be estimated from the duration of the increase, or the inverse of the rate of increase. We call this process stress-forecasting. The magnitude to duration relationship is approximately linear over the small range of magnitudes for which we have data in Iceland. The effects were recognised and the time and magnitude of a M=5 earthquake were successfully stress-forecast (Crampin et al.,.1999a). The location of the impending earthquake cannot be estimated directly from shear-wave splitting, where effects are seen to over 40km from a M=5 earthquake (Volti & Crampin, 2001). However, if it is known that a large earthquake is approaching, other precursory activity can be interpreted correctly. Ragnar Stef·nsson of the Icelandic Meteorological Office correctly predicted the location of the stress-forecast event from the continued seismicity following a previous earthquake.
Note that because of the errors in estimating both rates of increase of stress and levels of fracture-criticality, stress-forecasts need to be given in terms of a smaller-earlier to larger-later (SELL) window. Note also that the largest M=5.6 earthquake in SW Iceland since 1996 was not stress-forecast because there were insufficient earthquakes for the beginning of the increase to be recognised (Volti & Crampin, 2001).
3.3 Forecasting volcanic eruptions
The first increase of aspect-ratios in Band-1 in Figure 3, from May to September, 1996, ends at the time of the Vatnajökull eruption at the beginning of October, 1996. Following the eruption, the time-delays in both Band-1 and Band-2 of the shear-wave window show a comparatively linear decrease of about 2ms/km per year for about two years. Similar decreases are seen at distances of 240km N and 240km WSW of the Vatnajökull eruption at all seismic stations in Iceland where there are reliable measurements of shearwave splitting. This is interpreted as the relaxation in stress as the Mid-Atlantic Ridge adjusts to the new stress-regime following the eruption. It confirms that: 1) changes in shear-wave splitting are measuring the effects of changes of stress in the rock mass rather than the details of seismogenic zones; 2) shear-wave splitting is a sensitive diagnostic of small stress-induced changes to in situ rocks; and 3) the effects of increases of stress are seen at very large distances. Recently, several volcanic eruptions have disturbed the stress regime in SW Iceland and no earthquakes have been stress-forecast since 1998, although the M=5.6 event (see end of last section) might have been forecast had there been sufficient shear-wave source earthquakes.
3.4 Developing Stress-Monitoring Sites (SMSs)
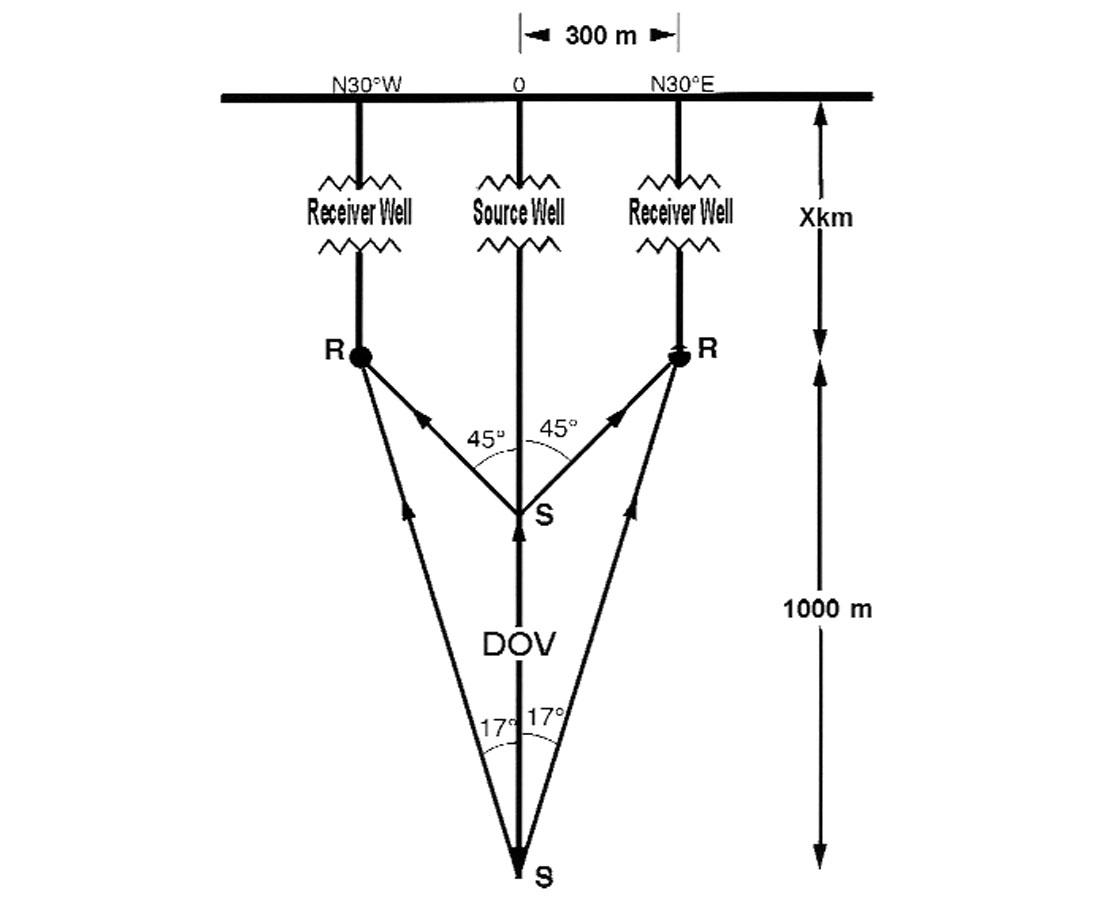
These results indicate that changes in shear-wave splitting can monitor the effects of the increase of stress before earthquakes and lead to stress-forecasting the time and magnitude of impending events. However, reliable routine stress-forecasting using earthquakes as the source of shear-waves is restricted because of the scarcity of suitably persistent swarms of earthquakes. Routine stress-forecasting away from such swarms requires controlled source seismology in Stress-Monitoring Site (SMSs) (Crampin et al., 2000; Crampin, 2001). SMSs use cross-hole seismics between boreholes measuring shear-wave splitting along the same Band-1 directions that showed the changes above small earthquakes in Figure 3. Figure 4 shows the optimum SMS geometry. Stress monitoring needs to monitor shear-waves below the uppermost 500m to 1000m of the crust to avoid the severe attenuation and scattering observed in the uppermost layers (Leary, 1995; Leary & Abercrombie, 1994).
*Protected by Patent Application PCT/GBOO/01137, filed 24th March, 2000.
The optimum source for radiating split shear-waves in SMSs is the Conoco Orbital Vibrator (Liu et al., 1993), now known as the Downhole Orbital Vibrator (DOV) which was recently commercialised by Geospace Engineering Resources Inc., Houston. The DOV is an eccentric cam swept both clockwise (CW) and counterclockwise (CCW) to exert a rotating radial pressure on the borehole wall (Cole, 1997). The sum and differences of the recorded CW and CCW signals can be processed to simulate radiation from orthogonal point forces and hence simulate radiation of orthogonal shearwave polarisations oriented with respect to horizontal pilot-geophones mounted on the DOV casing. This is exactly what is required to monitor shear-wave splitting.
The first SMS being developed is at Húsavík in Northern Iceland, where the Húsavík-Flatey Fault of the Tjörnes Fracture Zone of the Mid-Atlantic Ridge runs onshore in the northern leg of the Mid-Atlantic Ridge offset beneath Iceland (Crampin et al., 2000; Crampin, 2001; <www.smsites.org>). We are seeking funding to develop further SMSs elsewhere.
4. Shear-Wave Splitting in a Crack-Critical Crust
4.1 Critical systems
The capability of APE to model, and even predict, the response of fluid-saturated microcracked rock to changing conditions in a generally complex heterogeneous crust requires some explanation. It is thought to be because the fluid-saturated cracks in the crust form critical systems. Critical systems are dynamic interactive nonlinear processes that below criticality perturb only locally, whereas once systems reach criticality, all members of the critical system influence all other members (Ma, 1976; Jensen, 1998).
The transition temperature of equilibrium thermo-dynamics is the classical critical system, but critical systems are common in an enormous range of phenomena (Bak, 1996). Crampin (1998) and Crampin & Chastin (2000) suggest that stress-aligned fluid-saturated cracks in the Earth’s crust are also such interactive non-linear critical systems. Similar schemes for the Earth have been suggested previously in the self-organised criticality (SOC) of Bak & Tang (1989) and Bak et al. (1988). The advance here is that the micro-scale mechanism for deformation has been identified: stress-induced fluid-movement along pressure-gradients between adjacent grain-boundary cracks and pore-throats. This is a quantifiable physical process that can be modelled, monitored, and calculated by APE (Zatsepin & Crampin, 1997; Crampin & Zatsepin, 1997).
The criticality is the reason APE-modelling matches the huge range of phenomena in Table 1. Bruce & Wallace (1989) show how different critical systems have similar statistical behaviour at criticality, despite very different sub-critical physics. This is known as critical-point universality and implies the self-similar scaling seen in crack distributions (Heffer & Bevan, 1990), the well-known Gutenberg-Richter relationship (Kagan, 1992), and many other phenomena in the Earth and in rock physics (Crampin & Chastin, 2000).
Critical systems are typically sensitive to otherwise-negligible variations in initial conditions that can lead to order-of-magnitude differences as the system evolves (Bruce & Wallace, 1989). This manipulation of fluid-saturated microcracks makes in situ rock highly compliant, where the behaviour at (fracture) criticality is the occurrence of fracturing and earthquakes. Crampin & Chastin (2000) suggest that the reason for the match of the nearly parameterless APE-modelling to deformation in a complex heterogeneous Earth is because the response of such critical media is controlled by the non-linear behaviour near criticality. Consequently, the behaviour can be modelled by critical-point universality of Bruce & Wallace (1989), which is a mean field theory (Jensen, 1998).
Crampin & Chastin (2000) note that similarities in critical behaviour can be misleading. It is tempting to use simplistic models for complex Earth processes and make claims for relevance merely because they produce similar statistics and similar self-similarity. Much-quoted examples are the slider-block model of Burridge & Knopoff (1967) and the cellular automata of Kadanoff et al. (1989) and Rundle & Klein (1993). Models with SOC are widely available, but they are only phenomenological. They reproduce the statistics of SOC but offer little insight into the sub-critical physical process. Thus, the perceived similarity with some highly simplified Earth mechanism is arbitrary and largely irrelevant to a better understanding of Earth processes. The power and relevance of the APE-model is that because the small scale physical behaviour is identified and modelled correctly, APE-modelling is satisfactory over a huge range of phenomena (Table 1).
4.2 The effects of a crack-critical system with SOC.
The effects of a critical system of cracks with SOC has profound implications for classical linear geophysics. Table 2 lists some of the direct implications for conventional geophysics (discussed more fully in Crampin & Chastin, 2000). There is much bad news: many conventional assumptions are invalid when analysed at higher temporal and spatial resolution. The self-similar scaling means that: spatial and temporal heterogeneities exist at all scale lengths; Gaussian statistics (averages) are not generally appropriate; and it is not possible to reliably extrapolate from place to place or from time to time so that any measurement may degrade with time. Similarly, the sensitivity of criticality to initial conditions means that there is the possibility of long-range and long-term interactions between hydrocarbon reservoirs and between earthquakes in different regions.
| Table 2. Direct implications of distributions of cracks in the crust being critical systems with self-organised criticality, SOC (after Crampin & Chastin, 2000). |
| a) The bad news |
|---|
|
| (b) The good news when the rock mass is responding to slow changes |
|
There is some good news. In at least some circumstances, the response to given phenomena can be modelled and predicted, as exemplified by the APE-modelling of Angerer et al. (2000, 2001) and the successfully stress-forecast earthquake of Crampin et al. (1999a). If the response of the rock mass to known changes can be predicted, in some circumstances the response can be controlled by feedback (Table 2, b4).
However, these advantages are only valid if natural processes are given time to evolve. Jensen (1998) shows that SOC behaviour must be expected only in “slowly driven, interaction-dominated threshold systems”. One essential ingredient is that the system evolves slowly from a marginally stable state of meta-stability toward a threshold. In the earth, the critical state at the threshold is fracture-criticality at the percolation threshold, when fracturing, faulting, and earthquakes occur. As the threshold is reached there is fracturing and the system relaxes to another meta-stable state. The slow drive is necessary in order for the intrinsic properties of the system to have sufficient time to control the dynamics (a continuous stream of sand on a sand pile would not have the discrete avalanches characteristic of SOC). The reader is referred to Crampin & Chastin (2000) and the references therein for further discussion.
5. Shear-Wave Splitting - The Future: What Should We Do Next?
Some of the direct practical implications of crack-critical systems with SOC are listed in Table 3 with specific implications for hydrocarbon exploration and recovery. These various results have profound implications for much of conventional reservoir characterisation and hydrocarbon recovery, and much other solid Earth geophysics. The implications are mostly detailed, largely but not exclusively, second-order effects. However, if conventional understanding and accuracy are satisfactory and sufficient, the effects of the crack-critical system in the Earth’s crust and mantle may be largely neglected. However, if better, more detailed, spatial and temporal resolution is required, then the implications of crack-critical systems need to be exploited. If we wish to recover more than the (typically) 30%-40% of the oil in place usually recovered, or if we wish to predict the time and magnitude of earthquakes, we need to take advantage of the good news in Table 2 and exploit the practical implications in Table 3.
Note that Crampin & Chastin (2000) do not claim that the lists in Tables 2 and 3 are complete. Merely that there is some, often indirect, evidence for each listed item, so that Tables 2 and 3 are valid to the present state of our understanding. There will certainly be further bad news, good news, and practical implications in the future, when we understand the crack-critical crust rather better than we do now.
The next four sections list four applications directly leading from the recognition of crack-critical systems, and a variety of other possibilities.
5.1 Monitoring hydrocarbon recovery with single-well imaging
The observation that many reservoir parameters display self-similar distributions, such as crack distributions (Heffer & Bevan, 1990), and the 1/f-noise characteristic of well-logs (Leary, 1991; Bean, 1996; Bak et al., 1987), means that the larger the data sample, the larger the possible variation. Consequently, Gaussian averages are no longer valid (Table 2), (except in particular limited circumstances). Similarly, the critical system implies that measurements no longer have temporal and spatial stability, and vary with time and place with temporal and spatial stability heterogeneity. This means that the whole basis of conventional reservoir characterisation is no longer well founded. We need to devise new strategies.
Table 2b suggests that measurements are valid only at the time and place they are taken. Additionally, all surface based measurements, source and/or receiver, are limited in resolution by passage through the absorption and scattering in near-surface structures (the uppermost 500m to 1000m, at least) (Leary, 1995; Leary & Abercrombie, 1994). This means that passage through near-surface layers is typically limited to less than about 80Hz P-waves and 20Hz shear-waves. Consequently, to obtain measurements with sufficient resolution to improve on current practice, in hydrocarbon production, for example, requires taking measurements at the time (during production) and place (in the reservoir) they are required. One way, possibly the only way, to measure such properties is by a single-well imaging configuration (Crampin et al., 1993; Peveraro et al., 1994; Crampin, 1999b). Single well imaging is where a string of three-component geophones, inserted behind casing or behind tubulars in the producing well, records signals from a pulsed in-line source. The signals recorded within a production zone will be scattered from the internal structure within the reservoir.
It is suggested that the only way to monitor the detailed fluid-fluid fluid-rock interactions during hydrocarbon production, which are likely to be dominated by the behaviour and statistics of the crack-critical systems discussed in this paper, is by single-well timelapse imaging: analysing the changes in scattering induced by movements of fluid-fluid fronts within the producing reservoir. Appropriate instrumentation for strings of receivers and borehole shear-wave sources in a single-well configuration has recently become available. It is believed that the application problems for single-well-imaging have been solved, and single-well deployment would be much cheaper than 4-D 3-C reflection profiles, and getting high frequency signals and resolution into the centre of the producing reservoir would be possible.
5.2 Greater recovery at slower production rates
The crack-critical crust also has implications for the behaviour of the reservoir. To take advantage of the good news in Table 2b, a crucial requirement is that any induced change must be sufficiently slow to leave ample time for natural stress-relaxation phenomena to occur, and for fluids to percolate unforced, for example. Calculable APE behaviour depends on SOC, and a requirement for SOC is that it is slowly driven (Jensen, 1998). Fast changes, which do not allow stress relaxation, would deliver the bad news in Table 2a (the tendency for the reservoir to behave chaotically, irregularly, and unpredictably) without any mitigating advantages. This is the current situation where maximum production rates are sought but only a relatively small proportion of oil in any reservoir can be extracted. Over-driven fluid-fluid interactions are irregular and unpredictable, and surface-based seismics do not have sufficient resolution to monitor the progress in detail, hence the need for the single-well imaging in the previous section. There is likely to be real chaos in fast driven processes, not merely calculable deterministic chaos. This suggests that producing reservoirs are likely to behave in more regular ways (and more likely to achieve their expected production targets), if production rates are sufficiently slow to allow stress relaxation as production proceeds.
There are many examples of over-mature reservoirs where nodding donkeys continue to produce useful oil-to-water percentages at very slow production rates. This review suggests that some of these fields may produce a larger proportion of their initial reserves at slow production rates than those with more aggressive production strategies. It is also suggested that to take advantage of a slower higher production requires slower production to begin from the onset of production. It seems unlikely that a slower regime would be effective once a field has been rapidly produced, and water breakthrough, and other uncontrollable processes have disturbed the initial structures.
Note that we do not know how slow slower production needs to be to take advantage of the good news in Table 2b. It may be that even small (possibly marginal) decreases in production rates could lead to substantially higher overall production. The high pressure CO2-injection in Angerer et al. (2000, 2001) was modelled by APE some two weeks after the injection had been completed and when it had presumably reached a steady state. Thus slow in this case may mean a comparatively short period of time (days rather than months or years). However, it is expected that optimum rates will vary from reservoir to reservoir and from field to field. To optimise production rates while maximising oil production requires new production strategies while using single well imaging to monitor the progress of fluid movements within the reservoir during production. To my knowledge, such strategies have not yet been attempted.
5.3 Stress-forecasting (not predicting) earthquakes with Stress- Monitoring Sites (SMSs)
Mankind has been seeking ways to predict the magnitude, time, and place of earthquakes for well over a hundred years (Milne, 1880), with singular lack of success. Much of the research has been directed at seeking some form of precursor, and a very large range of precursory phenomena have been identified before earthquakes. However, no particular precursor has been consistently observed, and when a precursor is seen, it typically bares no quantifiable relationship with the magnitude, time, and place of the particular earthquake which it appears to be associated with. It is now recognised that the earth is so complex and heterogeneous the magnitude, time, and place of earthquake cannot be predicted deterministically (Geller, 1997; Kagan, 1997; Leary, 1997; and many others).
The hypothesis that makes stress-forecasting the time and magnitude possible, is that rock is weak to shear-stress, so that stress builds up over an extensive area and the approach to fracture-criticality, when the earthquake occurs, can be recognised at substantial distances from the eventual epicentre. The duration, and rate of the increase are proportional, and inversely proportion, respectively, to the magnitude of the forecast event, and the time is when the increase reaches fracture-criticality (Volti & Crampin, 2001). This led to the successful stress-forecast of a M=5 earthquake using swarm earthquakes as the source of shear-waves (Crampin et al., 1999a). Local precursory seismicity indicated the location. This may be claimed as the first science-based earthquake prediction.
SMSs use controlled-source crosshole seismics to monitor the state of the in situ crack distributions and their progress towards fracture-criticality without the need for swarms of source earthquakes (Crampin, 2001). In principle, controlled source seismics is capable of great accuracy in measuring shear-wave splitting (Li & Crampin, 1993), so we can expect the source of the scatter of normalised time-delays in Figure 3 to be resolved, and the SELL windows to be much more tightly defined.
5.4 Other applications of shear-wave splitting
There are two main types of application for shear-wave splitting: (1) static effects - the measurement and interpretation of the (initial) state of the rock mass; and (2) dynamic effects - the measurement of changes in the rock mass by time-lapse techniques.
5.4a Static effects: It has been recognised for many years that the polarisations of the faster split shear-waves are aligned approximately parallel to the direction of maximum horizontal stress and hence to the maximum horizontal permeability in the rock matrix through which the shear-waves pass (Crampin, 1981; Alford, 1986; Zatsepin & Crampin, 1996). This means that the directions of water floods and other production strategies can be optimised by analysing shear-wave splitting. This strategy appears to be recognised by the oil industry, although not always adopted, as there are alternative techniques for obtaining similar estimates.
5.4b Dynamic effects - monitoring toxic-waste and nuclear-waste repositories: The case studies in Sections 3.1 and 3.2 show that shear-wave splitting is very sensitive to otherwise undetectable changes in rock mass conditions. This means that leakage from toxic-waste and nuclear-waste repositories could be detected by monitoring shear-wave splitting in cross-hole time-lapse techniques. The optimum technique would be to bracket the repository with ray paths from a DOV as source to three-component geophones as receivers. CW and CCW sweeps of the DOV would again generate orthogonal shear-wave polarisations. Note that the ray paths should be far enough from the repository to avoid interface waves and to separate direct arrivals, the most informative waves, from reflections and refractions from side walls of the repository.
5.4c Dynamic effects - monitoring slope and other near-surface instability: It is suggested that the APE mechanism for pre-fracturing deformation, fluid-migration along pressure-gradients between neighbouring microcracks, while proven at depth, is also valid for near-surface deformation. The reports in Table 1 suggest it is a fundamental relationship between the evolution of fluid-saturated microcracks and stress which will be present in all in situ materials, even poorly consolidated soils. It is expected that fracturing or breakage only occurs when fracture distributions reach fracture-criticality. This means that monitoring shear-wave splitting in appropriate near-surface geometries will also allow the approach of fracture-criticality to be recognised.
A number of small-scale shear-wave sources have been developed, ranging from horizontal pistons, to a variety of oriented weight drops and swinging hammers. These could be used to monitor the near-surface microcrack structures for hillside and dam site stability testing. There are many other examples of local instability problems where analysing shear-wave behaviour would allow the approach to fracture-criticality to be monitored.
6. Conclusions
There are four major conclusions from this review of the past ten years of seismic shear-wave anisotropy.
- Shear-wave splitting is very sensitive to very small changes to the fluid-saturated stress-aligned grain-boundary cracks and pore-throats pervading almost all in situ rocks in the crust (and upper mantle).
- The detailed internal geometry of this cracked rock mass is very sensitive to small, otherwise undetectable, changes in in situ conditions.
- The evolution of stress-aligned fluid-saturated microcracks can be modelled, sometimes with great accuracy, by anisotropic poro-elasticity (APE), where the mechanism is fluid movement along pressure gradients between neighbouring grain-boundary cracks and pore-throats at different orientations to the stress field. APE-modelling matches a huge range of static and dynamic phenomena. Since APE is highly constrained with no free parameters, the response of the rock mass to known conditions can be calculated and in some cases predicted.
- The underlying reason for the calculability and predictability is that the rock mass is so heavily cracked that it can be considered as a critical system. This has profound effects on conventional geophysics. In particular, many parameters of the rock mass are controlled by the behaviour of fluid-saturated microcracks, rather than the complicated heterogeneous sub-critical rock.
Taken together these four conclusions amount to a new understanding of rock deformation, where the deformation of complex and heterogeneous rock in response to changing stress is controlled by the changes in the geometry of the stress-aligned fluid-saturated microcracks. If current usage in resolution and accuracy is sufficient, the four items above can be ignored. However, if it is wished to understand detailed fluid-rock interactions, to extract more oil from a reservoir, or to forecast the time and magnitude of earthquakes, the good news in Table 2 must be exploited, probably in the ways suggested in Section 5.
I suggest we are at a turning point in Solid Earth physics. The ideas outlined in this review are believed to be a major advance in understanding rock mass pre-fracturing deformation, with some disadvantages, but with some important new properties to exploit. This is believed to be a fundamental new understanding with totally new applications. This is believed to be a geophysical (and geological) renaissance as Davis et al. (1997) once suggested of a small part of this revolution. It is suggested that these developments will lead to the practice and techniques of geophysics being significantly different in a few years time.
However, the interior of the Earth is remote, toxic, subject to high temperatures and pressures and is remarkably difficult to understand (witness the results in this review which are new and surprising even after at least 50 years of quite intensive geophysics). Sections 5 and 6 are largely (observation based) speculations. I should be very interested in any information or plans that may add some data to help to realise the speculations in Section 5 and advance this revolution.
Stop press (23/4.01): Reports from Husavik, Iceland, suggest that the SMS is recording high-accuracy high-resolution variations in shear-waves for ray paths at 500m, which correlate with tidal signals. There is much to be analysed and there are many implications, but this is a first demonstration that the SMSITES Project is monitoring temporal changes of shear-waves in the compliant in situ rocks.

Acknowledgements
This paper was partially supported by the European Commission SMSITES Project (Contract No. EVR1-CT1999-40002). I thank Sebastien Chastin whose comments helped to improve this review.


Join the Conversation
Interested in starting, or contributing to a conversation about an article or issue of the RECORDER? Join our CSEG LinkedIn Group.
Share This Article