Abstract
An algorithm was developed to construct heterogeneous petrophysical reservoir models based on well logs showing power law features and Gaussian or Non-Gaussian probability density distribution. The algorithm honoured the statistical features of well logs such as the horizontal and vertical characteristic scales and the correlation among rock properties. Multi-dimensional and multi-variable heterogeneous models preserving the same statistical properties were constructed and applied to the heterogeneity analysis of gas hydrate reservoirs located in the Mackenzie Delta, Northwest Territory of Canada. The petrophysical models provide a platform to estimate rock physics properties as well as to study the impact of P- and S-wave scattering, wave mode conversion, and their integration on wave behavior in heterogeneous reservoirs. Using the Biot-Gassmann theory, the statistical parameters obtained from Mallik gas hydrate research boreholes, and the correlation length estimated from acoustic impedance inversion, the gas hydrate volume fraction in the Mallik area is estimated to be 1.8% of a 500m by 500m by 226m volume. This represents approximately 2×10⁸ m3 of natural gas stored in hydrate bearing intervals located at depths between 889 m and 1115 m. The heterogeneous models were further used with a parallel 3-D viscoelastic Finite Difference (FD) modeling software to simulate a near offset Vertical Seismic Profile (VSP) numerical experiment. The synthetic results indicate that the strong attenuation observed in the field data might be caused by the scattering.
Introduction
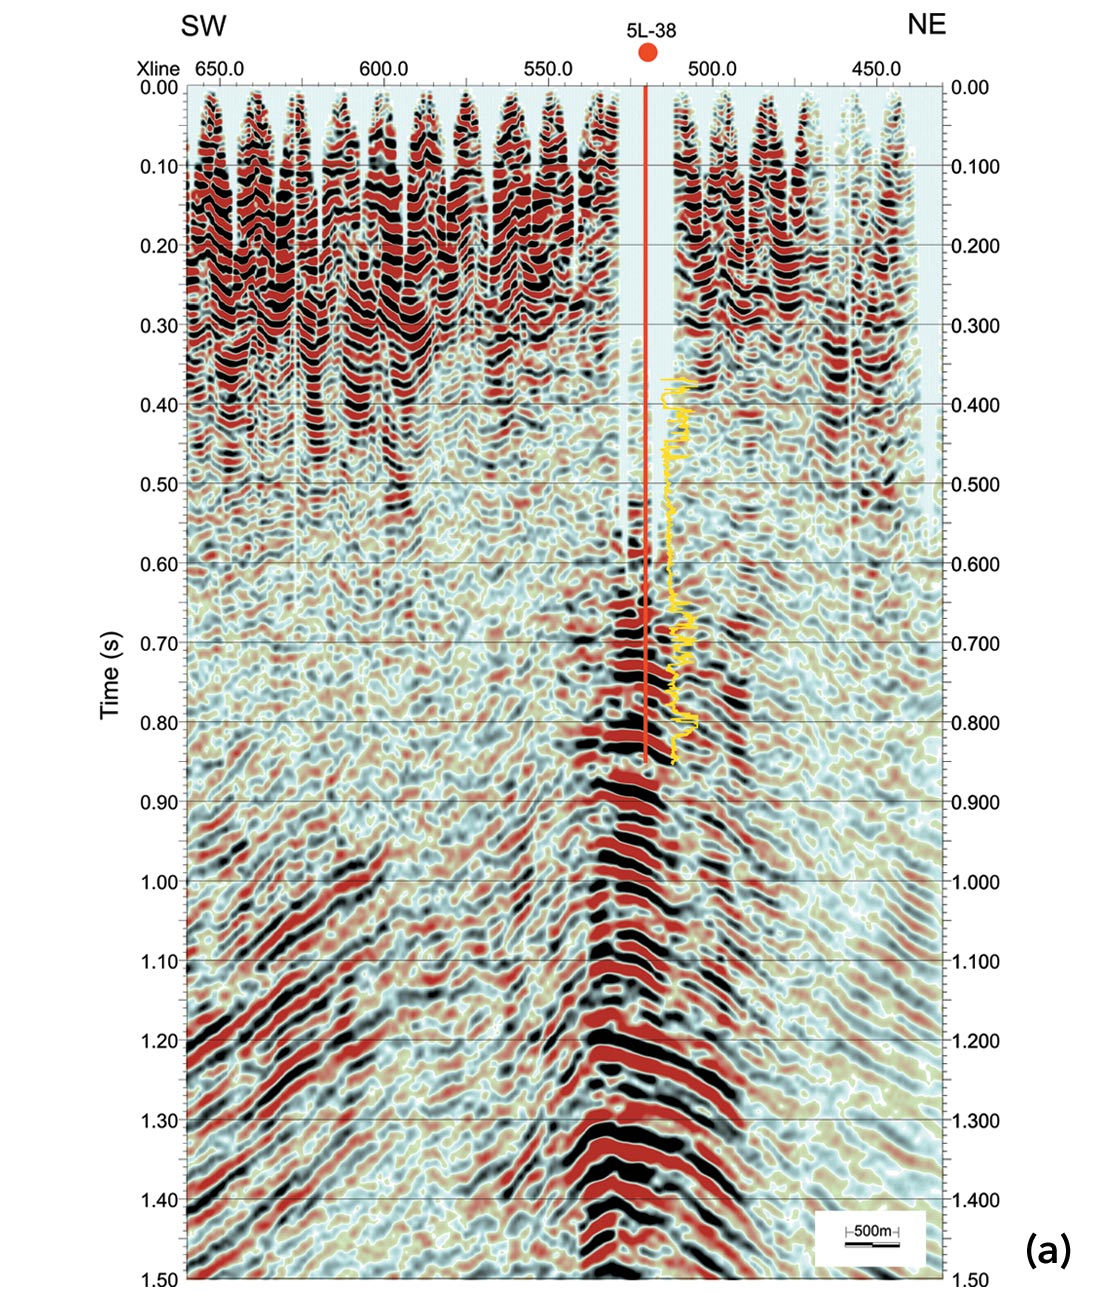
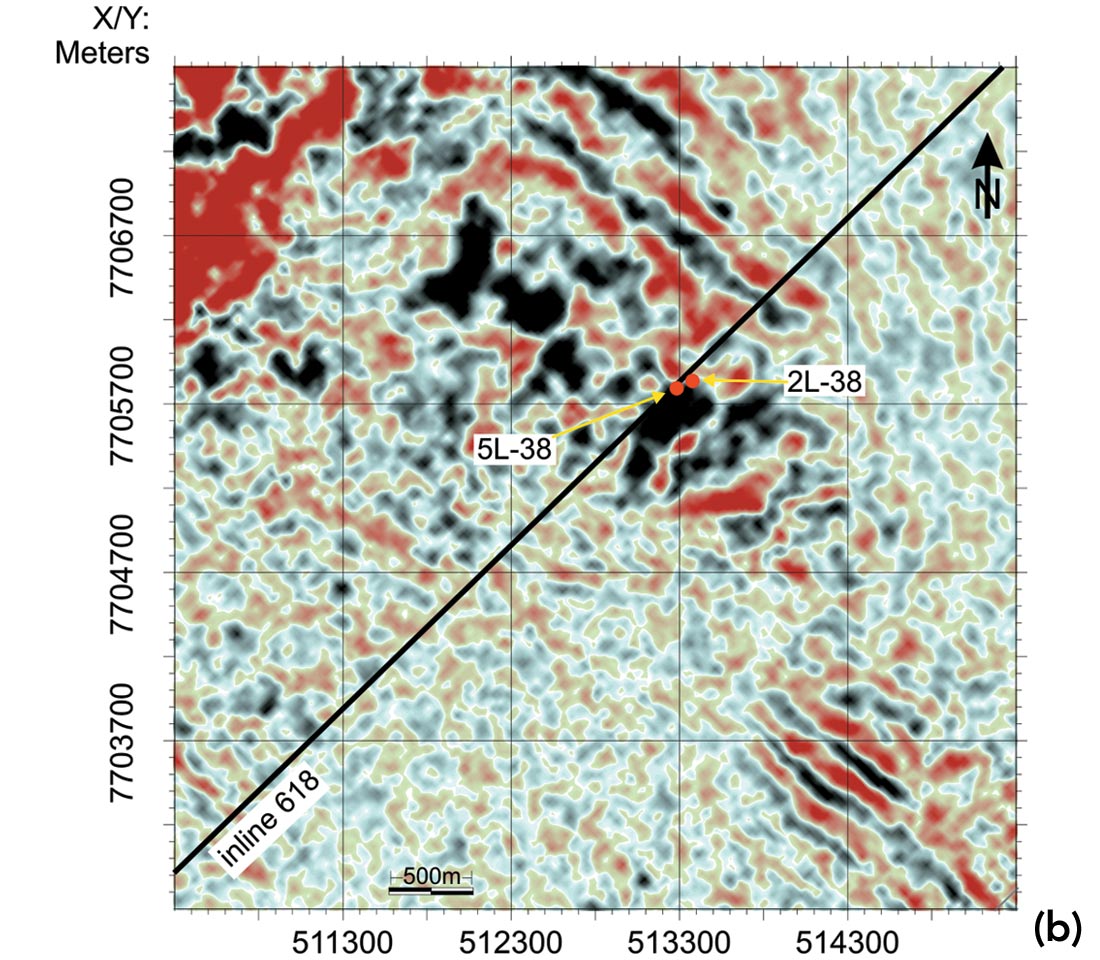
Natural gas hydrates, a type of inclusion compound or clathrate, are composed of gas molecules trapped within a cage of water molecules. The presence of gas hydrates in permafrost regions and in deep ocean along continental slopes have been confirmed by core samples recovered from boreholes. However, neither the geology nor the seismic model of the gas hydrate reservoirs is fully understood. At Mallik, significantly elevated P- and S-wave velocities from borehole logs indicate additional support in the sediment matrix due to the formation of gas hydrates. However, the high velocities are difficult to reconcile with the strong seismic attenuation obtained from cross-well survey (Pratt, et al., 2005) and zero offset Vertical Seismic Profiling (VSP) (Milkereit et al., 2005) in hydrate-bearing zones. Guerin et al. (2005) explained the acoustic wave dissipation from a rock physics perspective. The high velocity and high attenuation properties of gas-hydrate bearing sediments can also be attributed to scattering and elastic wave mode conversions (Huang et al., 2006). In addition, the strong physical contrasts did not generate observable coherent reflections in 3D seismic reflection data set which was acquired and processed by Veritas DGC land in 2002 from Mallik area, Northwest Territories of Canada. As an example, Figure 1 (a) shows the difficulty of tying the reflection events at the crest of the anticline to gas hydrate occurrence zones identified from Mallik 5L-38 P-wave sonic logs. The time slice at 800 ms TWT (Figure 1, b) cutting through the base the gas hydrate stability zone demonstrates the degree of heterogeneity around the boreholes. This study is to build petrophysical models to explain the various observations of field data.
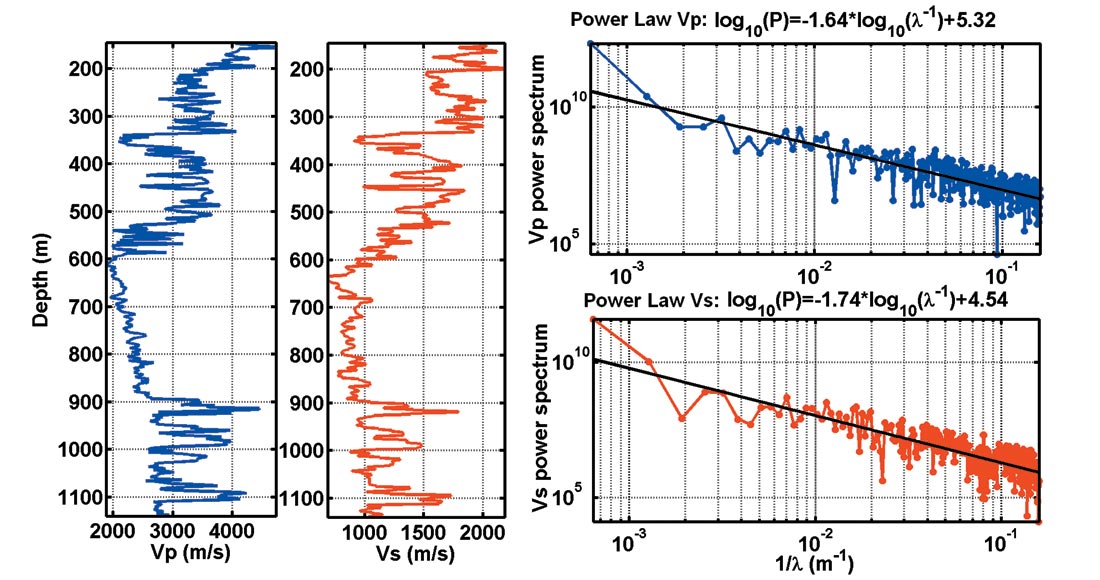
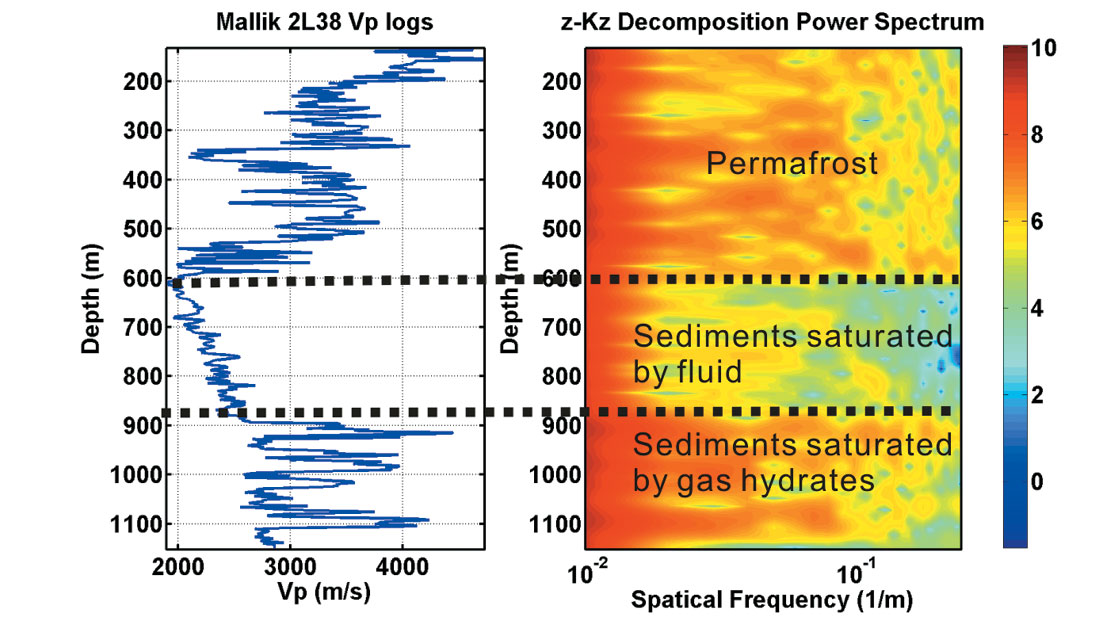
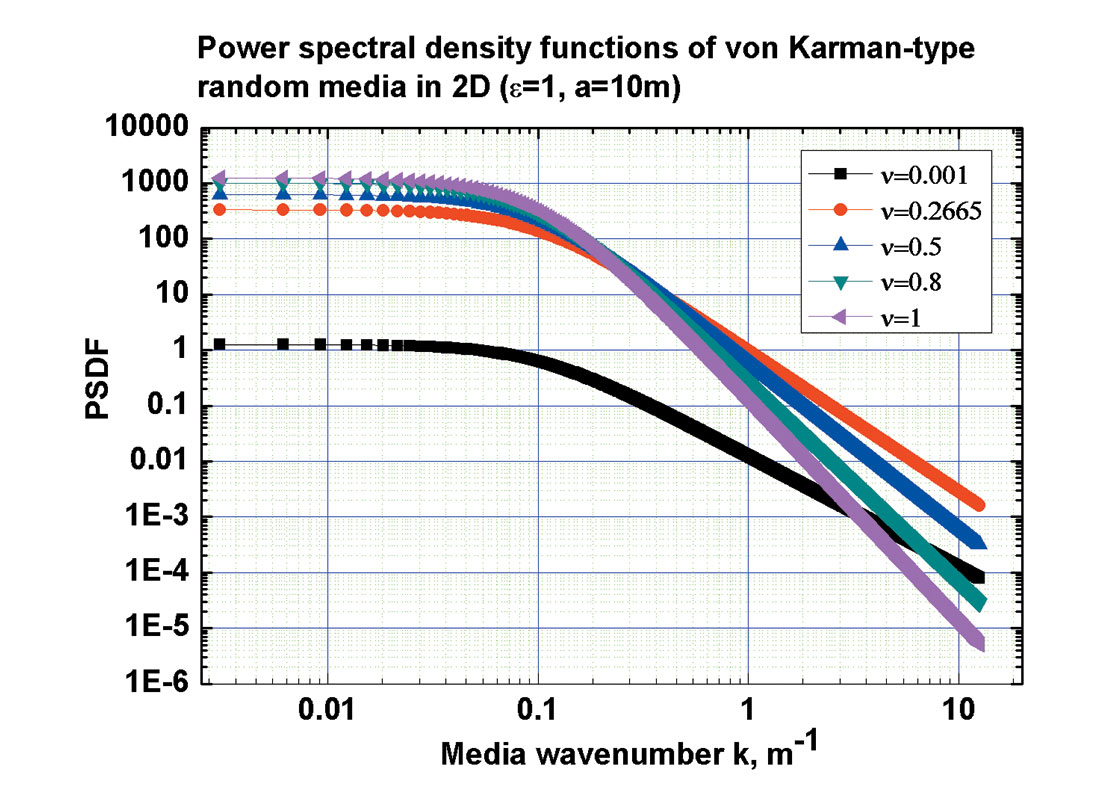
Regardless of the chemical composition, geologic age and tectonic history of the earth media, power spectra of all available data such as sonic logs uniformly decay as 1/f 0.5~1.5, where f is the spatial frequency (Holliger et al. 2003). Mallik 2L-38 sonic logs also show this power law feature (Figure 2). This type of data is referred to as 1/f-noise and is characterized by their fractal nature or scale-invariance (Mandelbrot, 1983). Using windowed Fourier Transform, the power spectrum of P-wave velocity logs from Mallik 2L-38 present different decay rates for different lithologies (Figure 3). Sediments saturated by fluid (600 m – 900 m deep) show a faster decay rate than hydrate and permafrost intervals. The most typical random media having power law spectra as asymptote are von Karman-type (Figure 4). The self-invariant and band-limited properties of the von Karman autocorrelation function make it widely applicable throughout earth science to model earth phenomena with fractal nature. From observations of a von Karman style autocorrelation function and a bimodal probability density function in the P-wave velocity logs from MITI Nankai Trough Post Survey well #1, Kamei et al. (2005) constructed a 2D random heterogeneous acoustic model and successfully explained the frequency dependence of the Bottom Simulating Reflector (BSR) as well as the scattering attenuation. The similar stochastic features were observed in the borehole logs from Mallik 2L-38 and Mallik 5L- 38. To include energy dissipation due to elastic wave mode conversion, we extended Kamei’s algorithm to elastic situation and constructed 2D and 3D elastic heterogeneous random models. Here, we provide an algorithm on the model construction and show how such models can provide first order gas hydrate volume estimates and explain the high attenuation at the seismic frequency range.
Model Construction
A multi-dimensional stationary random field is characterized by an autocorrelation function (ACF) and a probability density function (PDF). A spectral-based approach was adopted to simulate the randomly heterogeneous model (Yamazaki et al., 1988). In our statistical analysis, two borehole logs from Mallik (2L-38 and 5L-38) are available. Mallik 2L-38 covers the permafrost down to the bottom of gas hydrate stability zone, with a 2 m depth sampling interval, while Mallik 5L-38 only covers the gas hydrate bearing zone with a 0.15 m sampling interval. Due to the wide coverage, Mallik 2L-38 was used to model the shallow medium, i.e., permafrost and sediment saturated by fluid. Mallik 5L-38 was considered more statistically representative of the local area and was used to model sediment saturated by gas hydrates.
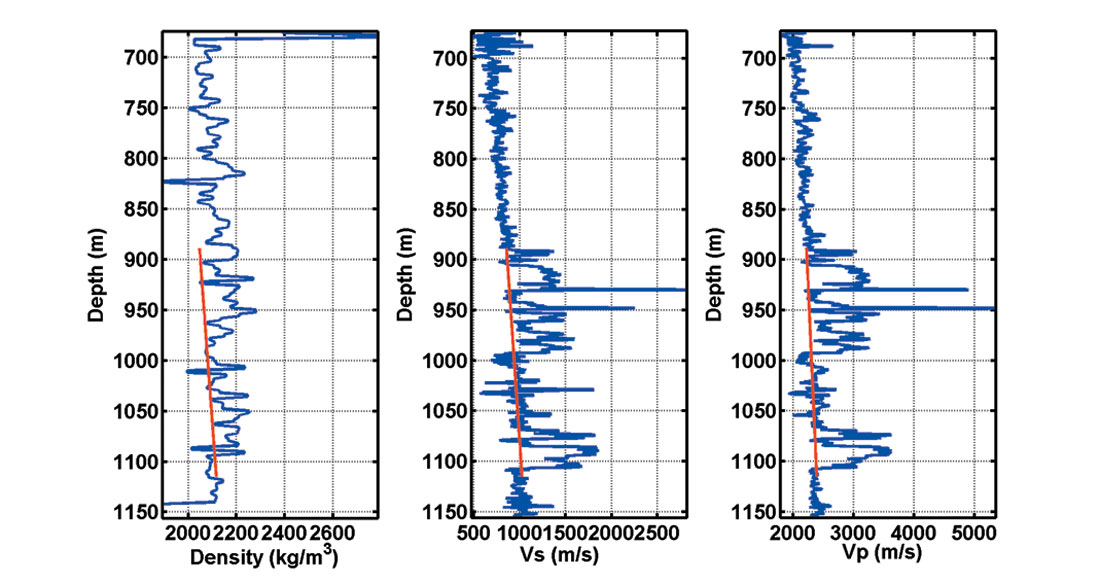
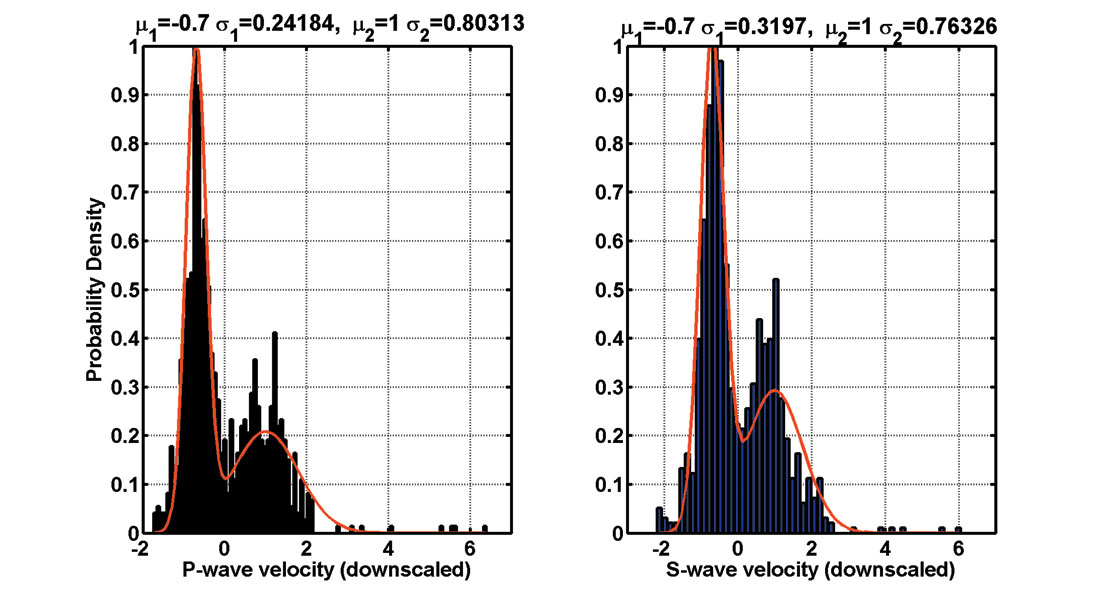
For the first step of model construction, a linear trend was identified and then subtracted from the processed well logs of Vp and Vs in the sediment strata (Figure 5). Velocity logs were scaled by estimated standard deviations. Secondly, a bimodal probability density function was obtained by fitting the histogram of well logs from the gas hydrate strata between 889 m and 1115 m (Figure 6). The bimodal probability function was considered as a linear combination of two weighted Gaussian distribution functions (Kamei et al., 2005):
where w1 is the weight factor, V is the random parameter related to the velocity, μ and σ are mean velocity and standard deviation, respectively. Least square fitting provide σ1 values. To ensure a zero mean, the weight factor w1 can be obtained from the two mean values: w1=σ2/ (μ2-μ1), and to maintain a unit variance, the second variance σ2 is derived by:

The scaled mean values and standard deviations are listed in Figure 6.
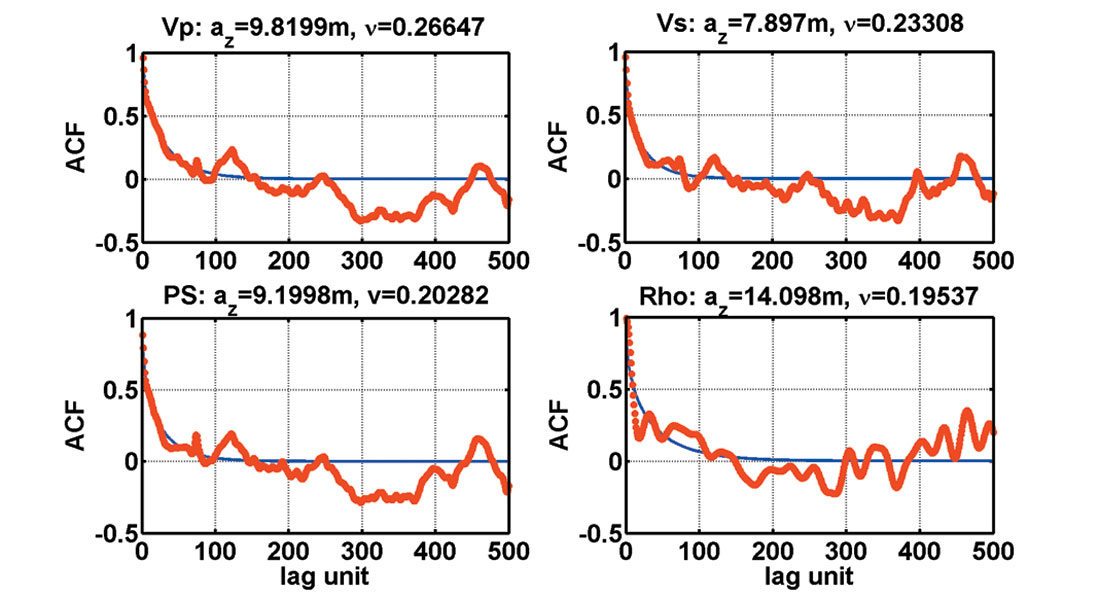
The third step consists in fitting the autocorrelation and the cross-correlation of the logs by a von Karman autocorrelation function (Goff and Jorgan, 1988):
where x is a vector in the multi-dimentional random field, x=[x,y] in 2D and x=[x,y,z] in 3D, Kν is the modified Bessel function of the second kind, Γ(ν) is the Gamma function, and ν is the Hurst number describing the richness of the small scale heterogeneity of the medium. The vertical characteristic scale az and the Hurst number ν for both P-wave and S-wave velocity logs were obtained by a least square curve fitting (Figure 7). The P-wave and S-wave velocity showed strong cross-correlation while the density is not correlated with velocities (not shown). Both the correlation and uncorrelation features will be considered in the power spectrum density function in the following step.
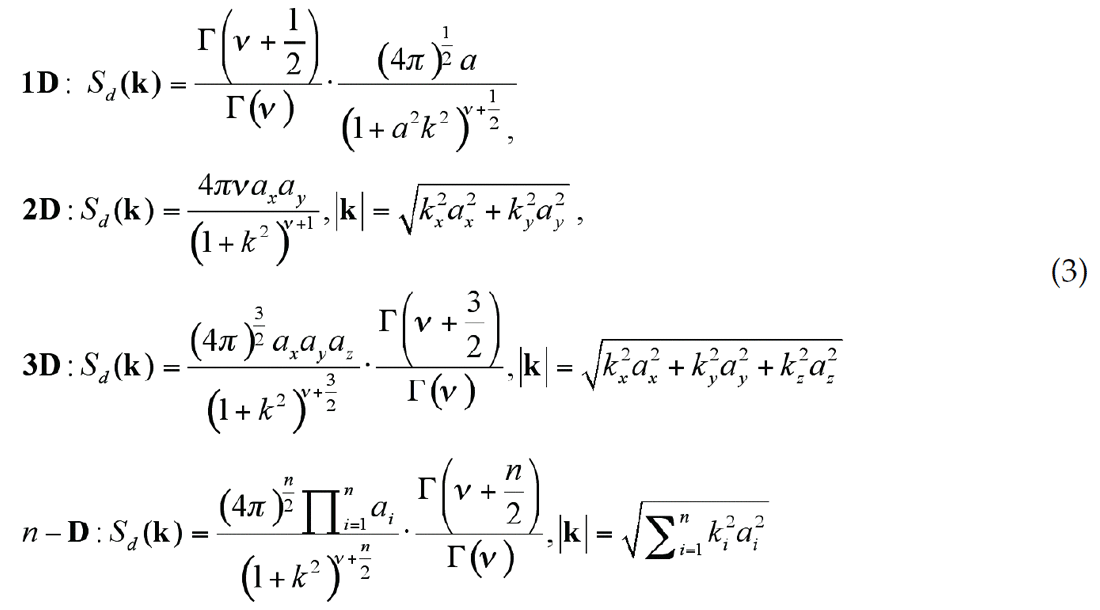
The desired power spectrum density function (PSDF) of the medium, Sd(K), was obtained from ACF equation (2) by Fourier transform. The intermediate Gaussian random field g(x) was then generated from the PSDF which is followed by a Cumulative Distribution Function (CDF) mapping to construct the non-Gaussian bimodal random field Vp and Vs. In this process, the positive correlation of Vp and Vs, and the uncorrelation of density and velocities were honoured. The detailed equations can be found in Shinozuka (1987). In our case, the PSDF is where kx, ky, kz are the wave number component, and ax, ay, az are the characteristic scales in 3-D. The general expression for multi-dimensional (n-D) case was provided.
As an example, we simulated a 2D elastic random medium and selected two synthetic well logs shown in Figure 8 to compare with the field well logs. We can see that the random heterogeneity simulation does not reproduce exactly the field logs but generates pseudo-logs exhibiting the same stochastic features. The correlated and uncorrelated features observed in the field data (red dashed circle) were honoured in the simulated logs (black solid circle).
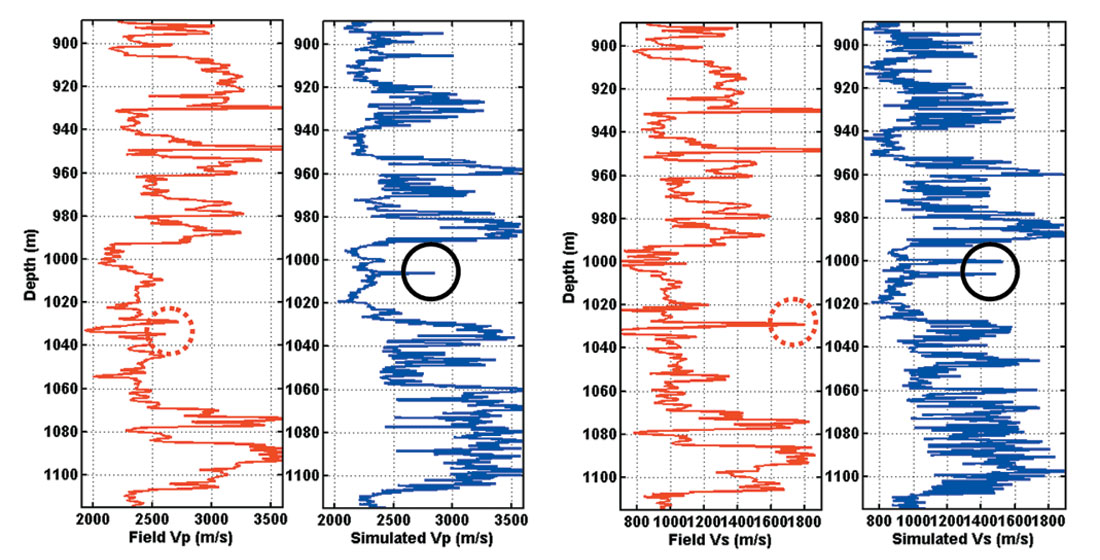
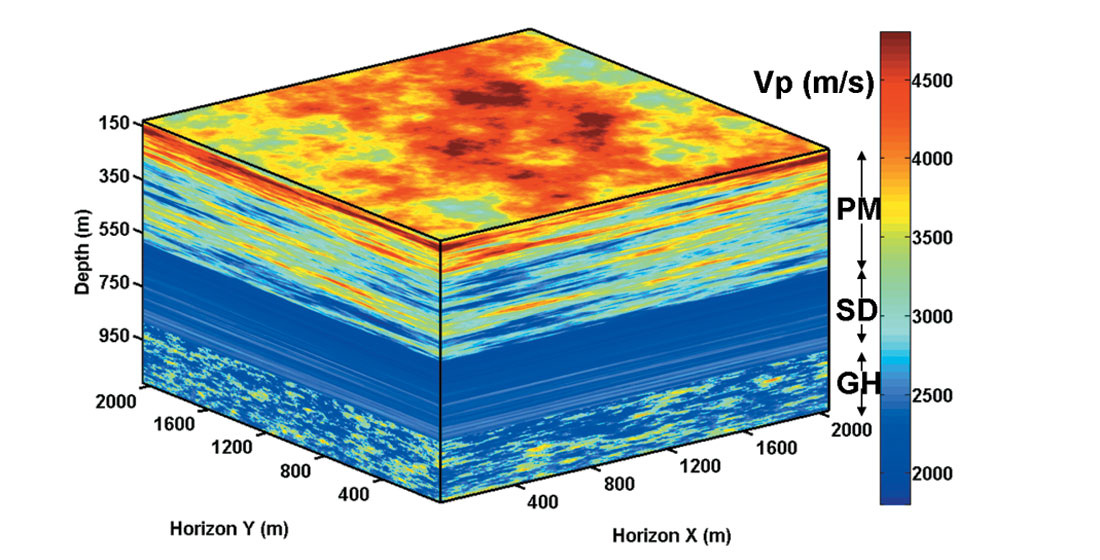
Figure 9 shows an example of a 3D P-wave velocity model based on the P-wave logs from Mallik 2L-38 and 5L-38. Three intervals are shown. The permafrost (PM), sediments (SD) and gashydrate-bearing sediments (GH) were simulated individually with different correlation length. For example, for the gas hydrate interval, the correlation length along the X direction (100 m) is different from the Y direction (50 m). By modifying the quadratic expression of k in equation (3), an arbitrary distribution orientation can be defined. The same statistical analysis can be applied to any heterogeneous interval, in our case the permafrost interval and the sediment saturated by fluid. Multidimensional (1D, 2D and 3D), correlated and uncorrelated multivariable petrophysical models are thus available for seismic scattering analysis and characterization of gas hydrates at the reservoir scale.
Application in Rock Physics: Hydrate Volume Estimation
The Biot-Gassmann theory modified by Lee (2002) established the relationship between the gas hydrate concentration, the formation density and the ratio of the formation velocity (Figure 10a). Assuming a constant clay volume content of 30% for Mallik 5L- 38, the 3D models of density, P-wave and S-wave can be used to provide the gas hydrate volume content. If the heterogeneous distribution of gas hydrates is governed by the fractal nature of lithology, the volume content of gas hydrate then can be calculated from the correlation length and Hurst number. Figure 10b shows the volume fraction of gas hydrate as a function of correlation length for a specific Hurst number. We used a Hurst number of 0.27 estimated from Mallik 5L-38 P-wave velocity logs. The gas hydrate volume content increases from 1.6% to 2.5%, as correlation length increases from 50 m to 800 m. For a constant correlation length (ax=ay=500 m), an increasing Hurst number can also result in a higher gas hydrate volumetric content.
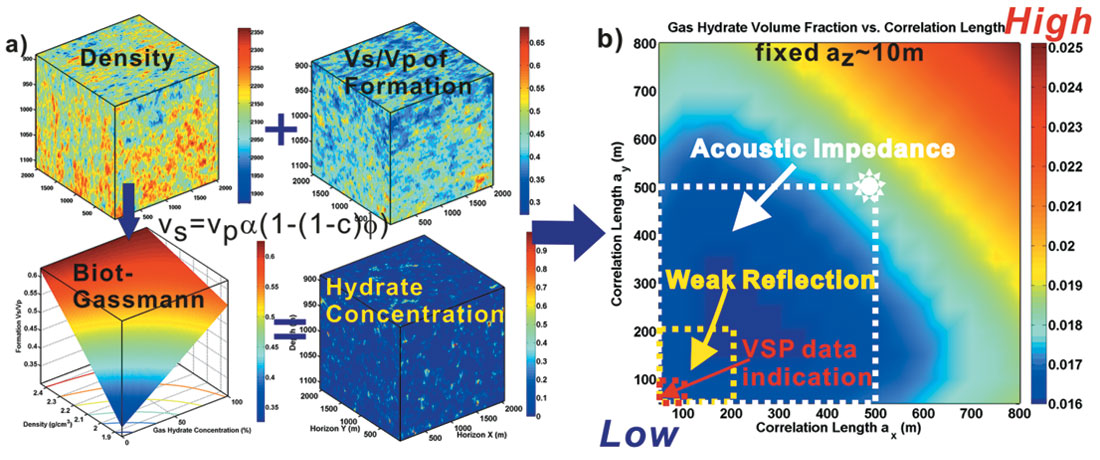
Due to the limited number of boreholes in the Mallik area, additional information such as lateral correlation length and gas hydrate vertical distribution region are desired to obtain a volume estimate. An acoustic impedance inversion of 3D seismic data near Mallik suggests a 500 m lateral correlation length (Bellefleur et al., 2006) and thus defines a upper boundary of hydrate volume content in Mallik area: 1.8% volume fraction defined by the white rectangle in Figure 10b. The gas hydrate stability zone at Mallik is between depth of 889 m and 1115 m. Therefore within the volume of 500 m by 500 m by 226 m, the natural gas stored in hydrates is approximately 2×10⁸ m3 at standard temperature and pressure conditions. However, weaker reflections from surface data suggests that the correlation length could be as low as the radius of the first Fresnel zone (200 m - yellow rectangle in Figure 10b). Furthermore, high resolution Vertical Seismic Profile (VSP) data from Mallik 3L-38, indicate a smaller correlation length of 100 m (Milkereit, et al., 2005), which decreases the natural gas volume to 1.5×10⁸ under the standard conditions. Higher resolution seismic data is desired to resolve the horizontal correlation length.
Application in Wave Propagation: Scattering Attenuation due to Heterogeneity
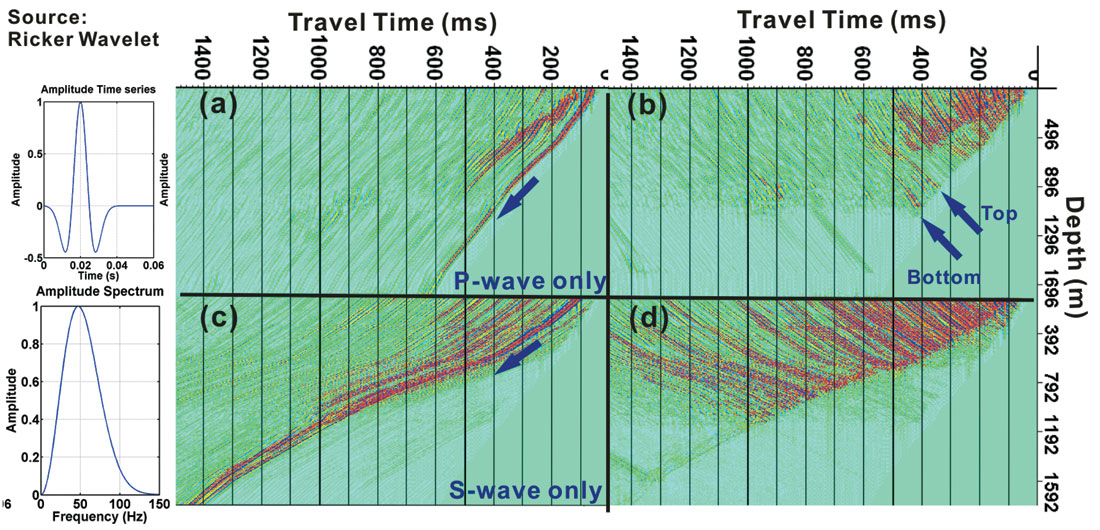
Wave attenuation is an important physical property of hydrate-bearing sediments that is rarely taken into account in site characterization with seismic data. Estimates of Q-factor (inverse of attenuation) from seismic data usually neglect effects from scattering and assume that attenuation is entirely due to intrinsic rock properties (Bellefleur et al., 2007). Here we show that the observed strong attenuation can be explained by scattering. A simple near offset VSP numerical experiment of using Ricker wavelet of 50 Hz central frequency was carried out on a 3D model consisting of permafrost, sediments saturated by fluid with infinitely long correlation lengths (i.e., stratified), and heterogeneous gas-hydrate-bearing interval (Figure 11).
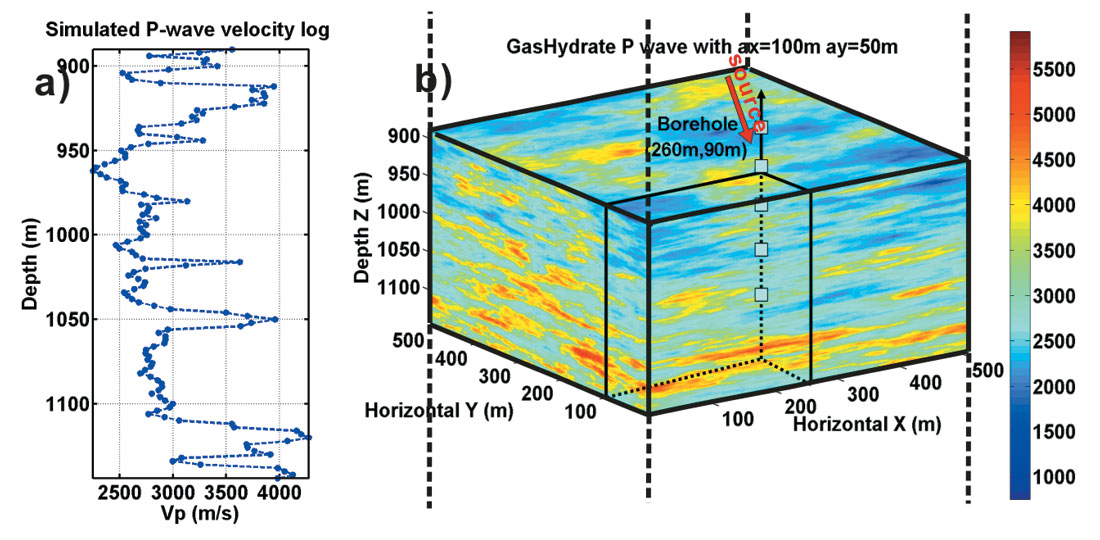
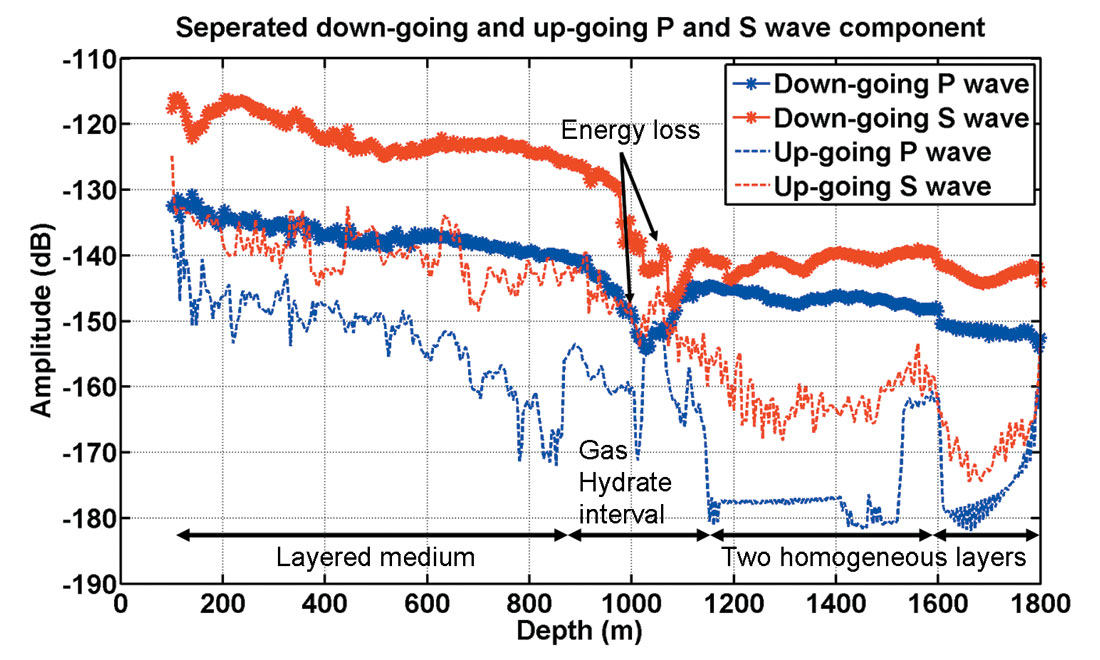
Beneath the gas hydrate zone, two homogeneous layers were added to generate reference reflections. A finite difference modeling software (Bohlen, 2002) was used to solve 3D elastic wave equations. The P-wave velocity in gas hydrate zone varies from 1909 m/s to 5128 m/s and its contrast to the background linear trend is 28% in a root mean square sense. The correlation lengths for the hydrate interval were set to 100 m in the X direction and 50 m in the Y direction. The explosive source was located at the surface and the borehole was 160 m away. In our numerical experiment, the wave-number (k) associated with the source and the correlation length (a) of the model make k≈10. Using Wu×s definition (Wu, 1989), the scattering regime covers both large angle (scattering attenuation) and small angle scattering regime. P-wave (Figure 12a and b) and S-wave (Figure 12c and d) energy was separated using divergence and curl operation on the full wave field. A practical algorithm was developed by Huang et al. (2007). Synthetic P and S wave components were further separated into down-going and up-going waves using FK filtering. The energy loss due to scattering is demonstrated in Figure 13. Even if the back scattered energy (up-going wave) was added back to the down-going waves, the scattering within the heterogeneous gas hydrate reservoir would still contribute up to 10dB energy loss, or scattering Qsc as low as 6. The 3D elastic heterogeneous petrophysical model provides the platform to further study seismic scattering and the impacts on conventional seismic data survey and processing.
Conclusions
Randomly heterogeneous elastic 2D and 3D multi-variable models were constructed based on the spectral approach, which honoured the correlated and uncorrelated statistical features represented in well logs. Assuming that the gas hydrate heterogeneous distribution is determined by the fractal nature of earth media, we can estimate the gas hydrate volume and thus natural gas in place. We found that an increasing Hurst number and correlation length can increase the gas hydrate volume.
Energy loss due to scattering was demonstrated from a simple 3D near offset VSP numerical experiment. This implies that the scattering mechanism due to small scale heterogeneity cannot be ruled out in the study of the attenuation observed in the field data. Further analysis on different seismic acquisition geometry will be conducted in this direction.


Join the Conversation
Interested in starting, or contributing to a conversation about an article or issue of the RECORDER? Join our CSEG LinkedIn Group.
Share This Article