Seismic imaging is an important geophysical tool for delineating and monitoring the earth’s subsurface structure and its oil, gas and mineral resources. Owing to the earth’s heterogeneity, such subsurface structures exist at different scales (sizes) with lateral and vertical variations in physical properties such as contrasts in bulk and shear moduli, and densities. Over the past decade, seismology entered a new era. Solving elastic and visco-elastic wave equations on large supercomputers, accurate and complete simulations for heterogeneous 3D earth models became a reality – replacing exact solutions for layered earth models.
Seismic methods illuminate subsurface structures using compressional and shear waves. Recorded signal at surface and borehole seismic sensor locations arise from reflection, refraction, transmission, scattering and attenuation of elastic waves at lithological contacts, structural boundaries and the Earth's free surface, where abrupt and gradual changes in physical rock properties occur. The effects of heterogeneities on seismic wave propagation can be described in terms of different propagation regimes and physical rock property contrasts: quasi-homogeneous for heterogeneities too small to be seen by seismic waves, Rayleigh scattering, Mie scattering and small-angle scattering. These scattering regimes cause characteristic amplitude, phase and travel time fluctuations. After a few time steps, however, the transmitted and forward scattered seismic wave fields “heal”, thus limiting the resolving power of seismic imaging. Examples of strong constrasts include the Earth’s free surface, seafloor topography, permafrost layers, gas and gas hydrate accumulations, and massive sulfide mineral deposits. Consequently, the presence of strong contrast provides an interesting challenge for a wide range of controlled source seismic imaging and passive source seismic monitoring studies.
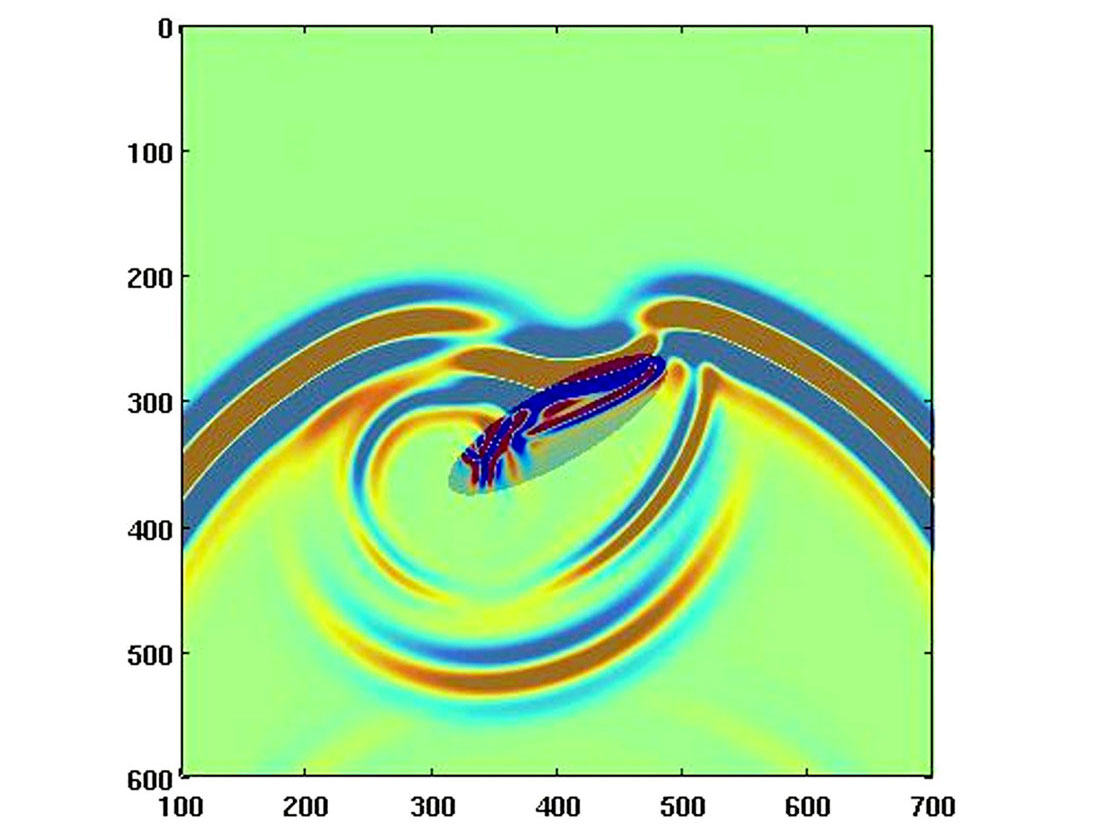
A modeling study of elastic seismic wave propagation through an underground mine with low velocity and low density backfill illustrates lateral amplitude, travel time and phase variations.


Join the Conversation
Interested in starting, or contributing to a conversation about an article or issue of the RECORDER? Join our CSEG LinkedIn Group.
Share This Article