Summary
This paper describes the rock physics basis of understanding and better defining seismic signatures of overpressures (defined as the pore fluid pressure in excess of the hydrostatic pressure). Our accompanying paper describes applications of these fundamental rock models for estimating pore pressures from field seismic data. The physical basis for the determination of porosity and pore pressures from seismic measurements has been the often-observed correlations between seismic velocity and porosity, and between porosity and effective pressure. Anomalously high pore pressure zones are often associated with high porosities and low seismic velocities. Accurate interpretation of the seismic data to guide drilling decisions requires a fundamental understanding of the basic rock physics of overpressured sediments—the relation between physical properties of overpressured sediments, pore fluids, and pore pressures, and their seismic signatures such as wave velocities, reflectivities, AVO, and impedances. We explore the problems of unconsolidated sand-clay systems and model the effects of cementation and diagenesis. We show how rock physics models based on laboratory and log data can be used to predict rock properties from seismic reflectivity and impedance measurements.
Introduction
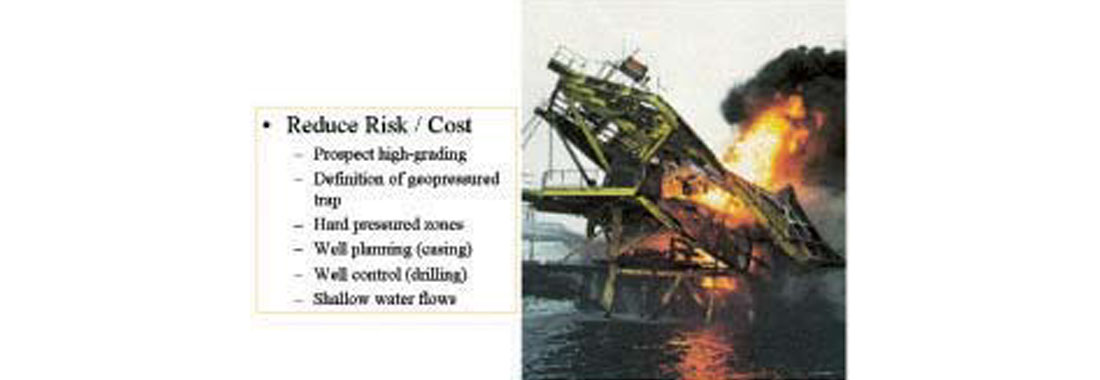
One of the critical problems for exploration and development of natural gas in the Gulf of Mexico is detection of overpressures or geopressures. In many cases, the best place to look for gas is in the vicinity of the transition to overpressure—both within the overpressured region and in the formations above it (Burst, 1969; Dow, 1984; Leach & Fertl, 1990). For example, almost half of the gas production in the south Louisiana Tertiary has come from a 600 m interval centered around the top of abnormal pressure (Leach, 1994). Under geopressured conditions shales may be undercompacted with anomalously low density and seismic velocity. They act as detachment planes for faults and often provide a habitat for significant hydrocarbon accumulations. At the same time, these geopressured zones are also potential hazards for drilling operations (Figure 1), especially in deepwater, where well costs typically run over $ 20 million per well.
The oil and gas industry has successfully drilled thousands of deepwater wells throughout the world. Successful drilling is defined as reaching the total well depth in the desired hole size safely-not exceeding the fracture pressure-while controlling the hydrocarbon or water influx and ensuring that casings are placed across desired intervals. In spite of these successes, drilling challenges abound, especially in deepwater. Some of these challenges are:
- Smaller tolerance between pore pressure and fracture pressure causing narrow pressure margins while drilling (This is the source of either lost circulation or differential sticking of drill pipes);
- Shallow-water flow hazards due to pressured aquifer sands (This causes significant sand pile up near the well bore and can result in the loss of well and well bore template);
- Excessive casing programs/small hole at total depth or unable to reach total depth (This can cause improper casing design resulting in unsafe drilling and often, the loss of the well);
- Slow rate of penetration and incorrect use of bit types combined with excessive bit wear (This causes the well cost to rise and may result in not being able to reach the total planned depth safely).
While the industry has successfully mitigated many of these hazards, a review of the industry reveals that much more work needs to be done in planning a well and ensuring that a full spectrum of available technologies are used properly and effectively. A case in point is the losses due to shallow-water flow (SWF) hazards in deepwater. A 1999 conference on this subject in League City, Texas, sponsored by the MMS, revealed that although the industry was spending about $1.7 million per well in dealing with problems associated with SWF, only about 20 percent of this amount was being spent on pre-drill prediction; the rest is allocated for mitigation after the SWF has happened. This is clearly unacceptable.
In the last decade, drilling in the deepwater has uncovered the hazard due to Shallow Water Flows (SWF) sands in the shallow sediments that are often over-pressured. These zones are generally located between 400 and 2100 m water depths and at depths between the seabed and about 1220 m below the mudline (Huffman and Castagna, 1999). If pore pressures could be determined accurately before drilling, then mud weight could be reduced to the minimum required to balance the formation pressure, and smaller casings and fewer casing runs could be used, resulting in greatly increasing drilling efficiency.
Geopressures are caused by a host of mechanisms as discussed in the literature (Fertl, 1972; Dutta, 1987). Worldwide, it appears that no single mechanism can adequately explain all occurrences of overpressure. In the past it was thought that a major part of overpressure development could be attributed to compaction disequilibrium. It still is. However, with the advent of better geologic models and 3D seismic, contributions to geopressure due to various diagenetic processes are being recognized. There are two important mechanisms: clay dehydration and burial diagenesis of shales (Dutta, 1983; Dutta, 1987; Dutta, 2002; Lahann 1998) and hydrocarbon generation (Hunt et al, 1994). Other suggested mechanisms include late-stage pore pressure generation due to diagenetic phase change of clays, aquathermal pressuring, and hydrocarbon maturation.
The oil and gas industry has relied upon a host of complimentary techniques for locating geopressures. Most methods require a normal depth trend of the formation properties to be established for the area of interest. Measured deviations from these normal trends are taken as indicators of geopressure, provided that other conditions such as lithology remain the same. Well logs obtained after drilling provide the most extensively used and reliable means to construct trends and delineate geopressures. For example, shale resistivity ratios have been used successfully as indicators of overpressured zones. Sonic logs are thought to be the best indicators of geopressure, because they are relatively less affected by hole size, formation temperatures and water salinity. An alternate procedure that uses a predictive rock model for pressure prediction has become more popular recently. This is mainly because such techniques use an integration of geology with geophysics and hence, the procedure is more applicable in frontier areas where well control is limited or non-existent. Details of this procedure are the central point of this paper; applications are provided in the companion paper by Dutta et al.
It is most valuable, of course, to detect overpressure before drilling or ahead of the bit while drilling. Reflection seismic methods are commonly used to predict pore pressures from the surface, exploiting the observation that overpressured intervals have velocities and impedances that are lower than normally-pressured intervals at the same depth. Seismic measurements while drilling (MWD) and reverse VSPs have the potential for predicting pore pressure conditions ahead of the bit in real drill time.
In spite of significant advances in seismic techniques, few of the current methods for interpreting seismic data provides the accuracy needed to guide drilling decisions. It is not yet possible, from seismic data alone, to distinguish unambiguously pore pressure changes from lithologic and fluid saturation changes. A necessary critical input for accurate interpretations is a fundamental understanding of the basic rock physics of overpressured sediments—the relation between physical properties of overpressured sediments, pore fluids, and pore pressures, and their seismic signatures such as wave velocities, reflectivities, and impedances. While saturation, lithology, and pressure effects on interval velocities, bright spots and AVO are reasonably well known for consolidated rocks, they are much less well understood in unconsolidated sediments. Furthermore, the scale-dependence of measured seismic properties is not always understood and accounted for.
Overpressure Mechanisms
Worldwide, it appears that no single mechanism can adequately explain all occurrences of overpressure (Fertl et al., 1994). A considerable amount of our understanding of overpressures has come from offshore Gulf of Mexico. The Gulf of Mexico is a young, compacting basin of a dominantly regressive Tertiary sequence consisting of soft sand and shale sediments. Broadly, the shallower portions consist of a pair of rock units, the shallower one sandy with a large sand/shale ratio and the other a mudrock with few sandstones (Chapman, 1994). Dickinson (1953) observed that pore pressures in the sandy upper part are mostly normal, while abnormal pressures are usually encountered below the sandy sequence, in the upper part of the mudrock unit. Abnormal pressures are also found in sands that have become isolated due to faulting. In the past, it was thought that a major part of overpressure development in the Gulf of Mexico could be attributed to compaction disequilibrium (Hart et al., 1995). This is probably the most common cause in clastic basins. However, investigations by Hunt et al. (1994) present compelling evidence showing that in many cases methane generation from the decomposition of organic matter in freshly deposited muds can be one cause of overpressures, particularly at greater depths. Other mechanisms for overpressure genesis include late-stage pore-pressure generation due to diagenetic phase change of clays (Powers, 1967; Burst, 1969), aquathermal pressuring (Barker, 1972), and gypsum/anhydrite transformations (Fertl, 1976; Sahay and Fertl, 1988). Although many mechanisms have been described in the literature, most studies cite either disequilibrium compaction or hydrocarbon generation as the dominant causes for overpressures. As these mechanisms progress, compaction and diagenesis tend to decrease permeability. If the escape of the fluids fails to keep up with the mechanisms of pore pressure generation, the sediments become overpressured. Retention of abnormal pressures depends on the balance between rates of pore pressure generation and pressure diffusion by fluid flow.
In the Gulf of Mexico, a two-stage normal shale compaction curve (Hinch, 1973; Bradley, 1975; Powley, 1993) has been used to show that the relation between overpressure and undercompaction may be complicated by other factors. A close correlation is found between generation of hydrocarbons and development of overpressures (Hunt et al., 1994). Such correlations have also been observed in other basins (Meissner, 1978; Momper, 1981; Law, 1984; Spencer, 1987; Dahl and Yukler, 1991). Maturation of immature organic matter forms live oil and gas of lower density, and hence greater volume, causing an increase in pore pressure. The rate of gas generation and the associated volume change depend on kerogen type (I, II or III) and on the pyrolysis kinetics (Tissot and Welte, 1978; Nuttall et al., 1983; Sweeney, 1987). In porous sediments increased pore pressure due to gas generation is governed by the pore space compressibility, the gas compressibility, and the balance between pressure generation and dissipation by fluid flow. Jizba (1991) calculated the pore pressure increase resulting from kerogen maturation in a compressible pore. Pressures exceeding 150 MPa can be generated depending on kerogen type, and pore compressibilities. Pores deform differently, and have different compressibilities, in response to overburden pressure versus pore pressure. The pore compressibility, the fractional change in pore volume due to change in pressure, is also the direct physical link between porosity and pore fluid effects on the effective moduli and seismic response of sediments (Mavko and Mukerji, 1995). Therefore quantifying the impact of pore compressibility on the coupled processes of pressure generation and dissipation by fluid flow can provide powerful tools for estimating pore pressures from seismic observables.
Although undercompaction or compaction disequilibrium is thought to be the most common cause of overpressures, the compaction mechanism has been misunderstood in the literature. It is not just a mechanical loading process - reduction of porosity and expulsion of pore water due to increasing overburden load. The burial history plays a key role, i.e., the effect of temperature and time on the sediment compaction properties, especially that of clays in shales (Dutta, 1984; Dutta 1987a, 1987b).
Clays undergo burial metamorphism as they undergo compaction, for example, the smectite-to-illite transformation within the mixed-layer clay systems in the Gulf of Mexico. This transformation is a well-known phenomenon and has been discussed by many authors (Hower et. al., 1976; Dutta, 1987a; Lahann, 2000; Dutta, 2002a). The phenomenon causes reordering of clay platelets and re-distribution of effective stress and is strongly dependent on the time-temperature history of the sediment. This implies that compaction is both time and temperature dependent. The notion of rocks compacting along a single ‘virgin’ compaction curve (assuming that porosity of a given lithologic rock unit is a function of effective stress only) is invalid. Porosity is a function of not only effective stress, but also the temperature that it was subjected to as it continued along a burial path and the time that the rock spent in a certain temperature window. The diagenetic mechanism is kinetic in nature, similar to kerogen conversion leading to oil generation. This also suggests that any approach that uses a single compaction curve to describe geopressure may be questioned. Recently, Lahann (2000) and others discussed the impact of smectite diagenesis on compaction profiles and compaction disequilibrium and suggested that two limiting compaction curves-one for smectite; one for illite-bound the compaction profiles. His analyses were based on wireline log and in-situ pressure data. Our studies agree with Lahann’s conclusions.
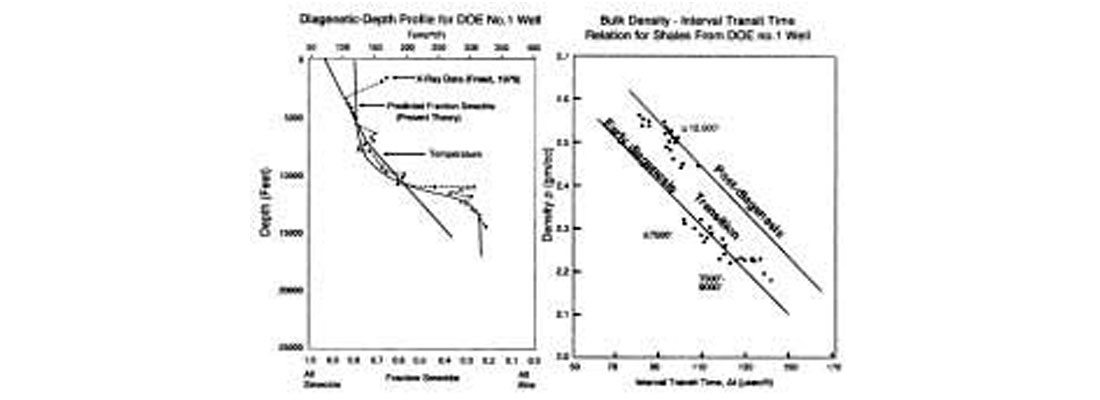
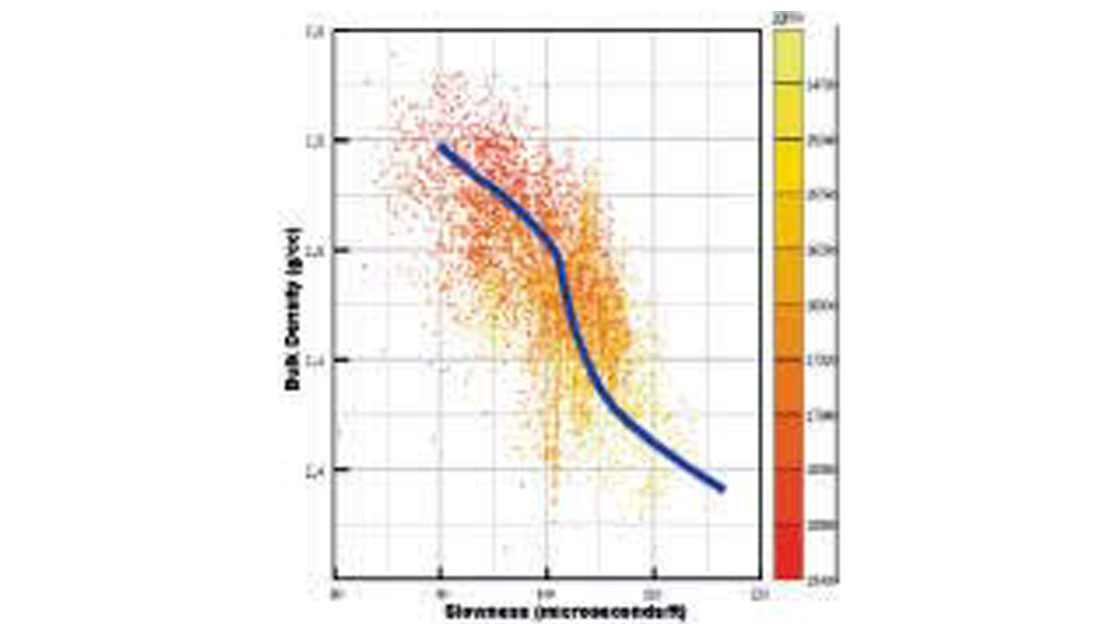
Figure 2a shows an imprint of smectite diagenesis on X-ray diffraction on shales from a well in the Gulf Coast area (DOE#1). The X-ray measurements were made on fine grain sediments (less than 5 micron) by Freed (1982). The burial metamorphic process is kinetic in nature. Namely, both temperature and geologic time control the process. Figure 2b shows a cross-plot of petrophysical properties of shales from the same well (wireline log measurements), namely, the bulk density and the slowness (inverse of velocity). The rocks are of the Miocene age. It suggests that diagenesis causes an increase in bulk density for a given transit time or slowness. A similar behavior is also noticed in a deepwater well from the Gulf of Mexico (Figure 3). This suggests that the well-known relationships of the type proposed by Gardner et al (1974)., that relate velocity to bulk density and ignore the effect of temperature (and time) are not valid in the context of geopressure estimation, namely, using velocity data to extract porosity and then relating this porosity to effective stress to compute pore pressure. The current investigation uses a time and temperature dependent compaction behavior. Thus, porosity of shales is a function of the clay type, effective stress, time, and temperature. It is noted that the direct effect of increasing temperature on the velocity of a fluid-filled porous rock is negligible, but its implicit effect on the porosity and the effective stress is not.
Overpressure Prediction and Estimation
The oil and gas industry has relied upon a host of complimentary techniques for locating and estimating geopressures. Broadly the techniques can be classified into three types: a) basin modeling, b) seismic measurements (surface seismic, VSP, MWD, etc.) made before or while a well is drilled, and c) well logs obtained after the well has been drilled.
Basin modeling provides large scale, smooth, but nonetheless very useful pore-pressure-depth estimates (Dutta, 1986; Forbes et al., 1992). These smooth estimates can serve as guidelines for establishing large scale regional trends, and form the basis for prior models before other high resolution information is available.
The determination of porosity and pore pressures from seismic measurements has been a topic of primary importance for many years (Dutta, 1987; Scott and Thomsen, 1993; Fertl et al., 1994). The physical basis for this has been the often-observed correlations between seismic velocity and porosity, and between porosity and effective pressure. Anomalously high pore pressure zones are often associated with high porosities and low seismic velocities. Geophysical methods for detecting and evaluating overpressures include pre-drill reflection seismics, measurements while drilling, and post-drill well logs and VSP. Most methods require establishing a normal compaction trend versus depth of the formation properties to be established for the area of interest. Deviations from these normal trends are taken as indicators of geopressure, provided other conditions such as lithology remain the same. A better approach is to use trend-line independent methods as discussed here. Trend-line independent methods use rock models that relate effective stress to lithology, porosity, seismic velocity and temperature.
Well logs obtained after drilling are the most extensively used and reliable means to construct rock models and delineate geopressures (Hottman and Johnson, 1965; Timko and Fertl, 1972; Weakley, 1989; Bigelow, 1994). Shale resistivity ratios have been successfully used as indicators of overpressured zones. Sonic logs are thought to be the best indicators of geopressure, because they are relatively less affected by hole size, formation temperatures and water salinity (Dutta, 1987). Deviations of sonic transit times away from normal depth trends are used as indicators of overpressured formations. Successful estimates of pore pressure from porosity have been made with a limited knowledge of lithology (Holbrook et al., 1994). With this approach Terzhagi’s effective stress law is used in conjunction with porosity-depth compaction curves to determine pore pressures from porosity logs in a variety of sedimentary lithologies. The critical rock physics link in applying this approach using seismic data is a good set of velocity-porosity transforms. More importantly, the velocity-porosity and porosity-pore pressure transforms are not completely independent, but are coupled together through the sediment and pore fluid physical and lithologic properties, as well as the temperature and effective stress.
It is most valuable, of course, to detect overpressure before drilling. Reflection seismic methods are commonly used to predict pore pressures from the surface, exploiting the observation that overpressured intervals have velocities and impedances that are lower than those in normally-pressured intervals at the same depth. Changes of interval velocity with depth are detected from high-resolution velocity analysis of common depth point seismic data (Pennebaker, 1968; Reynolds, 1970; Bellotti and Giacca, 1978; Bilgeri and Ademeno, 1982; Kan and Sicking, 1994; Kan and Swan, 2001). Departures of the transit time from normal trends are empirically calibrated to pore-pressure gradients. Kan and Swan (2001) give such empirical regressions for various basins around the world. Current trends (discussed in Part II of this paper) include the use of pre-stack seismic impedance inversions to obtain maps of anomalous P and S impedances. Seismic measurements while drilling, and reverse VSP also have the potential for predicting pore pressure conditions ahead of the bit in real drill time (Stone, 1983; Hardage, 1994; Dutta et al, 2002).
The Seismic Geopressure Detection Problem
For accurate interpretation, all of the seismic techniques require a fundamental understanding of the basic rock physics of soft sediments and overpressures in the Gulf of Mexico. While saturation, lithology, and pressure effects on bright spots and AVO are reasonably well known for consolidated rocks, they are barely understood in unconsolidated sediments. Furthermore, the scale-dependence of velocities is not always accounted for when using seismic measurements at different scales. What is lacking is the relation between physical properties of soft sediments, pore pressures, and their seismic signatures such as wave velocities, reflectivities, and impedances.
Abnormally high pore pressures affect a broad cross-section of geophysical and geological processes. Geopressure implies low effective stresses and increased porosity, which in turn have a pronounced effect on geophysical properties such as seismic velocity, density, resistivity and strength, especially in soft or unconsolidated sediments. The changes in the physical properties also impact various geological processes in the Gulf coast such as growth faulting, diapirism, differential compaction, and fluid migration.
Seismic wave propagation in porous rocks is affected by various factors including lithology, porosity, fluid type and saturation, and pore pressure. Each of these parameters governs the effective elastic moduli, which, along with the density, determine the seismic velocity and impedance. However, the relations among velocity, porosity, and pore pressure are not always simple. Effects of pore pressure may sometimes be masked by variations in other parameters. Furthermore, these parameters are often not independent of each other. Typically, compressional and shear velocities in crustal rocks increase with confining pressure as confining pressure closes the soft, crack-like porosity and increases the contact stiffnesses between grains. The effect of pore pressure is to counteract that of confining pressure by propping open the pore space. High pore pressure tends to lower the velocity. The relative change depends substantially on the type of the rock, the pore microstructure, the loading-unloading history, and the fluid saturation. Pore pressure effects are enhanced in rocks with soft pore space compressibility. Velocities also tend to decrease with increasing clay content and porosity. So, for example, an observed anomalously low velocity might be interpreted as due to high pore pressure or due to spatial variations in clay content or porosity. The uncertainty in the interpretations depends on the variance or spread in the range of clay and porosity. Interpretations in terms of pore pressure tend to be more accurate in formations that are more uniform and homogeneous with small variances in porosity and clay.
Lessons from Consolidated Gulf Coast Sandstones
Laboratory measurements play an important role in understanding rock properties and developing appropriate rock physics models. The experimental configuration for determining effects of pore and differential pressures on seismic properties should allow measurements of velocity at various confining and pore pressures. The first step in the experimental procedure is to first fully saturate the sample. This is usually done by applying a vacuum to the dry sample and then allowing the pore fluid to enter the evacuated sample. Unconsolidated materials are harder to handle and require special care. For unconsolidated material, care should be taken to ensure that the sample experiences only very small pressure changes that do not change its initial conditions. Strains in the sample due to pressure are monitored using length gauges. In consolidated samples only length measurements are made. However, in unconsolidated sediments, it is advisable to also measure radial strains. The strains can be directly related to changes in porosity with pressure.
Laboratory work has shown that seismic velocity, porosity, and pressure are well-correlated in consolidated Gulf Coast sandstones. Han’s (1987) extensive laboratory study shows the expected trend of velocity decreasing with increasing porosity, but with considerable scatter. Han discovered that the scatter was related primarily to clay content, and that (at 40 MPa) the brine-saturated data can be described remarkably well (correlation coefficient of 0.98) with a linear regression of the form
where ϕ is the porosity, and C is the clay volume fraction. The negative coefficients on ϕ and C indicate that both porosity and clay tend to reduce velocity.
As with most reservoir rocks, the data showed a large contrast between brine saturated and gas saturated velocities, particularly for P-waves. The regression for gas saturated shaly sandstones at 40 MPa effective pressure is
The correlation coefficient is 0.93, slightly worse than for water saturated velocities, and is attributed mostly to an increased sensitivity to consolidation. Similar results have been found by DeMartini et al. (1976), Tosaya (1982), Klimentos and McCann (1990), and Best et al. (1994). With the clay correction applied, the velocity-porosity data for the clay-rich Gulf sandstones can also be described with reasonable accuracy using a modified Voigt average (Nur et al., 1991). This model applies when the rocks span a range of depths, and the porosity is controlled by increasing geologic age, diagenesis, and cementation. For rocks confined to limited depth intervals, with relatively constant diagenesis, and variations in porosity controlled by texture and sorting, the velocity-porosity trends are given by other forms described later. These systematic trends, for both clean and clay-rich sediments, illustrate the predictive potential of the seismic data. At the same time, they highlight the importance of properly characterizing lithologic and saturation effects.
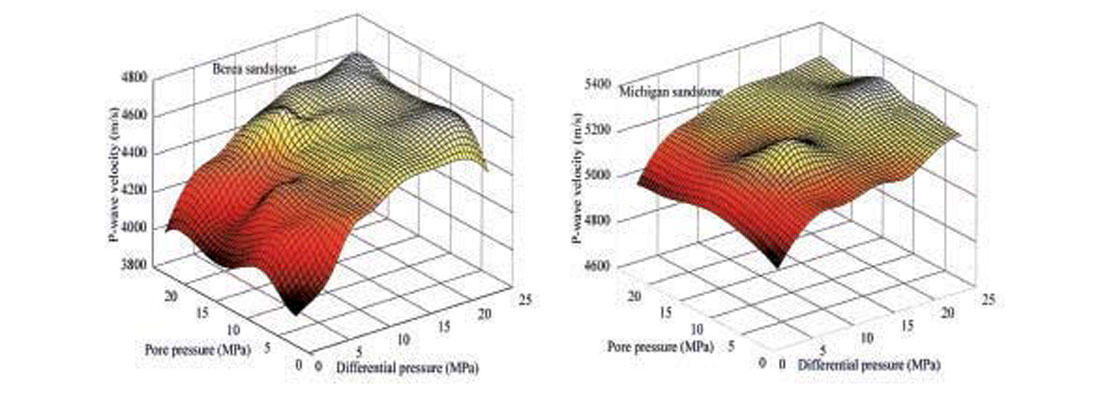
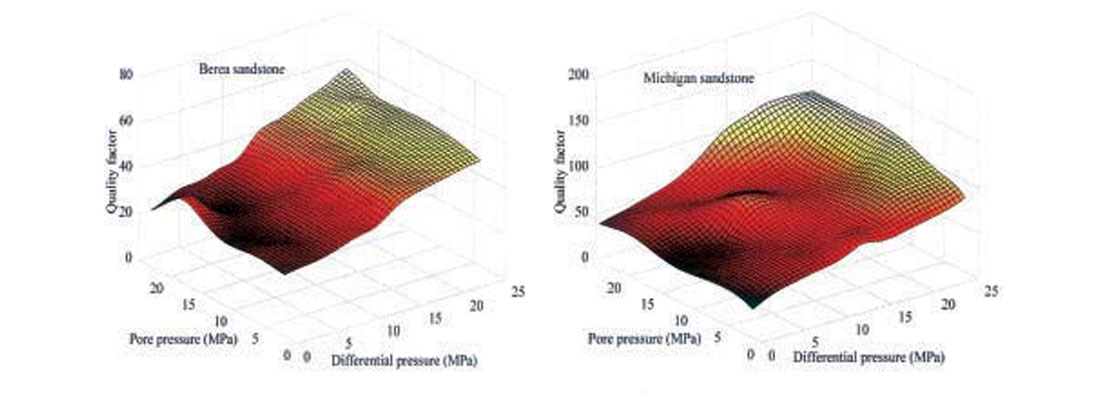
Prasad and Manghnani (1997) have studied effects of increased pore pressure (Pp) on Vp and the P-wave quality factor, Qp, in consolidated sandstones at different confining pressures (Pc). They find that Vp and Qp increase with both increasing differential pressure (Pd = Pc - Pp) and increasing Pp. The effect of Pp on Qp is greater at higher Pd. Their results show that the effective stress coefficient, a measure of pore space deformation, for both Vp and Qp is less than 1 and decreases with increasing Pd. Variations in Vp and Qp as functions of pore- and differential pressures for two sandstones are presented in Figures 4 and 5. The velocity plots (Figure 4) show a strong dependence of Vp on Pd and a weak dependence on Pp. The quality factor (Figure 5) changes not only with Pd but also with Pp. This dependence of Qp on Pp is greater at higher Pd. The increase in Vp with increasing Pp is between 1—2 % (above experimental error) and the increase in Qp is between 15— 20 %.
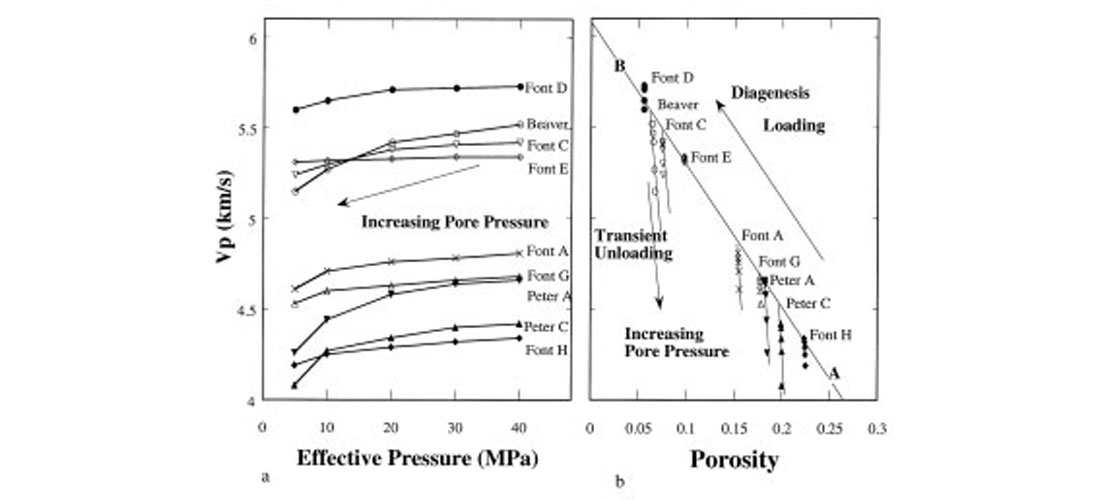
Figures 6a and 6b show ultrasonic laboratory-measured P-wave velocities (Han, 1987) in clean, water-saturated Gulf Coast sandstones as a function of effective pressure (confining pressure minus pore pressure) and porosity, respectively. The velocities increase with increasing effective pressure (Figure 6a). The effect of pore pressure is to counteract that of confining pressure by propping open the pore space. Thus high pore pressure tends to lower the velocity. The relative change depends substantially on the type of the rock, the pore microstructure, and the fluid saturation. It is clear, however, that at high effective pressure, while velocity variation with effective pressure is not large, the variation with porosity is significant (Figure 6b). As described earlier, this dependence in clean sandstones is very systematic and can be modeled by linear regressions obtained from a statis-ical analysis of existing core data within the formation of interest.
Geologic and Transient Loading
An important distinction has to be made between the effects of transient, short-term pore pressure changes as observed in the laboratory, and geologic, long-term pore pressure changes. It is well recognized that velocity-effective stress relations depend on the loading-unloading history of the rock (Bowers, 1994). On the loading branch, as diagenesis proceeds, high-porosity, lowvelocity sands are compacted and move towards lower porosities and higher seismic velocities (from point A towards point B in Figure 6b). Excess pore pressure generated due to rapid burial and undercompaction acts in the opposite direction and prevents diagenesis. This keeps the sandstones from moving up the line towards point B.
Unloading, when a certain stage of diagenesis is reached, takes a different path in the velocity-porosity plane. We believe that the laboratory measurements of velocity as a function of effective pressure (Figure 6a) is representative of this unloading path. The unloading behavior and the decrease in seismic velocity upon unloading depend substantially on the pore microstructure and the presence of soft, compliant pores. For example, in Figure 6 the Fontainebleau E sample shows almost no decrease in velocity with increasing pore pressure, while Beaver sandstone shows an observable velocity decrease on the unloading line. These facts help us to form a principal strategy for inferring porosity from seismic. Core data, when available, can be used to define the loading and unloading curves in the velocity-porosity space. The unloading behavior is described by the velocity-effective pressure data, while the velocity-porosity trends delineate the loading behavior. However it must be noted that the loading curve, and porosity decrease is not unique but depends on the temperature history of the sediment. In the absence of any core or well data, the loading and unloading trends will have to be borrowed from data on geologically and statistically similar formations that have undergone a similar time-temperature history.
Dependence on Depth
Porosity-effective stress curves play an important role in defining normal porosity vs. depth trends. Shale porosity data from Gulf Coast wells (Hunt et al., 1994) suggest that our understanding of porosity-depth behavior is still far from complete. For example, it has been found that under hydrostatic conditions, porosity tends to decrease linearly along a two-stage compaction curve to a point beyond which there is no further compaction. This is in contrast to the widely used exponential porosity-depth trends (Hart et al., 1995). The behavior depends on the type and amount of clay minerals, and adsorbed water layers. Moreover, changes in porosity depend on the loading and temperature history. Overpressure from fluid expansion during hydrocarbon generation can unload the sediment column (Ward et al., 1995). Therefore it is necessary to understand both the loading and unloading stress behavior of porosity in unconsolidated clay sediments. Such compaction relationships are extremely valuable inputs for constructing models of geopressure build-up in clastic basins (Dutta, 1984).
In soft sediments, more than any other reservoir rock, the sensitivity of seismic velocities to variations in saturation and pore pressure remains large even at great depth. With normal trends of compaction, cementation, and effective stress, these sensitivities are usually suppressed. However, in many cases overpressures not only reduce the effective stress, but also suppress cementation and compaction, thereby preserving the seismic sensitivity. It is important to find out whether these effects persist to great depth in the Gulf Coast environment.
Tackling Unconsolidated Sand-Clay Systems
In spite of experimental (Laughton, 1957; Schreiber, 1968; McCann and McCann, 1969; Hamilton, 1971; Elliot and Wiley, 1975; Domenico, 1977; Blangy, 1992) and theoretical work (Brandt, 1955; Walton, 1987, Digby, 1981) velocity, porosity, and pore pressures in young, unconsolidated sediments common to the offshore Gulf of Mexico is not very well understood. In such environments, seismic velocities are usually low, and sensitivity of seismic velocity and impedance to changes in pore pressure, saturation, and stress is exaggerated. For example, the widely used Wyllie time-average equation, adequate for clean consolidated sandstones at depth, becomes inappropriate in partially gas-saturated unconsolidated sands (Elliot and Wiley, 1975). We present here some of the considerable progress that we have made during the last few years in understanding velocity-porosity-pressure relations of unconsolidated sand-clay systems, as found in the offshore Gulf of Mexico.
High pore pressures reduce the total effective pressure acting on the framework of the sediment in both consolidated and unconsolidated formations. However, the amount of effective pressure reduction due to increased pore pressure depends on the state of the formation. In unconsolidated sediments, pore pressure (Ppore) reduces the overburden pressure (Poverburden), so that the total effective pressure Pe = Poverburden – Ppore. As a consequence, the frame is softened and, in extreme conditions of very high pore pressure (i.e., low effective pressure), the formation approaches a state of suspension. Since P-wave velocity in a suspension is close to that of the suspending fluid (usually water) and S-waves cannot propagate in suspensions, the Vp/Vs ratio or Poisson’s ratio must dramatically increase as a sediment passes through the transition zone from load bearing to a suspension. Thus, at low effective pressures when the sediment approaches critical porosity and starts to loose its shear strength, Vp-Vs and Qp – Qs ratios show large changes and can be used to predict over-pressured zones. In consolidated rocks, on the other hand, the pore pressure is usually not enough to break the cement. Its effect is to reduce the effective pressure acting on the rock. Prasad and Manghnani (1997) amongst many others have shown that pore fluids contribute to stiffening the rock. The stiffening effect of pore fluids at low seismic frequencies (e.g. surface seismic frequencies) can be modeled by the well-known Gassmann’s (1951) equations. This stiffening effect is larger at higher pore pressures because the pore fluid bulk modulus itself is usually higher at higher pressures.
An important element determining the sensitivity of soft sediments to changes in pore pressure and pore fluid saturation appears to be the sediment’s position relative to the Reuss bound. Soft sediments at very low effective stress can act as suspensions, with velocities related to porosity via Wood’s (1941) relation (Reuss average). The Reuss (1929) average quite accurately represents unconsolidated systems in which solid grains are totally surrounded by fluid so that the net stress is zero (pore pressure = confining pressure). Figure 7 (Marion, 1990) shows velocity-porosity relation for suspended grains (porosity > 0.38) and for sandstones (porosity < 0.38). The data fall close to the Reuss curve for porosities above 0.38.
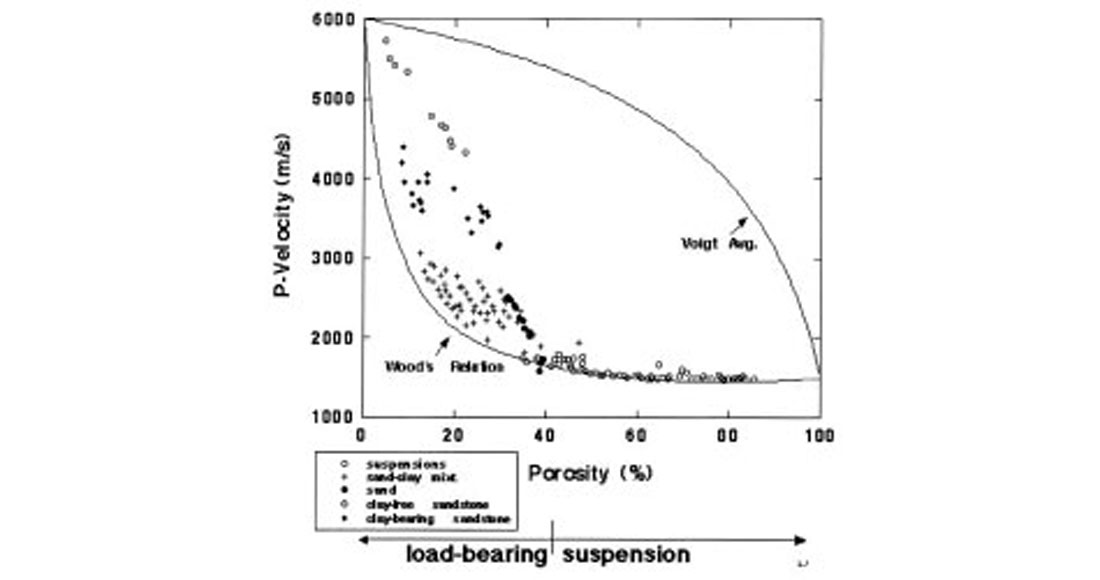
At smaller porosities, the velocity, and equivalently the effective moduli, depart abruptly from the Reuss curve as the grains come into contact to form a mechanically load bearing skeleton. The “critical porosity” at which the suspended sediments transform from iso-stress to solid load-bearing is a fundamental property of unconsolidated soft sediments. Each class of unconsolidated material—defined on the basis of its common diagenetic process and mineralogy—has a typical critical porosity value. Increasing pore pressure moves seismic properties toward the Reuss bound at critical porosity. At the same time, the sensitivity of seismic velocity to changes in pore fluids and pore pressure increases. Hence, the Reuss bound may act as a reference point for understanding overpressures in these materials. Since the critical porosity is a purely geometric property, it is a robust and powerful constraint on the applicability of theoretically derived velocity-porosity relations.
To explore the effects of lithology and pressure, Yin et al. (1988), and Marion (1990) measured acoustic velocities in unconsolidated sand-clay mixtures as a function of clay content, both at dry and brine-saturated conditions. The results (Figure 8) reveal systematic non-linear variations in porosity and velocity with clay content and with pressure. Between 0 to 25% clay content the compressional velocity increases as the clay content increases. Beyond 25% clay content, the velocity begins to decrease. The measured porosity has a minimum at 25% clay fraction. The minimum in porosity shifts to lower clay fraction with increased pore pressure. With increasing effective stress the mixture compacts and the porosity decreases. A simple binary mixture model (Cumberland and Crawford, 1987; Marion, 1990) allows for straightforward predictions of the velocity-porosity-clay relations in these types of sediments. The velocity and porosity variations are clearly due to the fraction of clay in the sample and the geometrical arrangement of sand and clay particles.
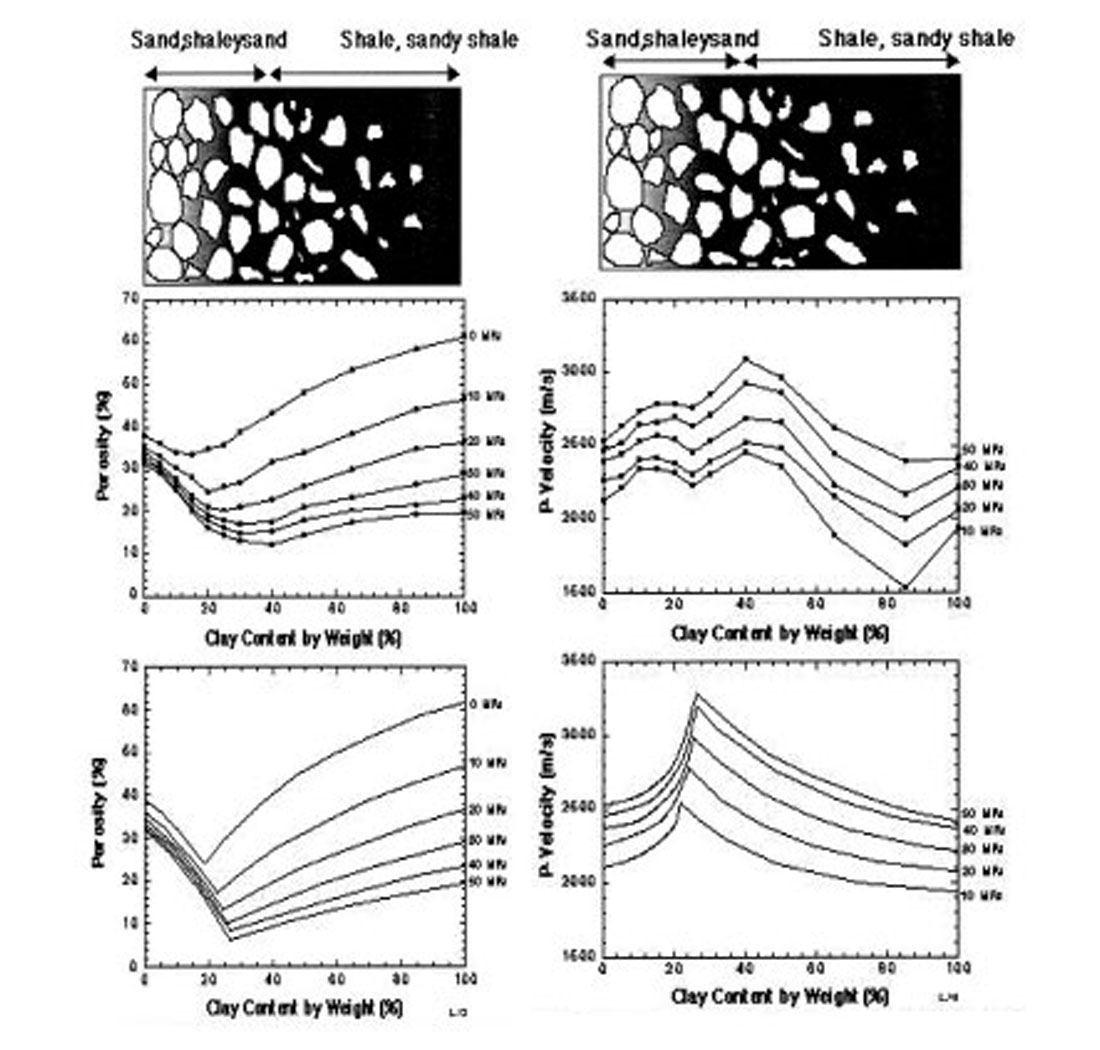
An important conclusion from this work is that the properties of shaly sands do not necessarily lie between those of the sand and clay end members. Therefore, the bounding surfaces between strata may have unexpected properties, such as anomalous velocities, reflectivities, porosities and permeabilities, not necessarily falling between the properties of the separate units. For example, the transition zone between two moderately permeable layers may in fact be a barrier or seal to flow.
Since the relations are non-linear, they are not well described by simple linear regressions. A model-based approach, recognizing the spatial arrangement of sand and clay particles is necessary. In this binary mixture model for unconsolidated sediments, clay minerals are dispersed primarily within the sand pore space (intrapore clay) in shaly sands, while in sandy clays, sand grains are dispersed in a clay matrix. Such a dispersed sand-clay system can have a different porosity-clay content behavior from sands with massive, laminar clay, or a sediment with authigenic clay. Other linear porosity-clay content relations have been reported in naturally compacted and laboratory compacted mixtures of sand and clay (Thomas and Steiber, 1975; Pittman and Larese, 1991). Porosity-clay content relations directly impact the seismic signatures of shaly sands since seismic velocities are related to porosities. An obvious area of research is to refine our understanding of the relation between porosity and clay content in shaly sands.
Prasad (2002) has shown that for unconsolidated sediments, very low effective pressures can be detected by changes in Vp/Vs ratios and by changes in P- and S-wave amplitude and frequency content. At very low pressures, both P- and S-wave amplitudes change drastically. However, for a pressure change of about 1 MPa, the frequency content of the P-waves changes only by about 8%; the corresponding change for S-waves is over 150%.
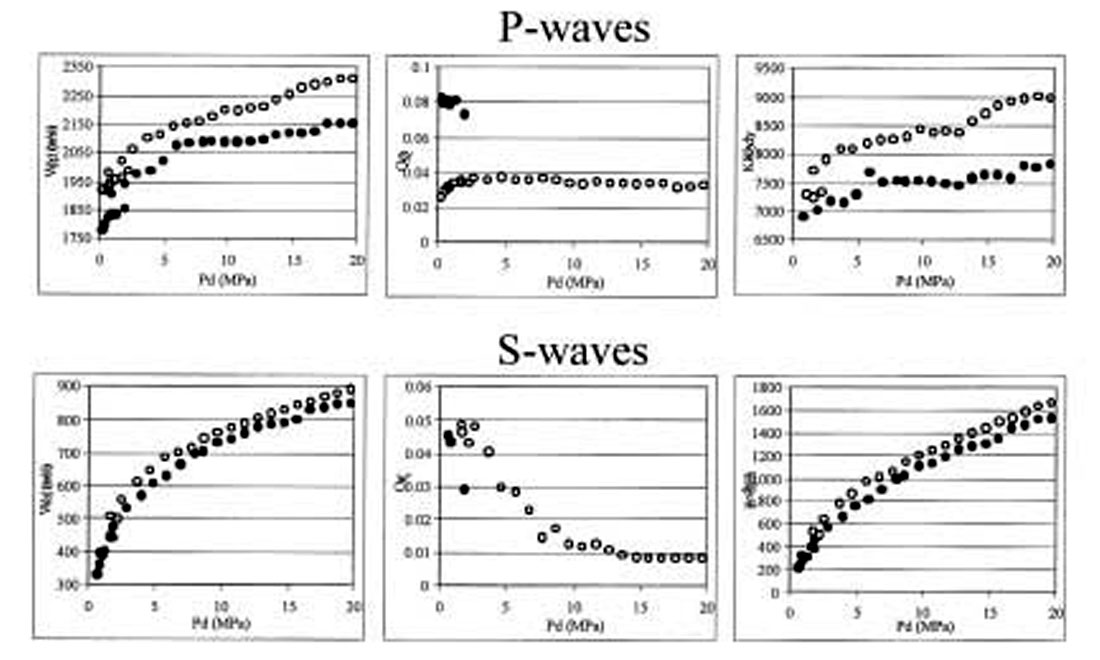
Figure 9 shows Vp, Vs, dynamic shear (μ) and bulk (k) moduli, and Qp and Qs variations with pressure for two water saturated sands: coarse-grained (open circles) and fine grained (closed circles) from Prasad and Meissner (1992). The plots show a difference in the pressure dependence between P- and S-waves; pressure appears to have a larger effect on shear waves than on compressional waves.
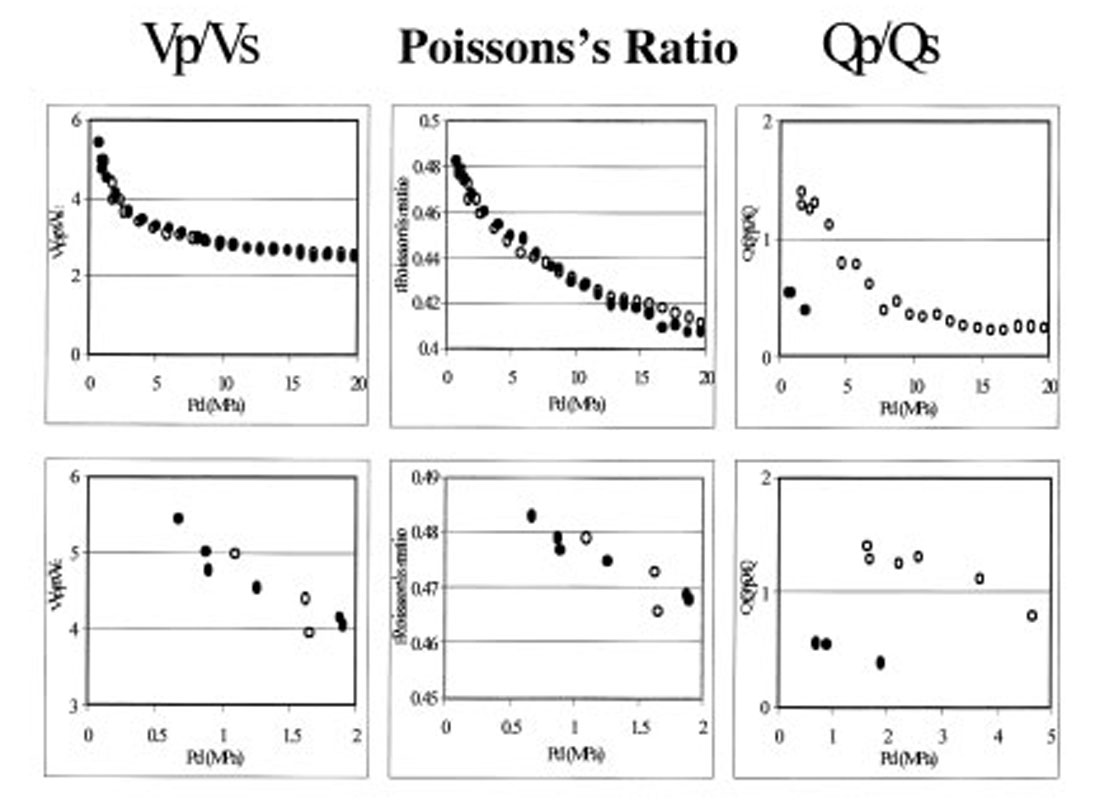
Figure 10 shows Vp/Vs, Qp/Qs, and Poisson’s ratio as a function of pressure in two water saturated sands: coarse-grained (open circles) and finegrained (closed circles) calculated from Prasad’s data (Prasad, 1988). There is an exponential decrease in all three quantities with pressure. To better visualize the changes at low pressures, the lower row in Figure 10 shows the same results zoomed in at lower pressures.
Vp – Vs ratio
The Vp/Vs ratio is one of the critical seismic signatures that can detect low effective pressure (high pore pressure). Traditional seismic approaches for pressure prediction did not give much consideration to Vp/Vs ratio because it could not be estimated from conventional P-velocity data. Modern methods using pre-stack far-offset seismic data now make it possible to extract Vp/Vs information. Figure 11 shows a compilation of the Vp/Vs data from Prasad (2002). There is a clear linear trend of Vp/Vs versus pressure on the log – log plot.
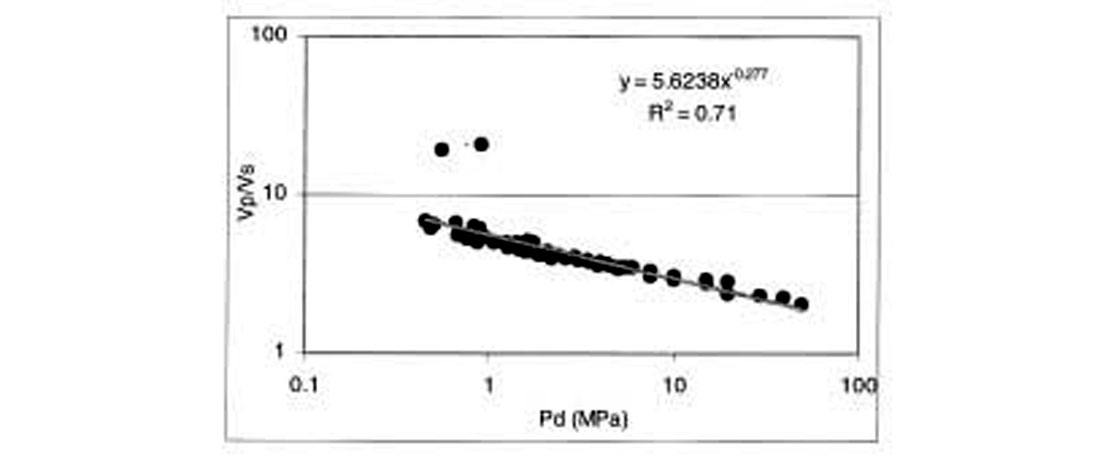
The solid line is an empirical fit for the data. The figure shows that a general empirical law can be defined for the Vp/Vs behavior with pressure for sands as Vp/Vs = 5.624*Pd-.277, with a coefficient of Regression for this fit (R2) of 0.7.
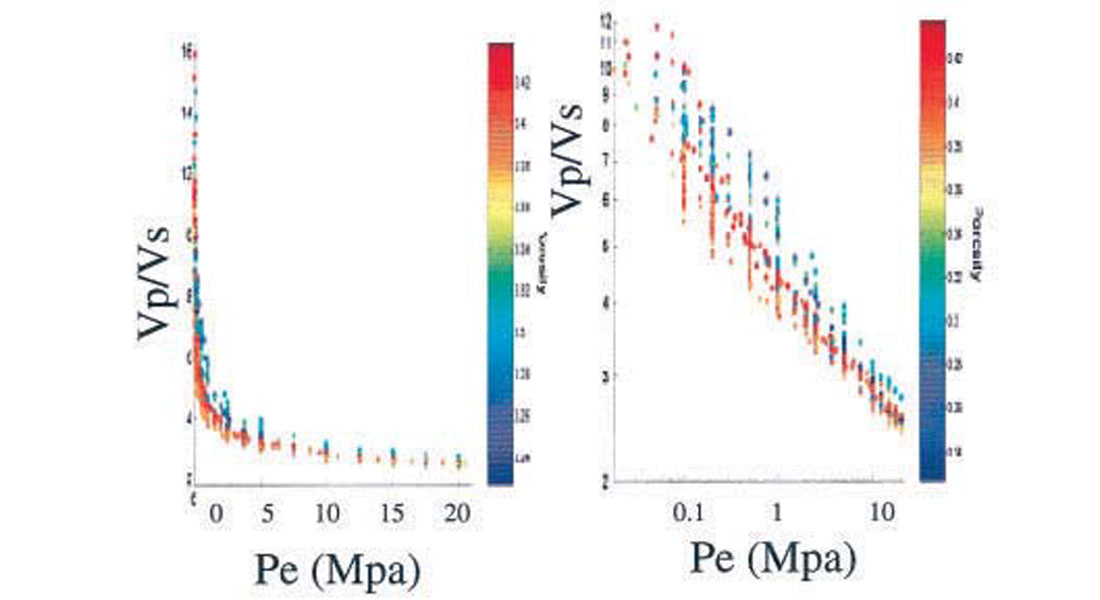
Zimmer et al. (2002) have shown that in addition to pressure, porosity also plays a role in the Vp/Vs ratio at low pressures. They have analyzed velocity data in dry glass beads and sands. The Vp/Vs ratios for the Gassmann fluid-substituted data are shown in Figure 12, plotted against pressure and color-coded by porosity. The water saturated Vp/Vs ratio shows a dramatic rise as the effective pressure decreases. The VP/VS ratio increases from below 3 at 10 MPa to a mean value of about 7 at 0.5 MPa. In Figure 12a, the scatter in the data, especially at low pressures, makes pressure prediction based on Vp/Vs ratio uncertain. However, Figure 12b shows that this scatter can be directly related to porosity variations.
One complicating and poorly understood factor that may affect the apparent reflectivity and AVO response of pressurized, gas-bearing zones is stress-induced seismic velocity anisotropy and attenuation (e.g. Nur, 1971; Yin et al., 1993). The general effect of increased pore pressure is to increase the sensitivity of velocities to confining pressure, and therefore also to non-hydrostatic stress. In soft sediments, stress-induced velocity anisotropy is enhanced at high pore pressure, so that even small deviatoric stress can cause significant velocity anisotropy. This anisotropy could lead to effects that may be detected seismically, for example with 3-D AVO, especially when the two horizontal stresses are unequal (as might be the case in the extensional Gulf Coast). If so, very significant information not only about anisotropy but also about pore pressure might become available. The importance of correcting for anisotropy and non-hyperbolic moveout is discussed in Dutta et al. (2002).
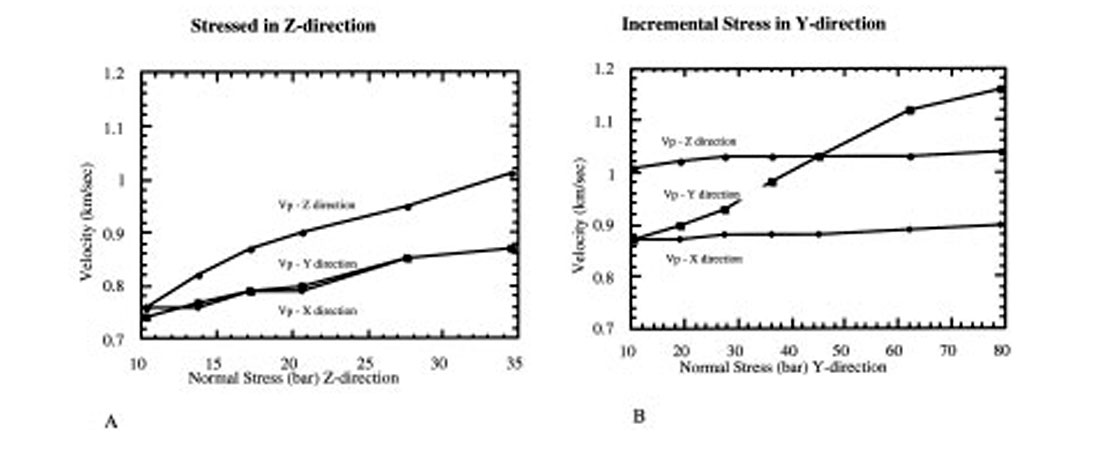
Figure 13 shows P-wave velocities collected by Yin (1992) in unconsolidated sand, illustrating the exaggerated effect of stress-induced anisotropy in soft sediments. The sample is intrinsically isotropic at hydrostatic stress, but increasing σzz creates anisotropy (13 A). Increasing σyy (13 B) creates an orthorhombic anisotropy.
Effects Of Diagenesis and Cementation
The seismic properties that are used as indicators of overpressure in young sediments are highly dependent upon diagenesis and nature of cementation. During burial, acoustic properties of the sediments change dramatically due to mechanical and chemical compaction processes. Diagenesis can in general be divided into 3 zones: (1) shallow burial diagenesis (0-80° C); (2) intermediate burial diagenesis (80-140° C); and (3) deep burial diagenesis (> 140° C) (Surdam et al., 1989). During early burial, packing and mechanical compaction dominates the diagenetic reduction of porosity (Ramm, 1992). Seismic velocity increases with compaction, because of increased grain contact and detrital clay infiltration.
Carbonate cementation is another important diagenetic event in the shallow Gulf. As we discuss below, even small amounts of carbonate cement, depending on its distribution, can substantially increase seismic velocities in slightly cemented sands. During intermediate burial diagenesis, the carbonate cement formed during the shallow burial diagenesis starts to dissolve because of higher temperatures, enhancing the porosity. This is common in the Gulf of Mexico where carbonate cementation is present normally above 10,000 ft, and more or less absent below it.
During deep burial, porosity in clean sands is reduced and velocity increased by pressure solution and related quartz cementation. However, this process is inhibited by the presence of depositional clay, chlorite rims, and geopressuring. Diagenetic cementation may be critical to the formation and competence of low-permeability seals, hydraulically isolating basin compartments (Bradley and Powley, 1994; Ortoleva, 1994). Thus diagenesis is a significant controlling factor on porosity and pore pressures. Since, as we have shown, seismic velocities depend on porosity and clay, these diagenetic relationships can play an important role in determining the accuracy of overpressure prediction from seismic observations.
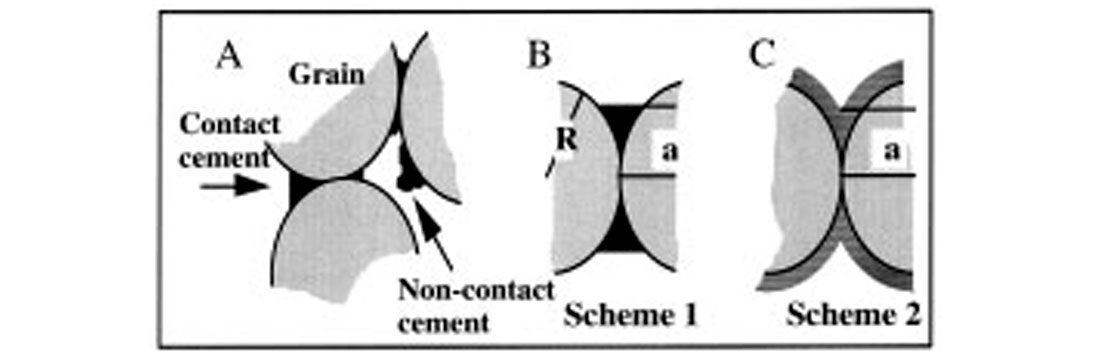
To understand the effects of cementation on the seismic properties of soft sediments, we analyzed two laboratory datasets. The first set is a slightly cemented quartz sand; the second, an unconsolidated and almost uncemented sand. We find that dryrock ultrasonic velocities in the slightly cemented samples can be well modeled by the cementation theory of Dvorkin et al. (1991, 1994) where the grains mechanically interact through quartz or clay cement. In the unconsolidated samples contact cement is almost absent and grains are held together primarily by confining pressure. In this case velocities can be modeled by a combination of the Hertz- Mindlin contact theory (interaction of two smooth uncemented spheres) and the modified Hashin-Strikman lower bound. The latter approach allows us to introduce pressure dependence into the velocity model. This theoretical model serves as an accurate lower bound for the unconsolidated velocity values. An important result is that this Hertz-Mindlin-Hashin-Strikman (HMHS) model can predict the high Poisson’s ratios generally observed in saturated loose sediments. An important implication of our cementation theory is that even very soft cement is load-bearing. Thus, even very small amounts of cement, if deposited at the grain contacts, can significantly increase the stiffness of a granular composite. The stiffening effect of cementation depends on the distribution of cement within the pore space (Figure 14) and can give rise to different seismic signatures. Non-contact cement reduces the porosity without significantly increasing the elastic stiffness.
Poisson’s Ratio, AVO and Pore Pressure in Soft Sediments
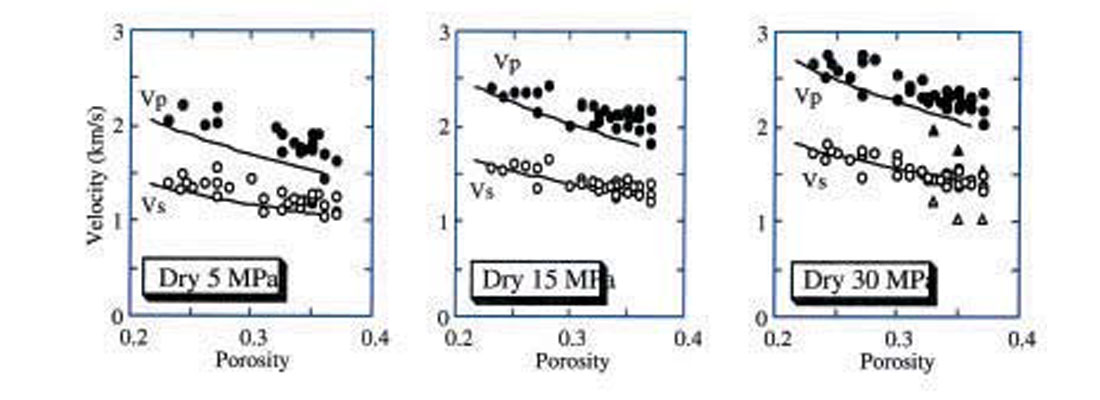
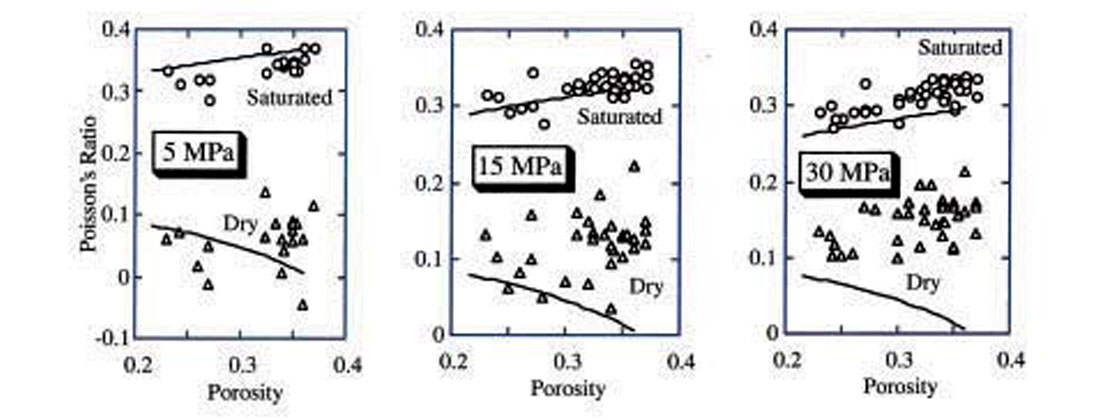
Analysis of AVO signatures can potentially play an important role in predicting gas zones and seals of overpressured compartments (Louie and Asad, 1994). For any AVO modeling, knowledge of sediment Vp/Vs ratios or equivalently Poisson’s ratio is essential. Figure 15 shows dry velocities (Vp and Vs) in the unconsolidated samples at different confining pressures along with our theoretical estimates obtained from the HMHS model. The theoretical results for dry sediments generally serve as an accurate lower bound for the experimental values. Figure 16 shows that our theory can predict the saturated low frequency Poisson’s ratio quite accurately, but the Poisson’s ratio for dry sediments are more scattered and unpredictable, especially at higher confining pressures. An important goal of ongoing research is to establish a better fundamental understanding of Poisson’s ratio in soft sediments as an essential input for reliable AVO modeling and inversion.
As mentioned earlier the decrease in the P-wave velocity with increasing pore pressure has been used in traditional methods for overpressure detection as well as in recent modifications of the traditional methods (e.g., Grauls et al., 1995; Moos and Zwart, 1998). However, velocity does not uniquely indicate pore pressure because it also depends, among other factors, on porosity, mineralogy, and texture of rock. One way to resolve this ambiguity and improve the reliability of seismically detecting pore pressure changes during production as well as overpressure detection is by using the Poisson’s ratio (PR). Poisson’s ratio can be calculated from the P- and S-wave velocity, and used as a pore pressure indicator. This PR effect was probably implicitly used by Pigott et al. (1990) and Pigott and Tadepalli (1996) in estimating pressure from AVO inversion in carbonates and clastics. We will show that this PR-pressure effect exists in many sandstones as well as in other rock types and suggest practical ways of using it for pore pressure monitoring and overpressure prediction.
PR (ν) can be calculated from the compressional- and shear-wave velocity (VP) and (VS) respectively) as
Nur (1969) was probably first to record the decrease of PR with decreasing differential pressure in room-dry granite (Figure 17) and dolomite samples. Toksoz et al. (1976) also present this effect and propose to use Poisson’s ratio to identify saturating fluids. Nur and Wang (1989) state that the Vp/Vs ratio in gas-saturated rocks increases with increasing differential pressure. Wang (1997) supports this statement by laboratory velocity measurements in carbonate samples.
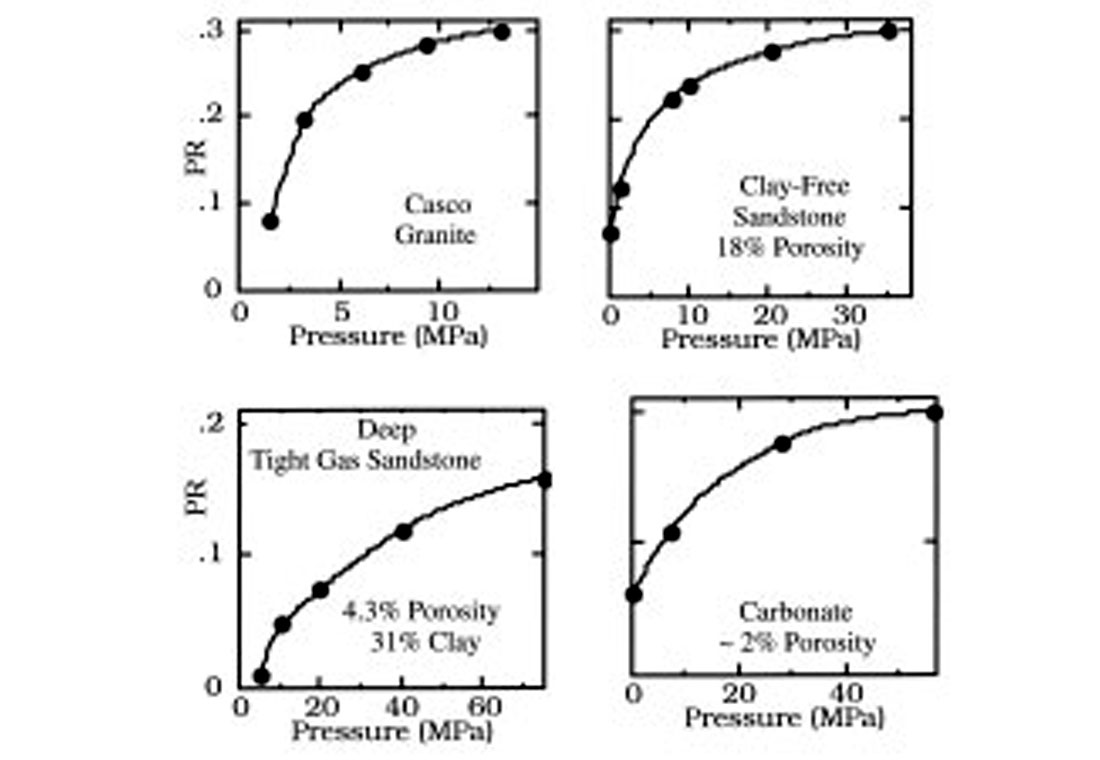
This effect appears to be general and can be observed in many sandstone and sand samples. Data from some of them are given in Figure 17 where the porosity range is between zero and 40% and the clay content range is between zero and 45%. The compressional-wave velocity varies significantly among these samples but PR invariably decreases with decreasing differential pressure.
To theoretically explain the observed effect of PR increasing with increasing differential pressure, we assume that the observed velocity and elastic moduli variations versus pressure are due to the closure (as differential pressure increases) and opening (as differential pressure decreases) of compliant thin cracks in the rock. We numerically simulate the effect of differential pressure on elastic moduli in a sandstone sample used in Figure 17. Specifically, we assume that the porosity occupied by thin cracks of 0.001 aspect ratio decreases from 1% at zero differential pressure to zero at 35 MPa. We introduce an elastic body whose bulk and shear moduli are the same as of the sample selected at 35 MPa, and then populate it with the cracks gradually increasing the crack porosity from zero to 1%. The effective medium theory we use to calculate the elastic moduli of the body with cracks is the self-consistent approximation (SC) of Berryman (1980).
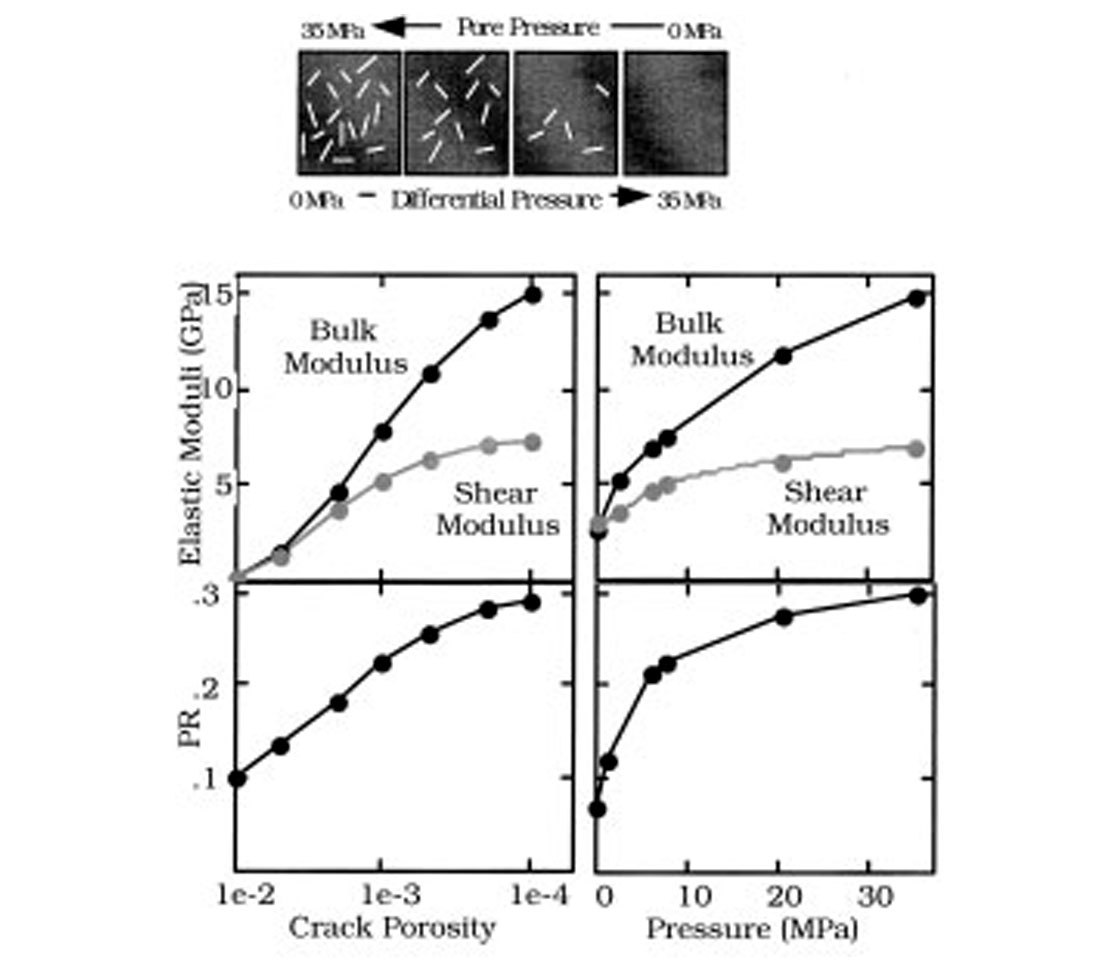
The modeling results shown in Figure 18 not only qualitatively but also quantitatively mimic the laboratory data (as long as the pressure to crack porosity transform is correct). Our mathematical modeling is consistent with the observed effect of pressure on Poisson’s ratio and establishes the generality of the phenomenon. This theoretical explanation of the effect under examination should be valid for many granular rocks where compliant grain contacts resemble thin cracks and compliant cracks may be present within the grains.
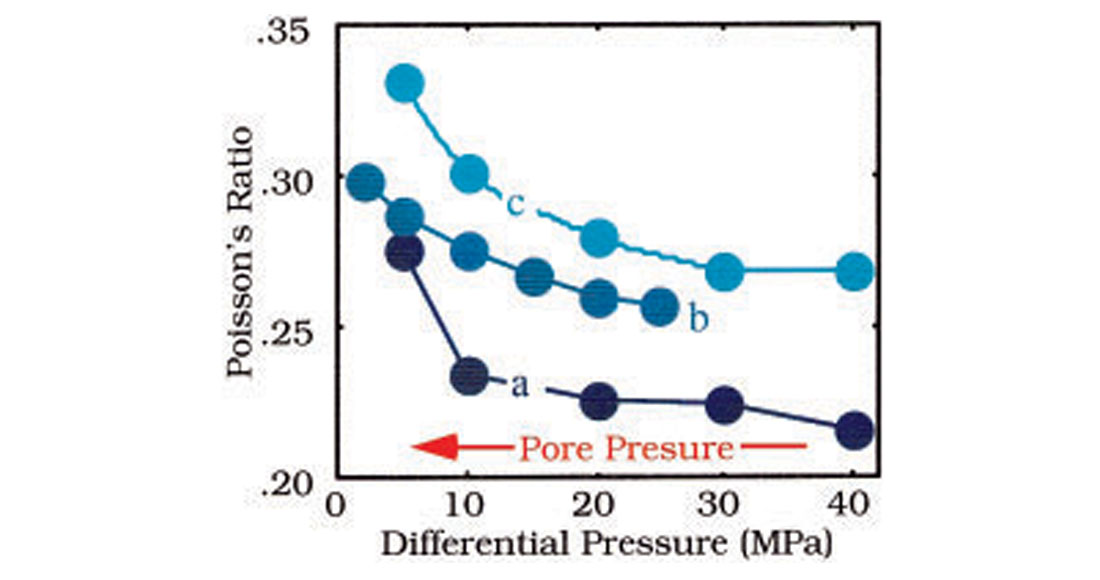
Laboratory data for three water-saturated shale samples are summarized in Figure 19. In these rocks, Poisson’s ratio increases with the decreasing differential and increasing pore pressure. However, one may observe the opposite effect as well. The direction of the saturated-rock PR change depends on the porosity and elastic moduli of the sample and has to be tested by using fluid substitution with the dry-rock data. It is apparent that the ranges of Poisson’s ratio variation are different in different samples. It is likely to be site-specific and depend on porosity, texture, and mineralogy.
Conclusions
This paper described our current understanding of many of the rock physics results that are critical for understanding the seismic signatures of overpressures. Well logs obtained after drilling are the most extensively used and reliable means to construct rock models and delineate geopressures. It is most valuable, of course, to detect overpressure before drilling. Reflection seismic methods are commonly used to predict pore pressures from the surface. The physical basis for the determination of porosity and pore pressures from seismic measurements has been the often observed correlations between seismic velocity, porosity, and pore pressure. Anomalously high pore pressure zones are often associated with high porosities and low seismic velocities. In spite of significant advances in seismic techniques, accurate interpretation requires a fundamental understanding of the relation between physical properties of overpressured sediments, time-temperature history, pore fluids, and pore pressures, and their seismic signatures such as wave velocities, reflectivities, and impedances. We show how laboratory data can be used to determine rock physics transforms that are appropriate for the loading and unloading limbs of the sediment stress history. Unconsolidated sediments are particularly susceptible to overpressures, and the rock physics of unconsolidated sediments is far from complete. It is an area of ongoing research. We show the added value of Poisson’s ratio or VP/VS ratio (obtained, e.g,. from shear wave information) for reducing ambiguities in seismic prediction of overpressures. The recent progress of geophysical measurement technology can allow one to extract shear-wave data from surface and marine (bottom cables) reflection profiling, well logs, and cross-well measurements, and, in the future, from measurements ahead of the drill bit. Because of this, the observed and theoretically confirmed effect of decreasing Poisson’s ratio with increasing pore pressure in rocks with gas can be used as a physical basis for more reliable pore pressure and pore fluid monitoring and overpressure detection. The Poisson’s ratio can be used to improve the reliability of traditional methods where only the compressional-wave velocity and density or porosity are used. Observations of pore pressure effects on seismic attenuation offer intriguing possibilities for future methods based on seismic attenuation data. As with all applications of rock physics, site-specific well log and laboratory measurements should be used when possible to quantify and calibrate the overpressure effects, taking into account the natural variability of rock properties.

Acknowledgements
We acknowledge the support of the Stanford Rock Physics Project. We thank WesternGeco for the permission to publish this paper.


Join the Conversation
Interested in starting, or contributing to a conversation about an article or issue of the RECORDER? Join our CSEG LinkedIn Group.
Share This Article