Seismic characterization of shale reservoir formations or source rocks is an important goal, considering the high level of activity in oil companies that are engaged in shale-resource exploitation across North America. Well logging carried out in these formations yields some of the measured parameters helping us understand their properties. Resistivity and velocity are two such parameters that are of interest, as they can indicate the presence of organic material or kerogen in these rocks. Higher values of resistivity and lower values of velocity seen on the well-log curves are indicative of the sweet spots in these formations. Passey et al. (1990) demonstrated that at any well location, ΔlogR is a useful measurement, in that when the resistivity and sonic transit-time curves are scaled and overlaid, they follow each other almost everywhere, except in the kerogen-rich zones where they crossover. However, our goal is to characterize the shale formations not vertically but laterally, so that sweet spots over different pockets could be detected and targeted for drilling. For doing this we turn our attention to seismic data. Any set of seismic attributes that incorporate both resistivity and velocity could be useful for the delineation of sweet spots.
In this study, we introduce a methodology for computing ΔlogR from seismic data. For doing this, the ΔlogR curve computed at well locations is correlated with different attribute curves that can be derived from seismic data. That attribute curve which shows the maximum correlation is selected and crossplotted against ΔlogR to determine the relationship between the two. This relationship is then used for extracting the ΔlogR volume from 3D seismic data.
Besides velocity and resistivity, porosity, gamma ray (GR) and brittleness are other parameters that are of interest for characterizing shale formations. We use extended elastic impedance for obtaining the GR and porosity volumes and simultaneous inversion for obtaining the brittleness volume. All these attribute volumes are determined for 3D seismic data over the Montney shale formation, one of the most active natural gas plays in Canada.
Introduction
Regional and thick shale reservoir rock formations are usually preferred for their economic exploitation. However, their physical properties vary in the vertical and horizontal directions. Of the many properties, maturation, mineralogy, pore pressure, organic richness, permeability, brittleness and gas-in-place are some of the key elements of a successful shale resource play (Chopra et al., 2012). Maturation and mineralogy are usually determined from geochemical analysis of the rock samples and are difficult to derive from seismic data. The organic richness of a shale formation is associated with the total organic carbon (TOC) contained in the rock and influences the compressional and shear velocities, as well as the density and anisotropy in these formations. Furthermore, there is evidence of a linear relationship between the uranium content in shale and its organic content (Mendelson and Toksoz, 1985). Consequently, though a large gamma ray response is seen for shale formations, but the uranium spectral gamma ray curves correlate better with the presence of organic content in the rock intervals. In conjunction with high TOC, high porosity is another prerequisite for better reservoir quality. Thus the computation of GR and porosity volumes from seismic data would allow the lateral mapping of organic content in a shale formation.
Brittle rocks fracture much better than ductile rocks and enhance their permeability, so shale reservoir rocks must exhibit high brittleness, if optimum production has to be sought from them. Such information can be extracted from the seismic data through Young’s modulus (E) or Eρ (product of Young’s modulus and density) and Poisson’s ratio (Sharma and Chopra, 2013). Since resistivity is primarily a function of the pore fluid, it is expected to be high in the high TOC pockets of the shale reservoir rocks. As resistivity cannot be directly extracted from the seismic, it is desirable to explore the seismically derived attributes that can be used to provide resistivity information. We attempt to derive resistivity with the application of Passey et al.’s (1990) approach to seismic data.
The method
As stated above, GR and porosity are two important and desirable properties for mapping the sweet spots in shale formations. While porosity can be determined by impedance inversion, there is no direct way of deriving GR attribute from seismic data. We follow the extended elastic impedance approach for deriving these volumes from seismic data.
Connolly (1999) introduced the idea of elastic impedance (EI) or angle-dependent impedance that provides a framework for calibrating and inverting non-zero offset seismic data. Later, Whitcombe (2002) proposed a redefined form of EI, which they termed as extended elastic impedance (EEI). The basic concept here is that though the angle range 0-30° is typically the recorded angle range in seismic data, theoretically, it is possible to extend it beyond the recordable angles. A correlation analysis between the calculated EEI log curves and the recorded log curves (including porosity and GR) is carried out. A high correlation between any pair of such curves yields an optimum angle which can then be used to predict rock physics parameters from seismic data.
The next link in the string is simultaneous inversion, which facilitates the estimation of P-impedance, S-impedance and density attributes from pre-stack seismic data. We begin with a low-frequency impedance model, which is used for generating synthetic traces using angle-dependent wavelets. These synthetic traces are compared with the equivalent real-angle traces, and the difference between them is minimized in a least squares sense by iteratively perturbing the modeled impedance values.
Once the P- and S-impedance volumes are obtained, it is possible to compute Young’s modulus and Poisson’s ratio volumes which can be treated as brittleness indicators. Although, density estimation from seismic data requires the far offset information, its quality and fidelity can deteriorate significantly at large angles of incidence. So, in the absence of density attribute, estimation of Young’s modulus is difficult. However, Eρ attribute can be used in such type of scenario for obtaining brittleness information (Sharma and Chopra, 2013).

For detecting organic-rich depth intervals in shale zones at the well locations, Passey et al. (1990) proposed a technique based on sonic and resistivity curves overlay. The transit time and resistivity curves are scaled in such a way that the two curves overlay each other. However, in the organic-rich intervals the two curves exhibit a crossover, which is a good indication. We extend Passey et al’s. (1990) approach with its application to seismic data. For doing this we first compute ΔlogR attribute from log data by using the equation

where rt is the resistivity and dt is the sonic transit time.
Next we crossplot this curve with other attributes that can be computed from seismic data. That attribute pair which shows the best correlation is picked up and the relationship between them is determined. This relationship is then used to determine the ΔlogR volume from seismic data.
Application to Montney play
The Montney play is one of the active natural gas plays in North America. The Montney is a thick and regionally charged formation of unconventional tight gas distributed in an area extending from north central Alberta to northwest British Columbia, Canada. The primary focus is the Lower and Upper Montney units for horizontal drilling, and we would expect that the Montney formation to exhibit high values of porosity, resistivity, gamma ray, and brittleness for being a prospective shale reservoir rock.
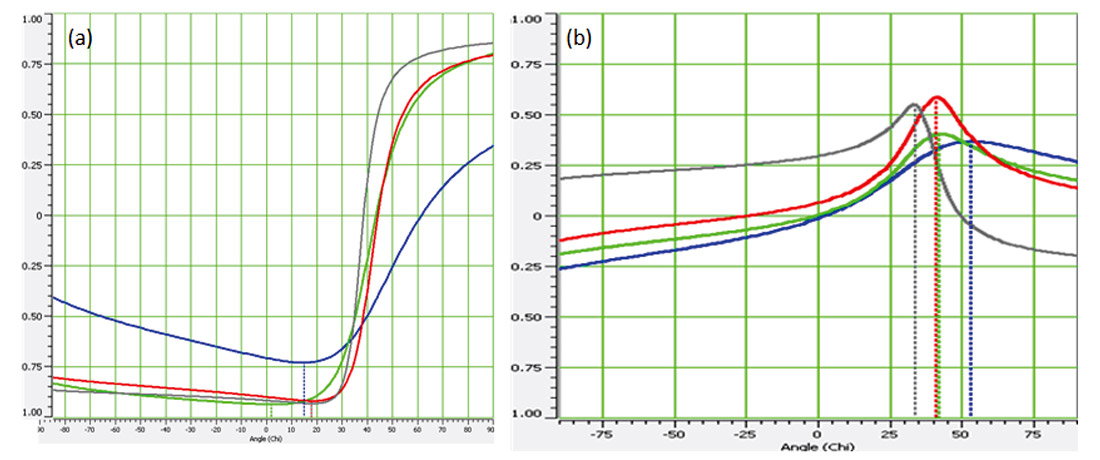
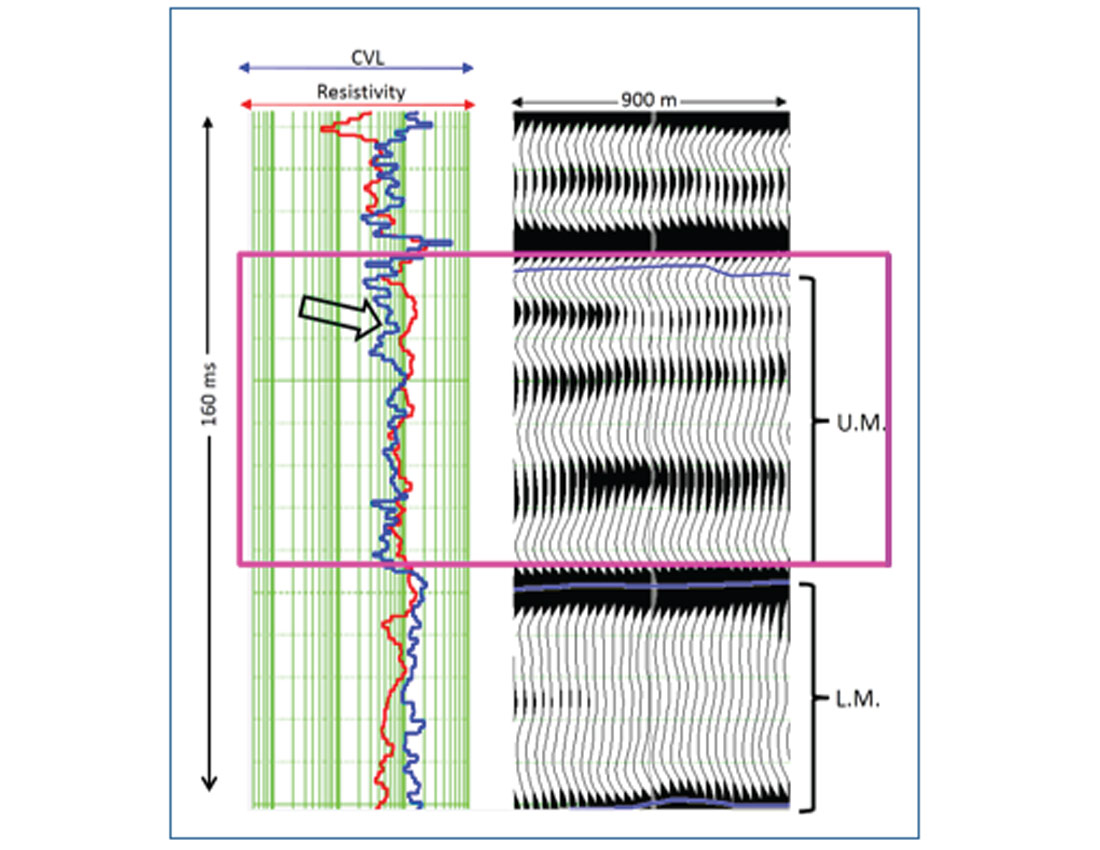
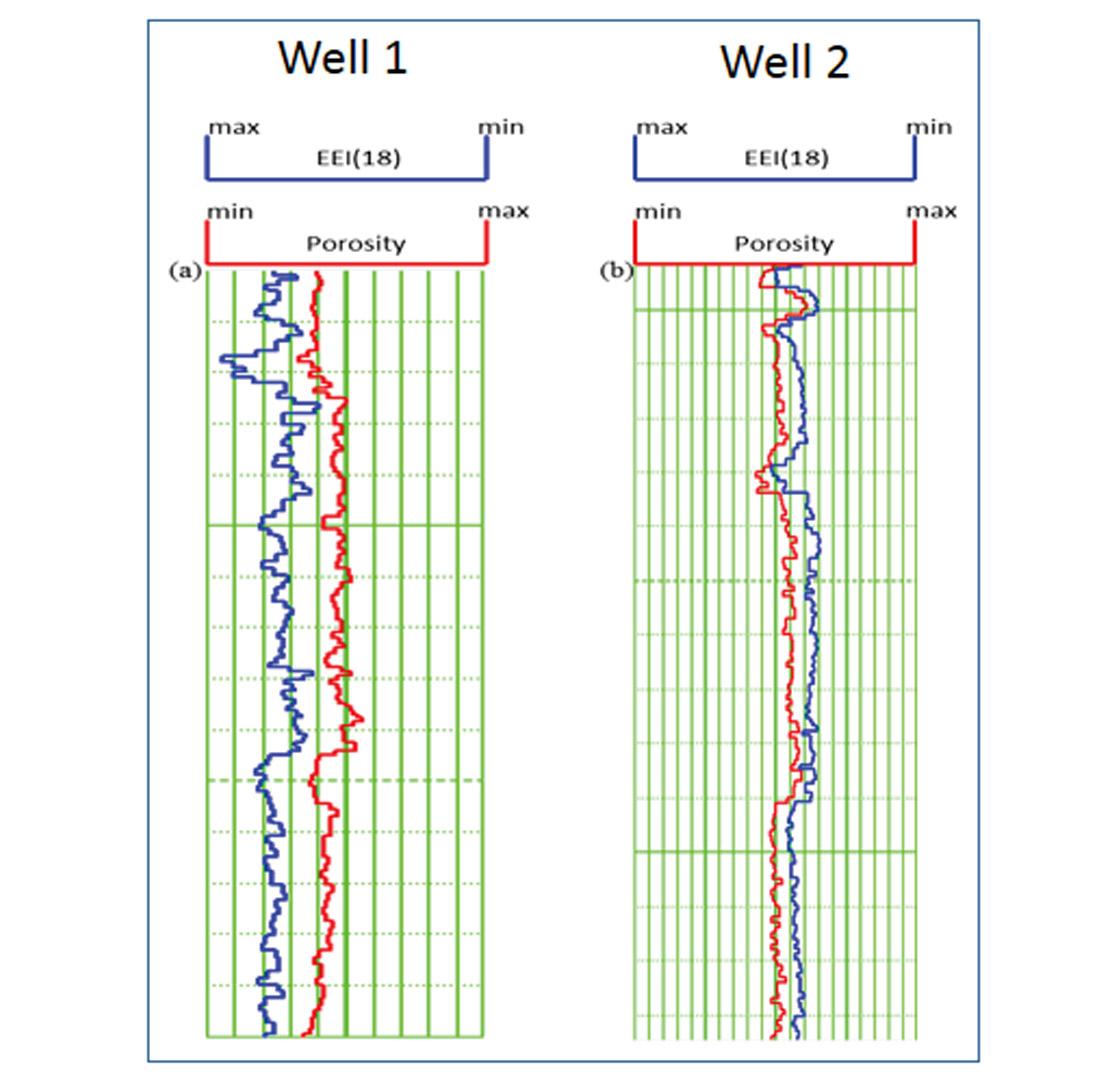
We begin with the Passey et al’s. (1990) method at the well location and overlay the resistivity and sonic curves covering the Montney formation to identify the source rock. Identifying the crossover between these curves in the Upper Montney (UM) zone as shown in Figure 1, we conclude that, that interval is the potential reservoir rock. With this known at the well location, we would like to map it laterally within this interval. There are different methods that can be adopted for accomplishing this goal, as illustrated in Figure 2. Extended elastic impedance approach is adopted for obtaining GR and porosity volumes from seismic data. As mentioned earlier, the first step is the correlation analysis between EEI logs and available petrophysical logs (porosity and gamma ray). Such a correlation of EEI log with porosity and GR for various angles is shown in Figure 3a and 3b respectively. Four wells data are included for this analysis. For porosity, though all the wells show a negative minima over a range of angles 2 to 18°, two wells (red and grey curves) show a maximum correlation of 92% at 18° angle. This angle is then used for computing EEI log that resembles the porosity curves at the well locations (Figure 4). Such a good correlation seen on the predicted porosity and the actual measured porosity curves lends confidence to the analysis being carried out. A similar observation was made for the GR curves.
The next step was to determine the brittleness information, as pockets with high brittleness fracture better and will serve as sweet spots for our characterization. Simultaneous inversion was adopted for obtaining this information, which yielded P-impedance, S-impedance as well as density. The computation of density was possible as far-offset range was available in the data. Using these attributes Young’s modulus and Poisson’s ratio were determined.
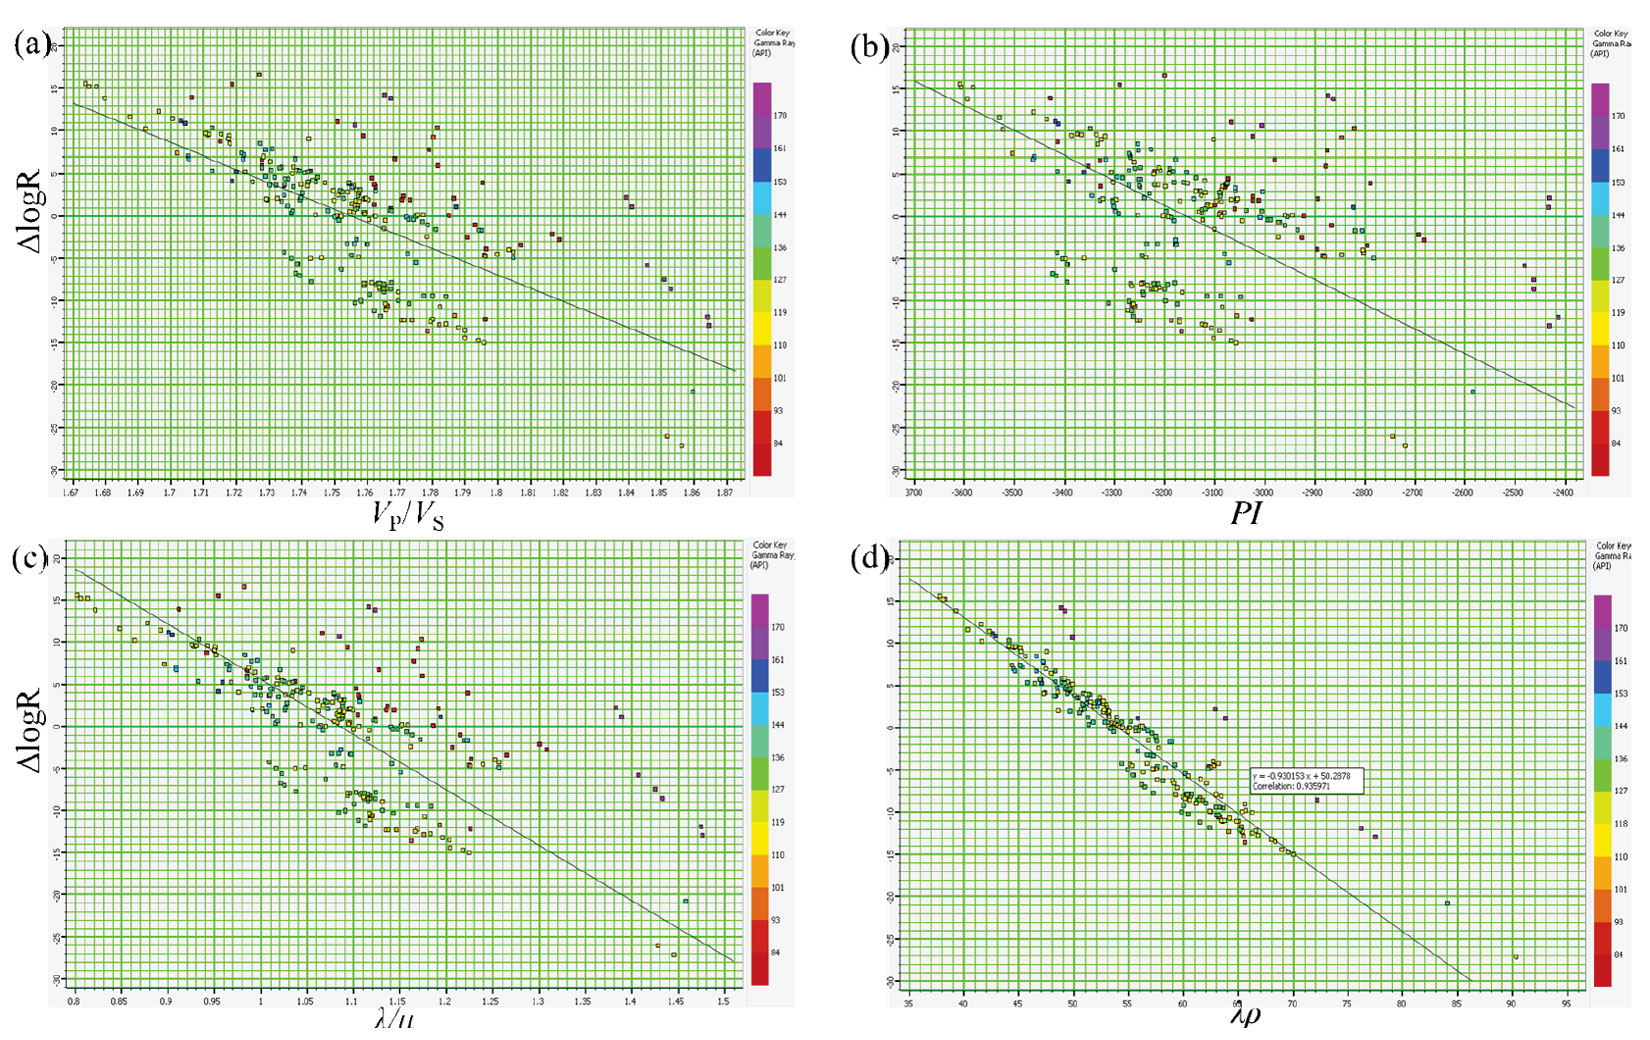
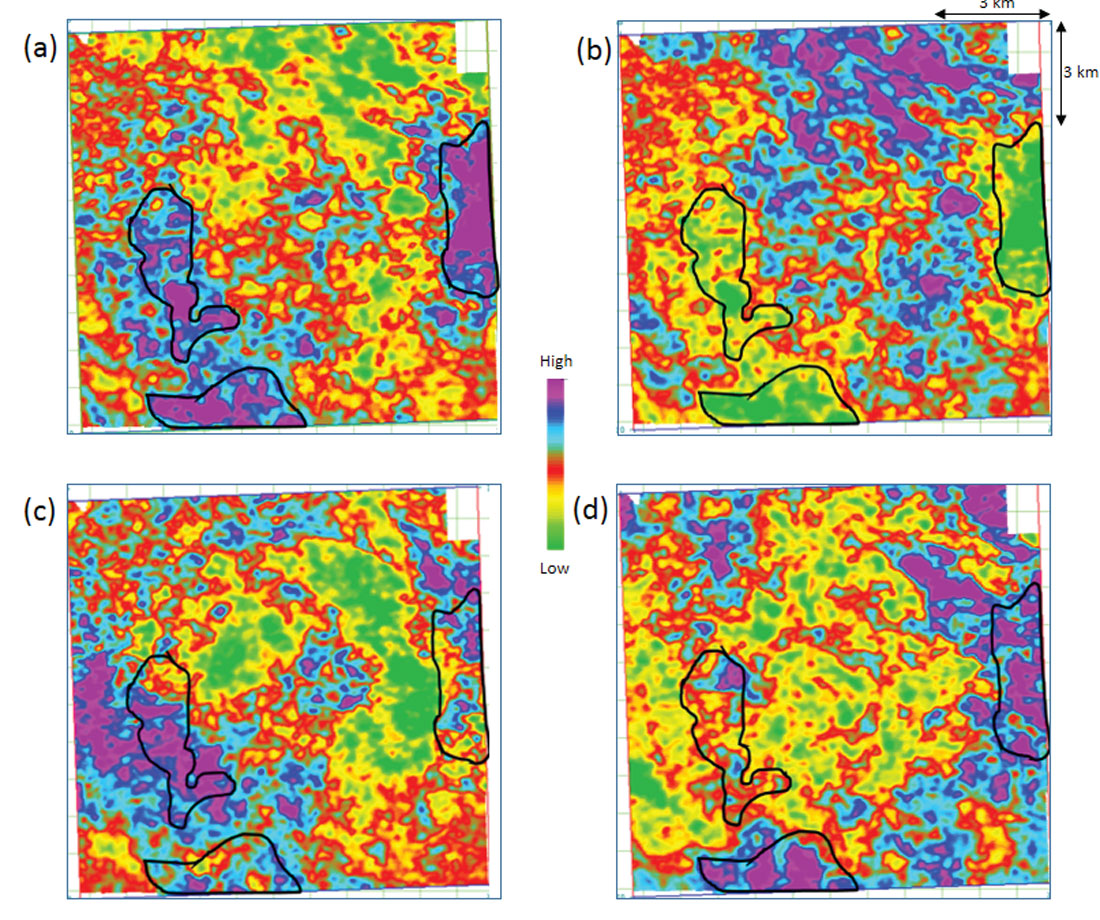
Finally, as stated above, we first compute ΔlogR curve from log data and crossplot this curve with other attributes that can be computed from seismic data. Examples of such attributes are (VP/VS) ratio, Poisson’s ratio, λ/μ, Poisson’s impedance, Poisson dampening factor, and some others. In Figure 5 we show four such crossplots. We notice that the cluster points are seen scattered on three of the four crossplots, the exception being the ΔlogR versus λρ attribute crossplot. This crossplot shows a good linear relationship between the two attributes with a correlation coefficient of 94%. We determine this relationship from the crossplot and later use it to transform the λρ derived from seismic data to ΔlogR volume, shown in Figure 6.
Conclusions
Considering the importance of resistivity, porosity, gamma ray and brittleness information for characterizing shale reservoir rocks, different techniques namely, extended elastic impedance, simultaneous inversion, and the proposed ΔlogR approach were followed to derive these properties for the Montney formation. At the well location, the Passey et al.’s (1990) method indicates that Upper Montney shows the characteristics of the reservoir rock as ΔlogR showed high values. Subsequently, using crossplotting between different attributes and ΔlogR, it was found that the λρ attribute showed the highest correlation (94%). The linear relationship between these two attributes was used to transform the λρ volume into a ΔlogR volume. Finally, sweet spots were identified adopting the criteria of low Poisson’s ratio, high ΔlogR, high porosity, and high Young’s modulus. The developed methodology has been followed through with applications to shale plays other than the Montney application cited here, and shows promise.


Join the Conversation
Interested in starting, or contributing to a conversation about an article or issue of the RECORDER? Join our CSEG LinkedIn Group.
Share This Article