Introduction
Imagine having a “seismic search engine”. Built into your seismic data viewer, it would rapidly locate features in your seismic data, like search engines help you locate information on the worldwide web.
It could work like this. You are looking at a large 3-D seismic survey for the first time. This survey covers a block adjacent to one on which your company has a well, Richoil #1, that produces from turbidites. You ask, Where are the turbidites? In a matter of minutes, the seismic search engine automatically identifies various turbidites in your data. Encouraged, you then ask, Which of these resembles the turbidites encountered in Richoil #1? Within seconds the turbidities are ranked by similarity to this reference. Investigating further, you automatically identify faults, channels, deep marine shales, and more.
This fanciful tale describes future reality; some such tool will become available within the next decade. Seismic pattern recognition has been developing quietly but steadily for twenty years, and the first practical applications are now appearing. But no matter how new and sophisticated the algorithm, seismic pattern recognition rests on an old and simple foundation: seismic attributes.
Seismic attributes
Seismic attributes describe seismic data. They quantify specific data characteristics, and so represent subsets of the total information. In effect, attribute computations decompose seismic data into constituent attributes. This decomposition is informal in that there are no rules governing how attributes are computed or even what they can be. Indeed, any quantity calculated from seismic data can be considered an attribute. Consequently, attributes are of many types: prestack, inversion, velocity, horizon, multi-component, 4-D, and, the most common kind and subject of this review, attributes derived from conventional stacked data (Table 1).
| Method | Representative Attributes |
|---|---|
| Table 1. Methods for computing poststack seismic attributes, with representative attributes. Many attributes, such as dip and azimuth can be computed many ways. | |
| complex trace | amplitude, phase, frequency, polarity, response phase, response frequency, dip, azimuth, spacing, parallelism |
| time-frequency | dip, azimuth, average frequency, attenuation, spectral decomposition |
| correlation/covariance | discontinuity, dip, azimuth, amplitude gradient |
| interval | average amplitude, average frequency, variance, maximum, number of peaks, % above threshold, energy halftime, arc length, spectral components, waveform |
| horizon | dip, azimuth, curvature |
| miscellaneous | zero-crossing frequency, dominant frequencies, rms amplitude, principal components, signal complexity |
Hundreds of seismic attributes have been invented, computed by a wide variety of methods, including complex trace analysis, interval statistics, correlation measures, Fourier analysis, time-frequency analysis, wavelet transforms, principal components, and various empirical methods. Regardless of the method, attributes are used like filters to reveal trends or patterns, or combined to predict a seismic facies or a property such as porosity. While qualitative interpretation of individual attributes has dominated attribute analysis to date, the future belongs to quantitative multi-attribute analysis for geologic prediction.
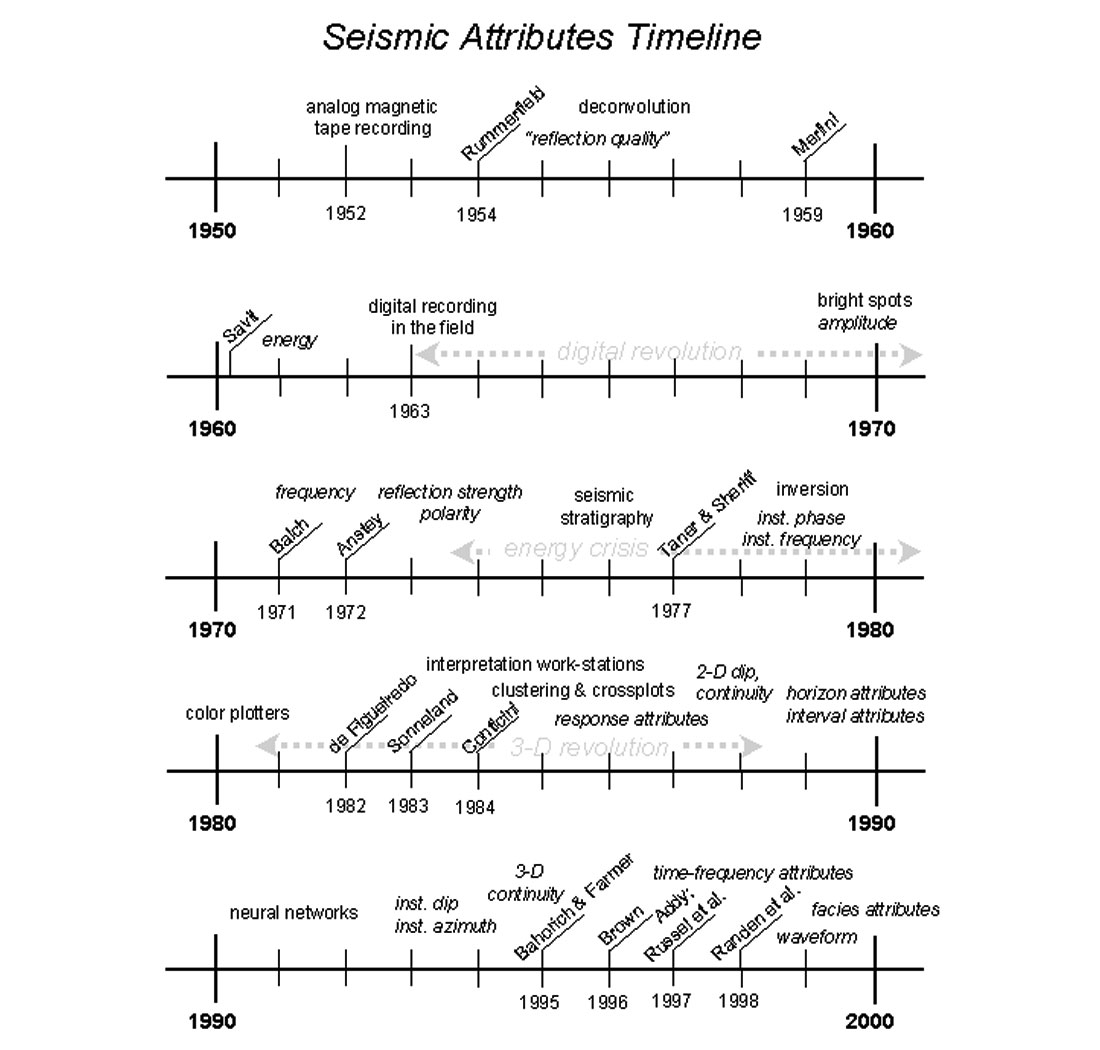
Seismic attribute analysis is in transition. Though marked, this transition is but a step in a long evolution (Figure 1).
History
From the first practical seismic reflection experiments in 1921 until the early 1960s, seismic reflection data interpretation was largely a matter of mapping event times and converting these to depth to determine subsurface geologic structure. Paper records and analog magnetic tape recording lacked sufficient resolution to go much beyond this. Structural interpretation ruled and stratigraphic interpretation languished.
A few intrepid visionaries recognized that seismic reflection character contained valuable clues to stratigraphy. Foremost amongst them was Ben Rummerfield. In 1954 he published his famous paper on mapping “reflection quality” to reveal subtle stratigraphic changes (Rummerfield, 1954). Lindseth (1982, p. 9.2) considers this a forerunner of the bright spot concept, but it is as much a forerunner of seismic attribute analysis in general. Rummerfield was remarkably prescient, for he foresaw that with improvements in seismology one could deduce fluid content, porosity, and facies changes from reflection character. Other visionaries, such as Eduardo Merlini, Carl Savit, and Otto Koefoed, explored the tantalizing possibilities of recording seismic energy and true amplitudes. But these exceptions only prove the rule; overall geophysicists paid little attention to seismic amplitude or character.
This changed dramatically in 1963 with the introduction of digital recording of exploration seismic data in the field (Dobrin, 1976, p. 68). Its acceptance was so rapid that by 1968 fully half of all new seismic recording was digital, and by 1975 nearly all was digital (Sheriff and Geldart, 1989, p. 21, 26, 170). Digital recording so greatly improved the dynamic range of seismic data that it became feasible to routinely investigate amplitude variations. This led straight to the discovery of the first direct hydrocarbon indicators, bright spots.
Much of the early research on bright spots was published in the Soviet Union in the late 1960s, but this was little known in the West and consequently had negligible influence. Instead, the ideas were developed independently in secrecy amongst oil companies and seismic contractors exploring in the Gulf of Mexico in the late 1960s and early 1970s. By 1971 the technique was widespread throughout the industry and by 1972 it was out in the open (Dobrin 1976, p. 339; Sheriff and Geldart, 1989, p. 21). Even then, little about bright spots was ever published because the technology remained confidential and jealously guarded.
The stunning success of bright spot prospecting quickly established it as a key tool of exploration geophysics. Its chief contribution, however, lay in convincing geophysicists to look at variations in reflection character and stratigraphy as well as reflection times and geologic structure. In this way, bright spots laid the cornerstone for attribute analysis.
Thus the first seismic attribute was reflection amplitude.1 In numerous guises, it remains the most important attribute today.
With expectations inflated by the easy success of bright spots, researchers sought other direct hydrocarbon indicators. Their search led immediately to frequency. They were encouraged by the idea that anomalous attenuation in a seismic signal that passed through a gas reservoir can be detected as a shift to lower frequencies. This effect is the celebrated “low frequency shadow.” The fondest hope was that shadows could permit attenuation to be quantified, from which the rock property Q could be inferred (Dobrin, 1976, p. 289).
Oil company researchers in the late 1950s and 1960s sought these frequency changes and a corresponding means to display them in color. A.H. Balch was the first to publish results (Balch, 1971). He developed color “sonograms” using a simple filter-bank to quantify the time-variant average frequency of stacked seismic data. His interest lay in detecting frequency changes rather than in interpreting their origin, but to keep oil-finders hopeful he suggested that his technique might detect attenuation due to gas-filled reefs. Balch’s paper is chiefly remembered as the first published in Geophysics to display seismic data in color.
Balch’s work was closely followed by Nigel Anstey’s innovative study of seismic attributes, published in two internal reports for Seiscom Delta and presented at the 1973 SEG annual meeting (Anstey, 1972, 1973a, 1973b). His chief attribute was an amplitude measure he called reflection strength, which he developed for bright spot analysis (Figure 2). He deliberately chose a descriptive yet technically vague name to emphasize meaning over mathematics.
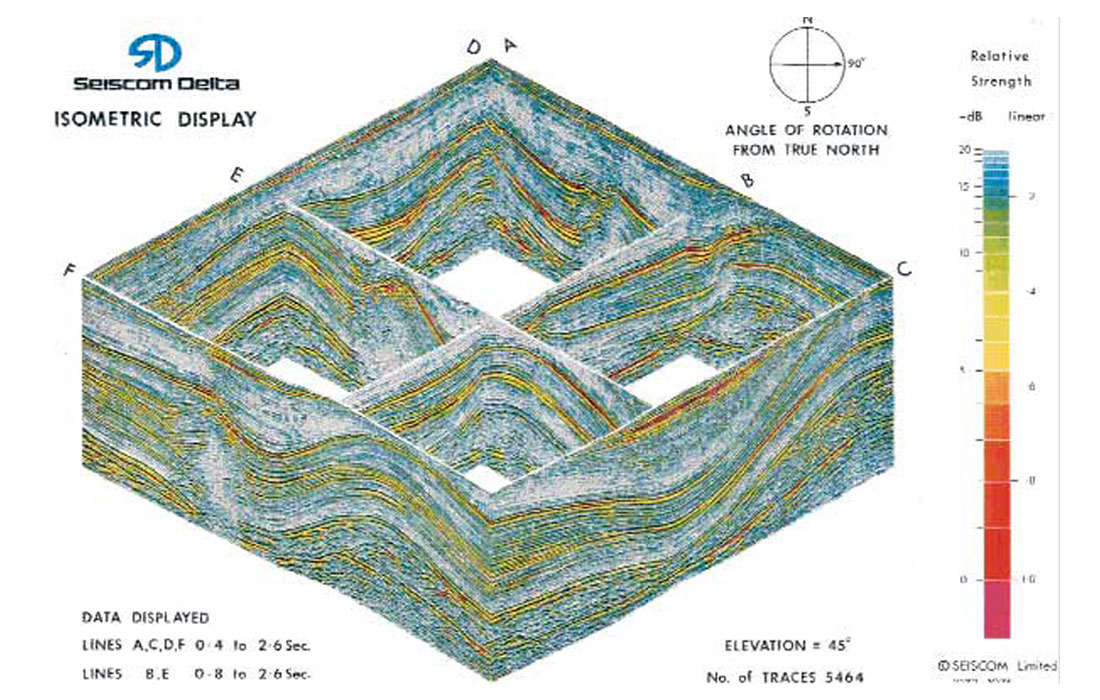
Reflection strength cast seismic amplitude in a form free of the distorting influences of reflection polarity and wavelet phase, permitting fairer comparisons. Anstey also invented apparent polarity and differential frequency, and showed interval velocity, frequency, cross-dip2, and stack-coherence attributes. His color technique was costly but greatly improved upon Balch’s. His method for displaying seismic attributes has been employed ever since: simultaneously plot the attribute in color and the original seismic data in black variable area. He considers this his most valuable contribution to attribute analysis as it allowed the stratigraphic information of the attribute to be directly related to the structural information of the seismic data.
Anstey’s reports remain surprisingly fresh and insightful. Unfortunately they also remain inaccessible, as only a handful of copies were made due to the great expense of the early color plots. It was his colleagues, Turhan Taner, Robert Sheriff, and Fulton Koehler, who, inheriting his work upon his departure from Seiscom Delta 1975, popularized his ideas. In place of his various empirical methods, they introduced a single mathematical framework for attribute computation, complex seismic trace analysis.
Complex seismic trace analysis debuted at the 1976 SEG annual meeting and was subsequently published in the two seminal papers that launched seismic attributes into prominence, Taner and Sheriff (1977), and Taner et al. (1979). The timing was especially propitious. Against the background of the gathering boom in exploration driven by the energy crisis of the 1970s, complex seismic trace analysis appeared alongside seismic stratigraphy, one of the great advances in reflection seismology. The first practical color plotters followed soon after, and suddenly color attribute plots became affordable. This combination of money, science, and color proved irresistible: complex trace attributes were enthusiastically received and quickly became established as aids to seismic interpretation.
Taner and Sheriff introduced five attributes: instantaneous amplitude, instantaneous phase, instantaneous polarity, instantaneous frequency, and weighted average frequency. Instantaneous amplitude is patterned after Anstey’s reflection strength and so adopted its name. Instantaneous polarity likewise followed Anstey’s design. For these two attributes, mathematics follows meaning.
In contrast, instantaneous phase and frequency were new attributes that fell out of the mathematics of the complex trace. Their geologic meanings had to be inferred empirically. These two attributes have proven very useful, but they established the unhappy precedent of subordinating meaning to mathematics.
It was no accident that complex seismic trace analysis first appeared with seismic stratigraphy. Peter Vail and his colleagues at Exxon, who developed seismic stratigraphy, learned of the new attributes and were enthralled by the possibilities they offered. They expected that additional attributes would soon quantify their seismic facies parameters. And so it was that these two methods were published together in the famous AAPG Memoir 26 in 1977. Seismic stratigraphy greatly boosted seismic attributes, providing them a scientific framework for combining attributes to predict geology, as well as endowing them with a gloss of scientific respectability.
New attributes proliferated in the 1980s: zero-crossing frequency, perigram, cosine of the phase, dominant frequencies, average amplitude, homogeneity - and many others. Most of the new attributes lacked clear geologic significance. This was not necessarily a problem. To the extent that attributes reveal meaningful patterns in the seismic data, they have value. But determining whether patterns are truly meaningful is often problematic.
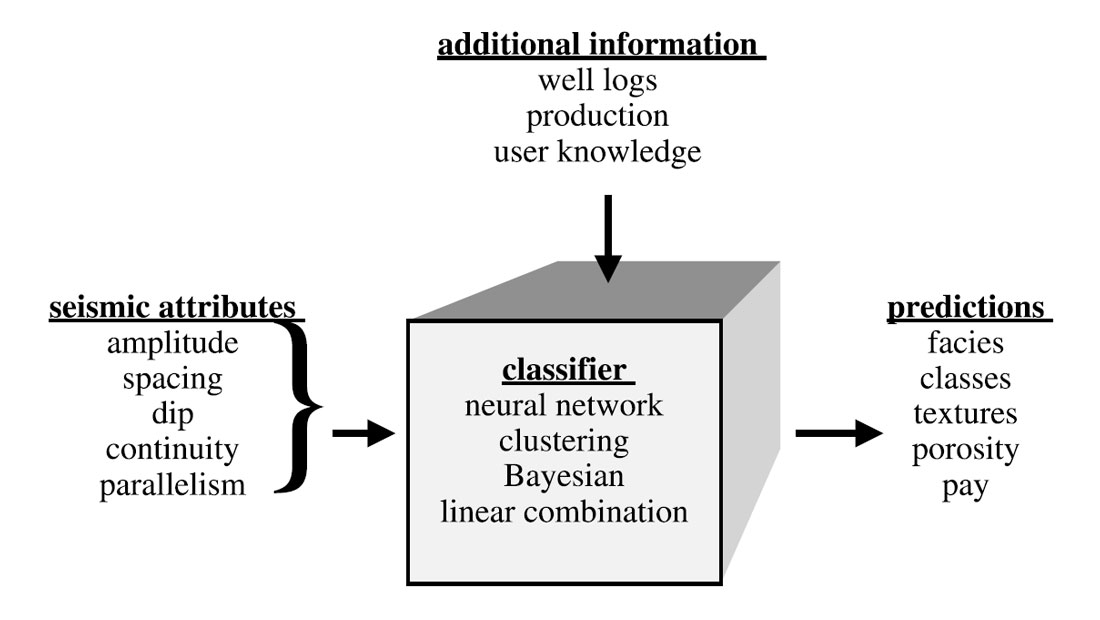
This prompted efforts to make more sense of seismic attributes. Several studies related complex trace seismic attributes to Fourier spectral averages, which yielded clues to wavelet properties and led to “response attributes” (e.g., Robertson and Nogami, 1984; Bodine, 1986). Work also began on seismic pattern recognition, or “multi-attribute analysis” (e.g., de Figueiredo 1982; Sonneland, 1983; Conticini 1984; Justice et al. 1985; see Figure 3). While the driving force was to automatically determine seismic facies, there also arose the curious idea that attributes might somehow make sense in combination even if they didn’t make any sense individually.
These efforts failed to provide the geologic insights that seismic interpreters so keenly sought, nor could they prevent the inevitable disillusionment bred of expectations set too high. Doubts grew and enthusiasm waned; by the mid-1980s, seismic attributes had lost their gloss of scientific respectability. Excerpts from the literature record this fall from grace. Roy Lindseth (1982, p. 9.15) observed, “... except for amplitude, they have never become very popular, nor are they used extensively in interpretation. The reason for this seems to lie in the fact that most of them cannot be tied directly to geology ...” Regarding complex trace attributes, Hatton et al. (1986, p. 25) opined, “... this concept is a little difficult to grasp intuitively ... While these functions do provide alternative and sometimes valuable clues in the interpretation of seismic data, cf. Taner et al. (1979), it is probably fair to say that their usage has not been as widespread as it might have been due to their somewhat esoteric nature.” Yilmaz (1987, p. 484) cautiously wrote, “The instantaneous frequency may have a high degree of variation, which may be related to stratigraphy. However, it also may be difficult to interpret all this variation.” Robertson and Fisher (1988) added, “The mix of meaningful and meaningless values is probably the major factor that has frustrated interpreters looking for physical significance in the actual numbers on attribute sections.”
If the experts didn’t know what to make of seismic attributes, is it any wonder that the rest of us were confused?
Even as attributes fell into neglect, work continued on new techniques that would restore them to favor. Chief amongst these was 3-D discontinuity.
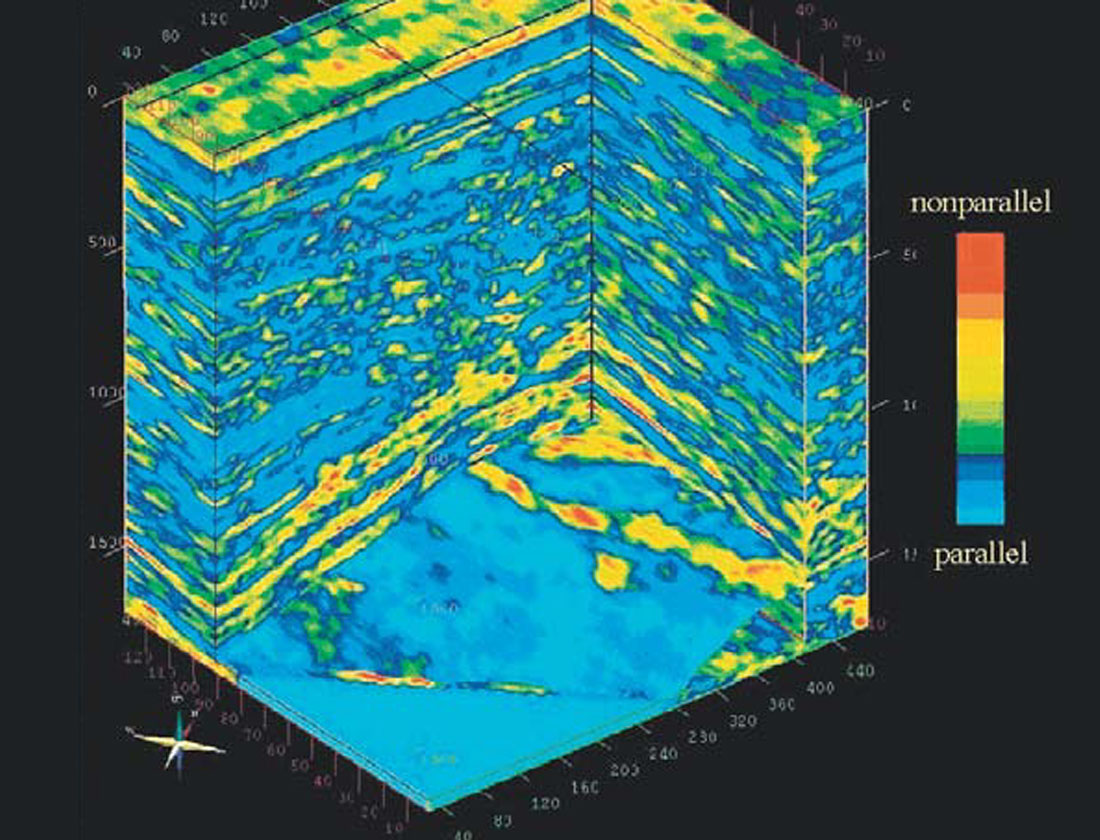
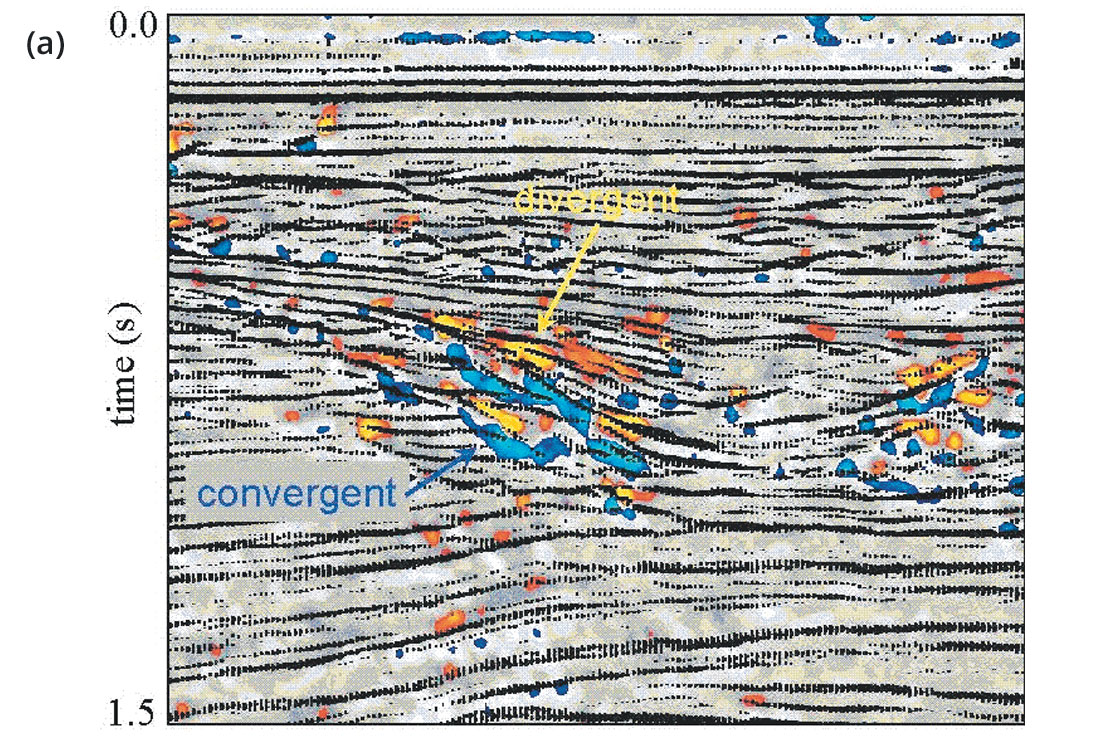
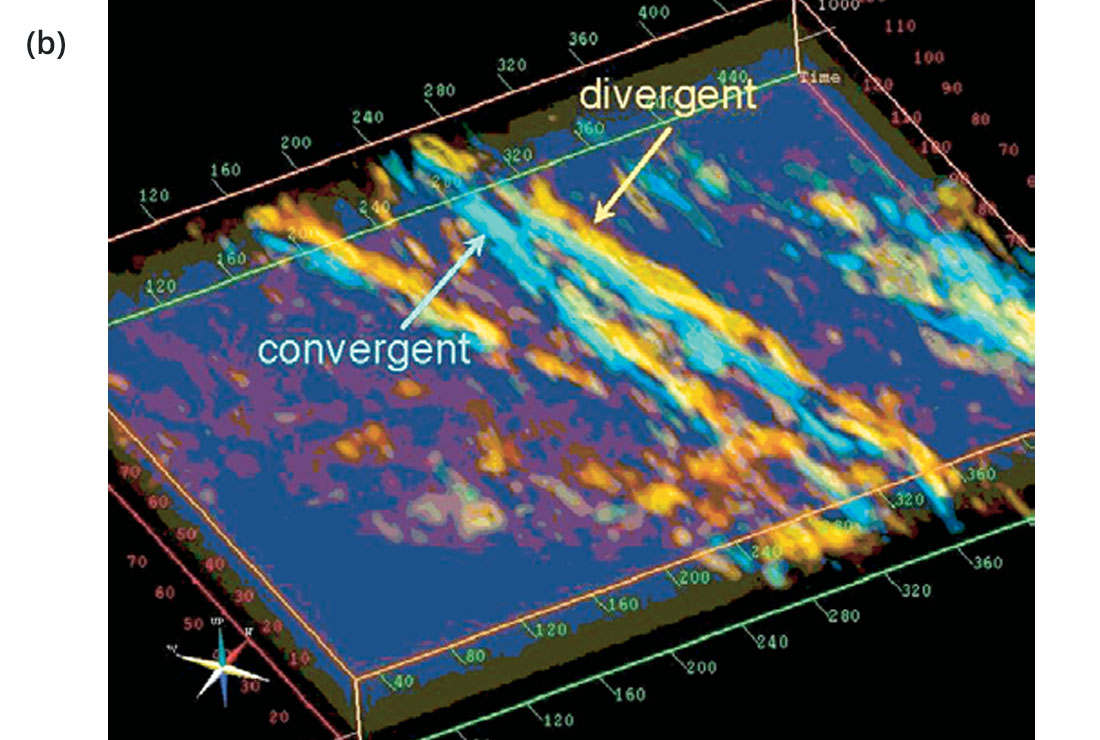
A number of two-dimensional continuity and dip attributes appeared in the 1980s (e.g., Conticini, 1984; Scheuer and Oldenburg, 1988; Vossler, 1989). These met with an indifferent reception. But when in the mid-1990s they were three-dimensionalized and continuity was recast as discontinuity, they took the exploration world by storm (e.g., Bahorich and Farmer, 1995). The excitement was reminiscent of that of bright spots, for, like amplitude, discontinuity had clear meaning and enabled interpreters to see something they couldn’t easily see before. This success breathed new life into attribute analysis. Other multi-dimensional attributes soon followed, such as parallelism and divergence (e.g., Oliveros and Radovich, 1997; Randen et al., 1998; Randen et al., 2000; Marfurt and Kirlin, 2000; Figures 4 and 5).
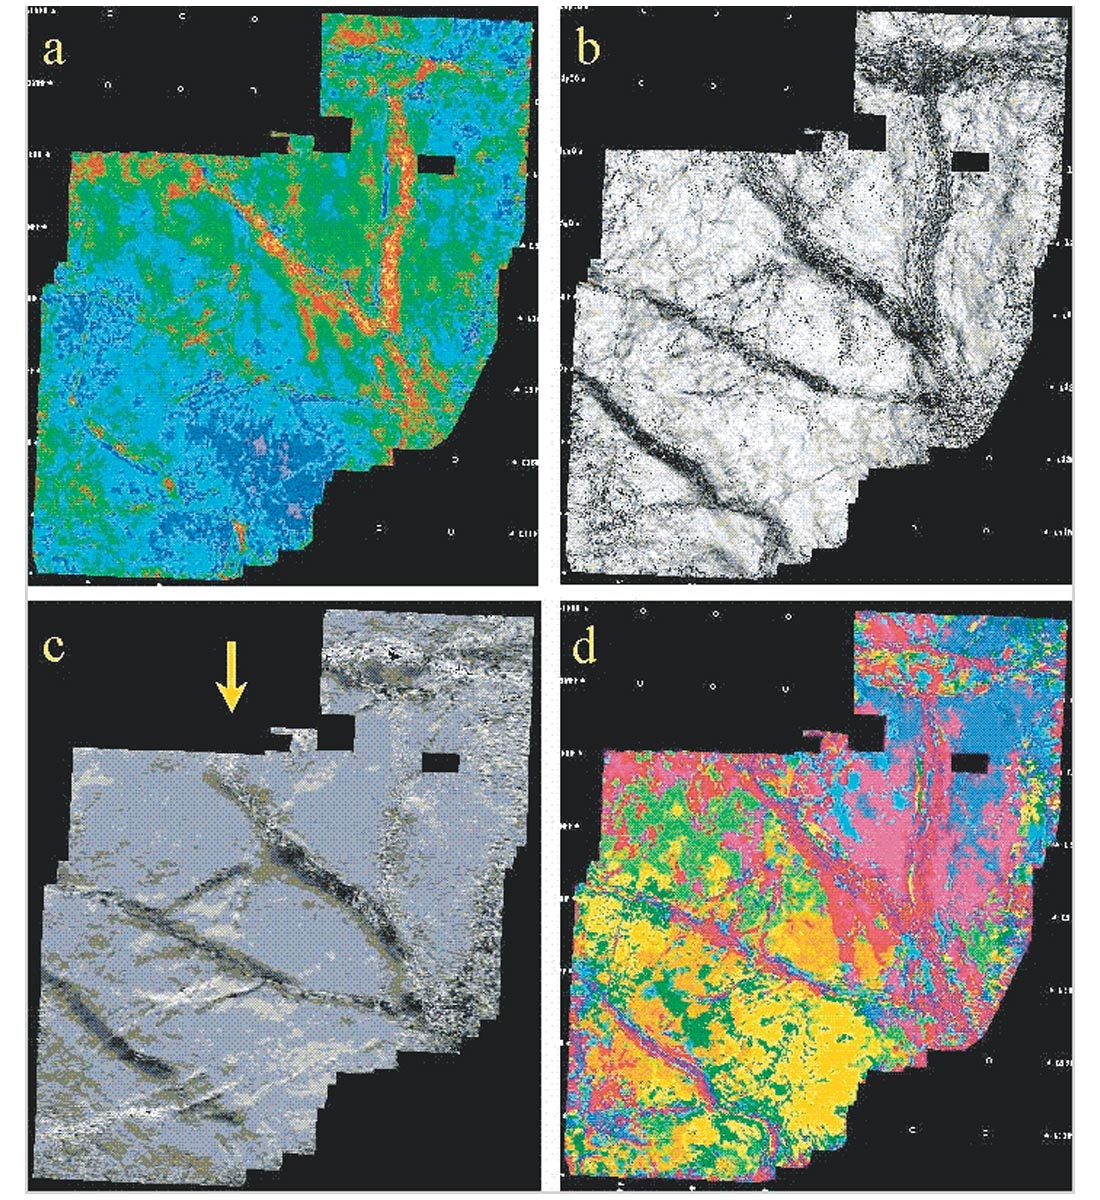
The late 1980s and early 1990s also saw the introduction of horizon attributes (Dalley et al., 1989), interval attributes (Sonneland et al., 1989; Bahorich and Bridges, 1992), and attributes extracted along a horizon from a volume (Figure 6). Presented as maps and offering superior resolution and computational efficiency, these were quickly and widely adopted and have become the most important format for presenting attributes. Interval attributes are usually computed as a statistic in an interval about an interpreted horizon. Seismic waveform mapping is a notable exception, as it based on unsupervised classification. This popular new attribute tracks facies changes (Addy, 1997; Figure 6d).
Multi-attribute analysis progressed slowly but surely through the late 1980s and 1990s. Attribute cross-plotting was added to visually relate two or three attributes (e.g., White, 1991). Clustering algorithms were employed to classify sets of attributes as maps or volumes. Since the mid-1990s, neural networks have largely supplanted clustering (e.g., Russell et al., 1997; Addy, 1997; De Groot and Bril, 1999; Walls et al., 1999). The newer supervised classification algorithms automatically integrate seismic and non-seismic information in their solutions, increasing their prediction power.
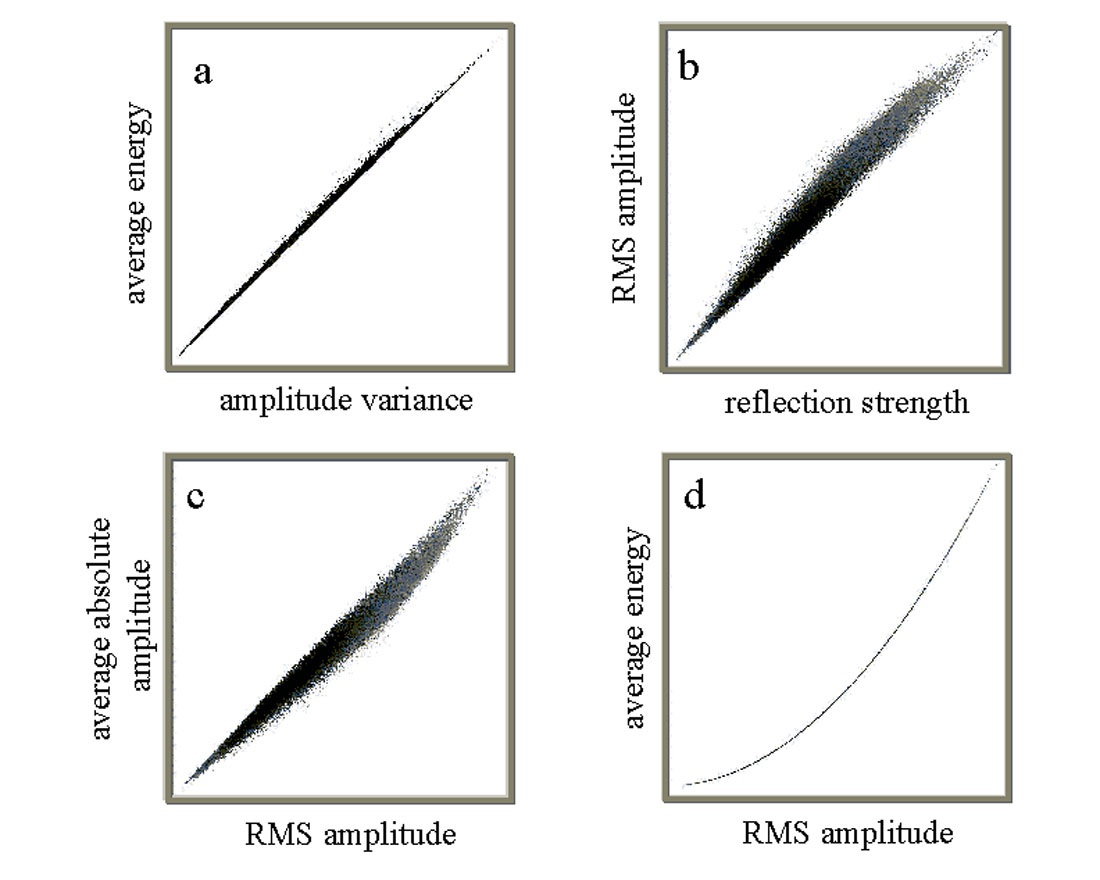
Throughout this time, attributes continued to multiply in chaotic profusion. Brave workers endeavored to bring order to the chaos by classifying attributes according to function (e.g., Brown, 1996; Chen and Sidney, 1997). But could it be that these noble efforts are most valuable precisely because many attributes are not? The geologic meanings of some attributes are so obscure we can only guess at them.3 Other attributes duplicate each other; amplitude attributes are especially redundant (Figure 7). We do not need all the seismic attributes.
Do we need any?
Future
You may not need seismic attributes today, but you will need them in the future.
The future will see more multidimensional attributes with geologic significance and a greater reliance on multi-attribute analysis. These trends are leading to automatic pattern recognition techniques for seismic facies analysis, able to rapidly characterize large volumes of data, or retrieve subtle details hidden in the data. In short, the future will see seismic search engines.
So how would our seismic search engine work? The idea is simplicity itself (the devil is truly in the details). A template stores the characteristics that describe the reference turbidite of Richoil #1 as imaged in our seismic data. These characteristics are defined by specific attribute values. These attributes are hidden behind the characteristics: our template describes our reference turbidite as moderately nonparallel and quantifies it as 63%, but we don’t care how parallelism is computed as long as it is satisfactory. The template is stored in a template database. Collectively, the templates describe many geologic features, including a number of turbidites. The search engine retrieves our turbidite template from the database and scans the data for patterns that resemble it.
Parts of this are already available (e.g., De Groot and Bril, 1999). To progress further, we need better attributes to describe reflection patterns with stratigraphic significance, we need better attributes for describing boundaries (faults, sequences, etc.), we need to integrate these with well logs, production reports, and other information, and we need to build databases of observed seismic patterns for use with advanced pattern recognition algorithms.
Automated seismic data characterization - based on seismic attributes - will rewrite the rules of seismic data interpretation. Geophysical prophets foresaw the wondrous possibilities. In 1983 Lars Sonneland could write (Sonneland, 1983), “Finally, automated interpretation techniques might release the interpreter from tedious parts of the interpretation and thereby contribute to faster turnaround.” Going back even farther to 1973, Nigel Anstey boldly wrote (Anstey, 1973a), “We are saying, then, that we are entering a new age of seismic prospecting - one that yields a new insight into the geology, one that makes the seismic method far more quantitative, and one which requires a whole new arsenal of seismic interpretation skills”.
You will have seismic attributes in your facies - and you will like it.
1 Reflection time was really the first seismic attribute.
2 This is arguably the first 3-D attribute.
3 If you can’t tell what an attribute means from its name, then you probably don’t need it.

Acknowledgements
I thank Nigel Anstey for graciously presenting me photocopies of his impossible-to-find classic studies, Seiscom ‘72 & Seiscom ‘73, and for his insightful recollections of the early history of seismic attributes. I thank Grant Geophysical for permission to reproduce the reflection strength figure from Anstey’s 1972 report. I also thank Landmark Graphics Corporation for permission to present the other displays of seismic attributes.


Join the Conversation
Interested in starting, or contributing to a conversation about an article or issue of the RECORDER? Join our CSEG LinkedIn Group.
Share This Article