Introduction
Buried channels are former valleys that were filled in as a result of recent glaciation. Such features contain high porosity sands and gravels often saturated with water or even natural gas, both of which are important resources. With regards to gas production, although the reservoirs found to date are quite shallow (50-100 m), these deposits have produced as much as 4-5 Bcf gas per well in as little as 4-5 years. Obviously the capital costs associated with producing such near surface deposits are small, and as a result they have attracted a good deal of attention (e.g. Pawlowicz, 2005) with much exploration for this resource carried out using DC electrical resistivity tomography (Bauman, 2005). It must also be noted that such shallow and overpressured gas deposits are a drilling hazard. As recently as this last winter, two drilling rigs were destroyed by shallow blowout and fire in; 1) Northern Alberta (Safety Bulletin, 2005); and 2) Northeastern British Columbia.
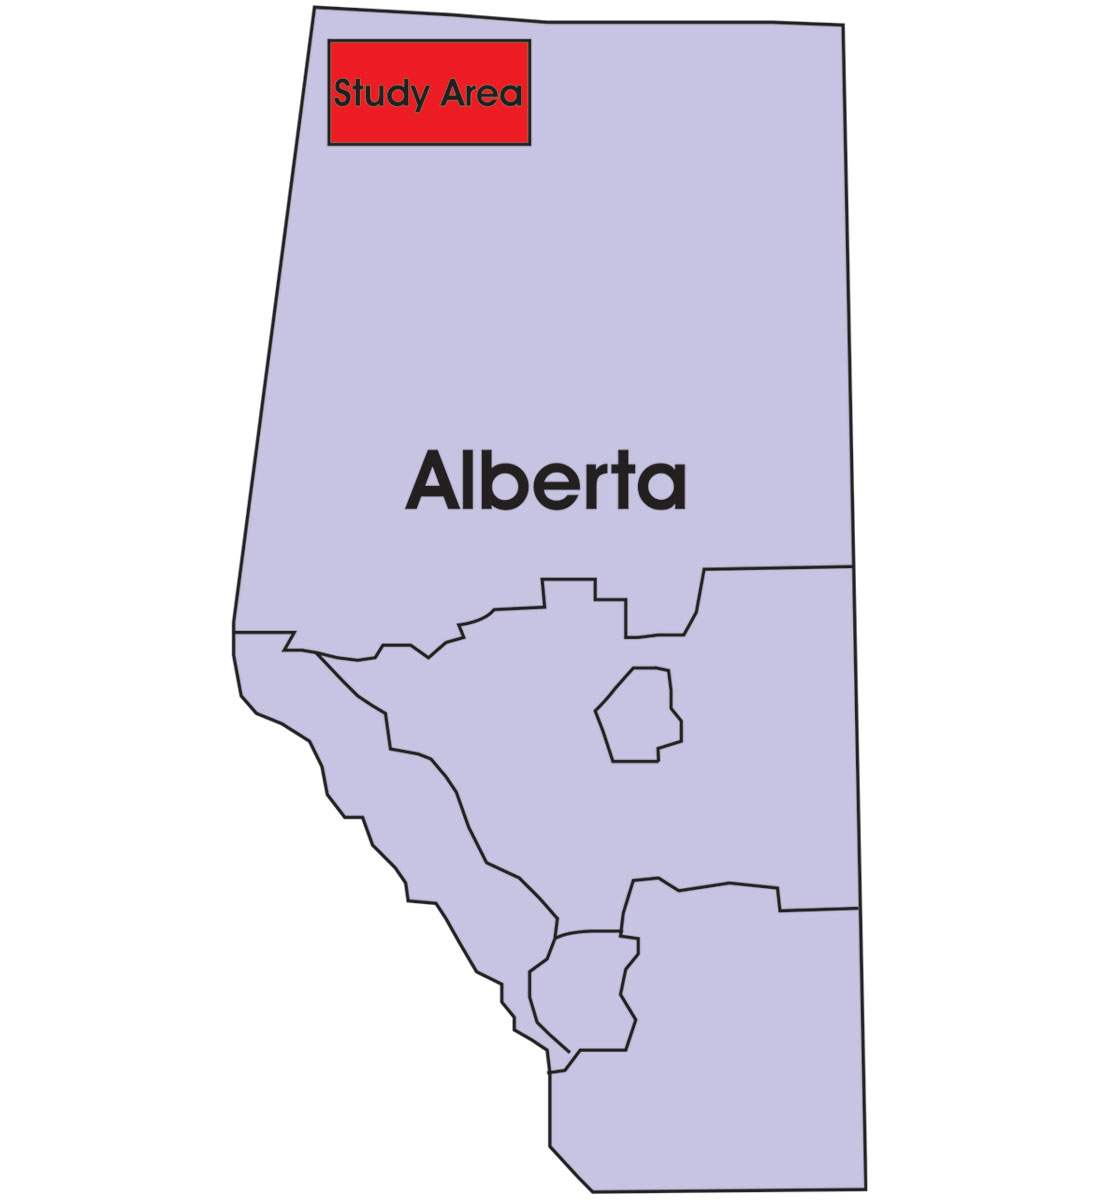
To better understand the buried channels, the University of Alberta (U of A) in conjunction with Geological Survey of Canada (GSC) and the Alberta Geological Survey (AGS) initiated a project to acquire high resolution seismic data close to existing shallow Quaternary gas wells between Rainbow Lake and High Level, Northern Alberta (Figure 1). The objectives of the seismic survey were to: 1) to image the surface of the Sub-Cretaceous unconformity upon which a maximum of about 300 meter of Tertiary and Quaternary sediments are deposited; 2) to image shallow Quaternary or Tertiary channels resting on and above unconformity; and 3) to create a public geoscience information database. An electrical resistivity tomography (ERT) profile was also recorded along the same line in order to delineate Quaternary Channels and find highly resistive anomalies which can be used to detect gas and fresh water saturated zones.
Our initial results have recently been presented (Ahmad et al., 2005a, 2005b) and more detailed reports and a M.Sc. thesis on the geology and geophysical results on this work a re forthcoming. In this brief contribution, we focus only on some of the unique aspects of the seismic and electrical data acquisition and show portions of the results.
Acquisition
The field area was selected on the basis of analysis of existing well logs that suggested the existence of a deep channel. The availability of proximate ERT soundings and earlier seismic cut lines were also taken into consideration when designing the program. The goal of the survey was to image the structure above the pre- Cretaceous unconformity that lies at depths of approximately 300 m and as such, a non-standard acquisition program employing both high spatial group spacing and high frequencies was employed.
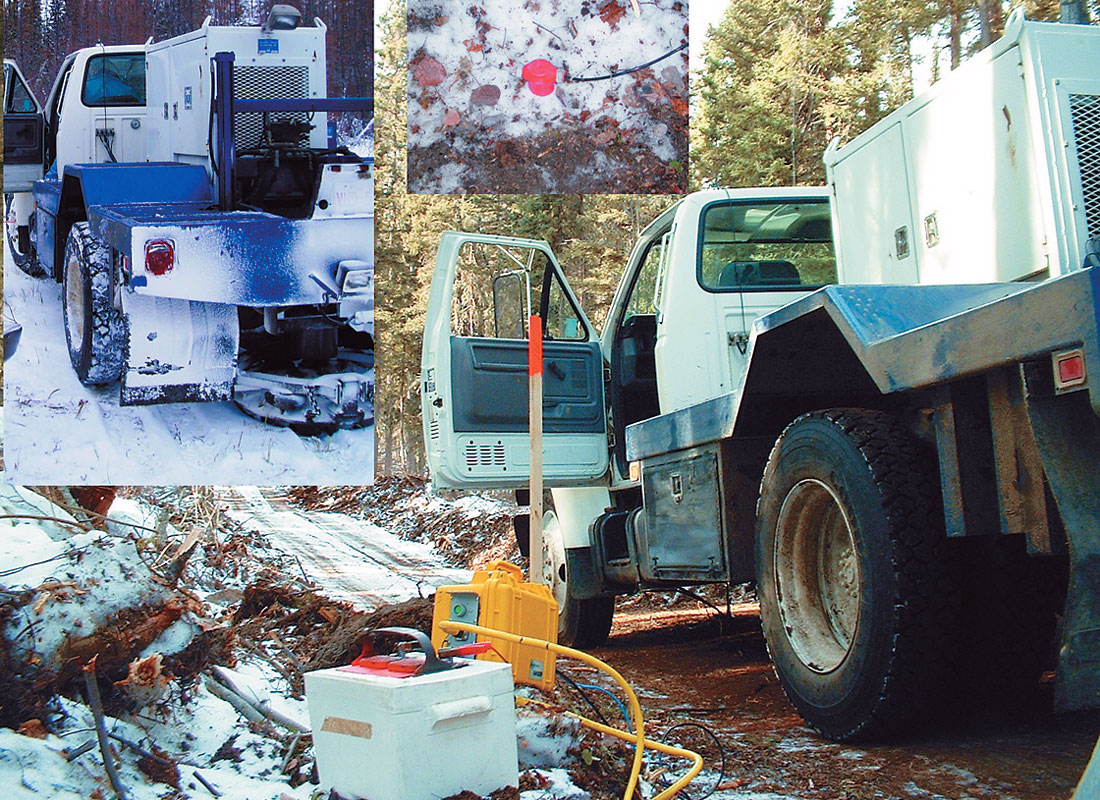
Ground roll is always a problem with land seismic acquisition but can be severely so for near surface imaging because the weak reflections are overwhelmed by the surface waves. Often, much of the energy of the ground roll is contained at lower frequencies; for this reason (and also because of the potential for additional off-line ground-roll produced by highway traffic) high frequency (40-Hz) geophones were selected. The use of such high frequency receivers has the disadvantage of reducing the overall bandwidth and hence also the resolution, but based on our field experiences in such areas, the loss of bandwidth is more than compensated by the boost in the relative strength of the near surface reflections. The ground roll was further reduced by using a vibrator sweep of 20 to 250 Hz (Table 1). The U of A high frequency minivibe unit was employed in this survey (Figure 2).
High spatial resolution was maintained by using geophone singles at a 4-m station spacing. Shot spacing of 24-m (6 stations) was a compromise between the maximum number of shots (up to 150) that could be carried out in during daylight hours and the desire to maximize mid-point fold. An average fold of 40 was obtained for the survey.
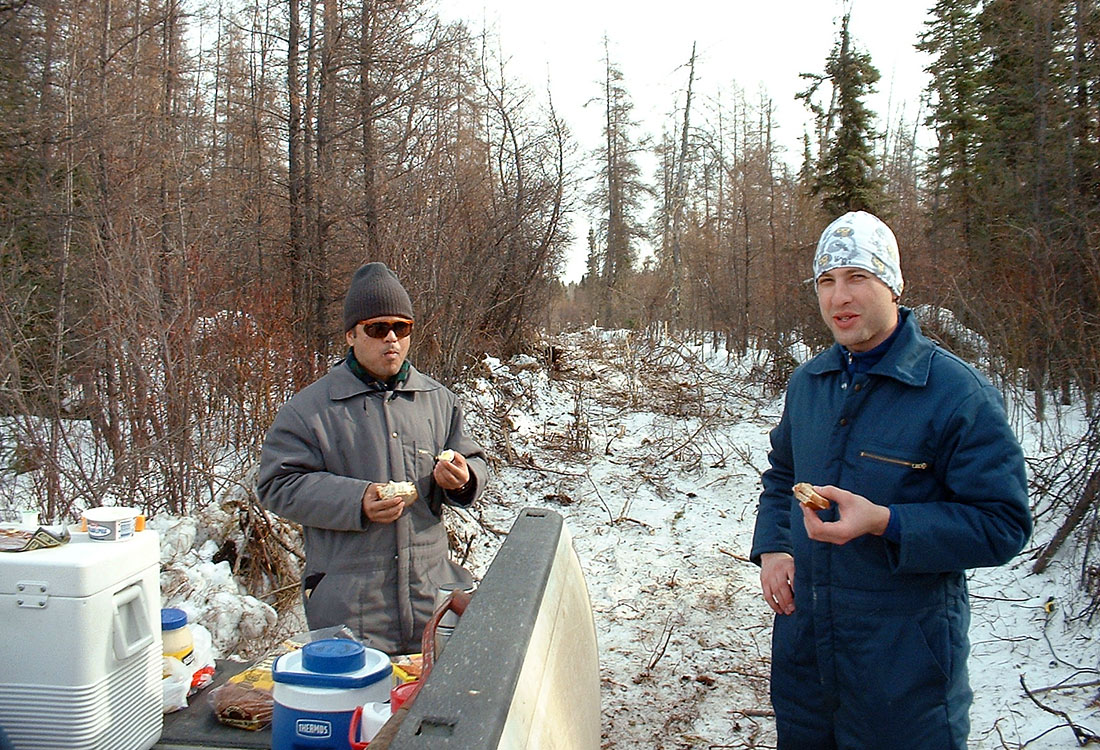
The seismic survey was acquired in late March, 2004. Conditions for acquisition at this time were ideal for the vibrator system. Near perfect coupling, as determined by monitoring of the force versus time during the sweep, on the snow covered frozen ground was obtained for almost all the shot points. The field crew worked hard but had a good time during the 10 day shoot (Figure 3).
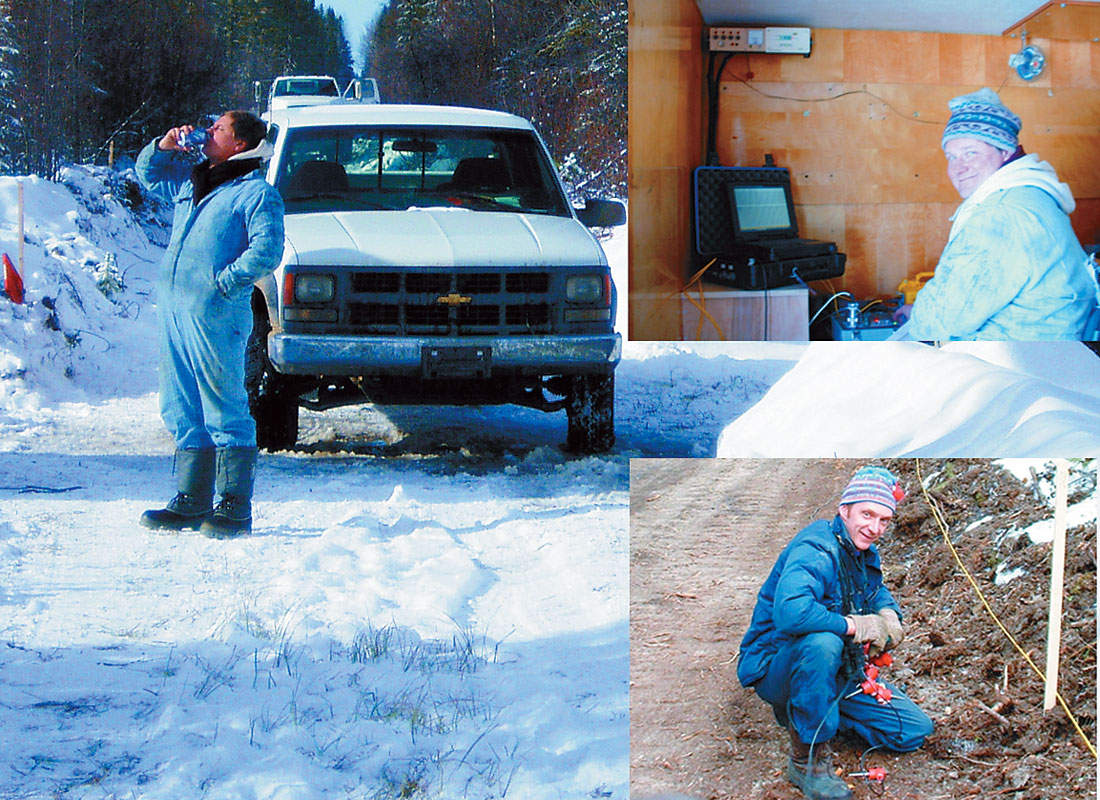
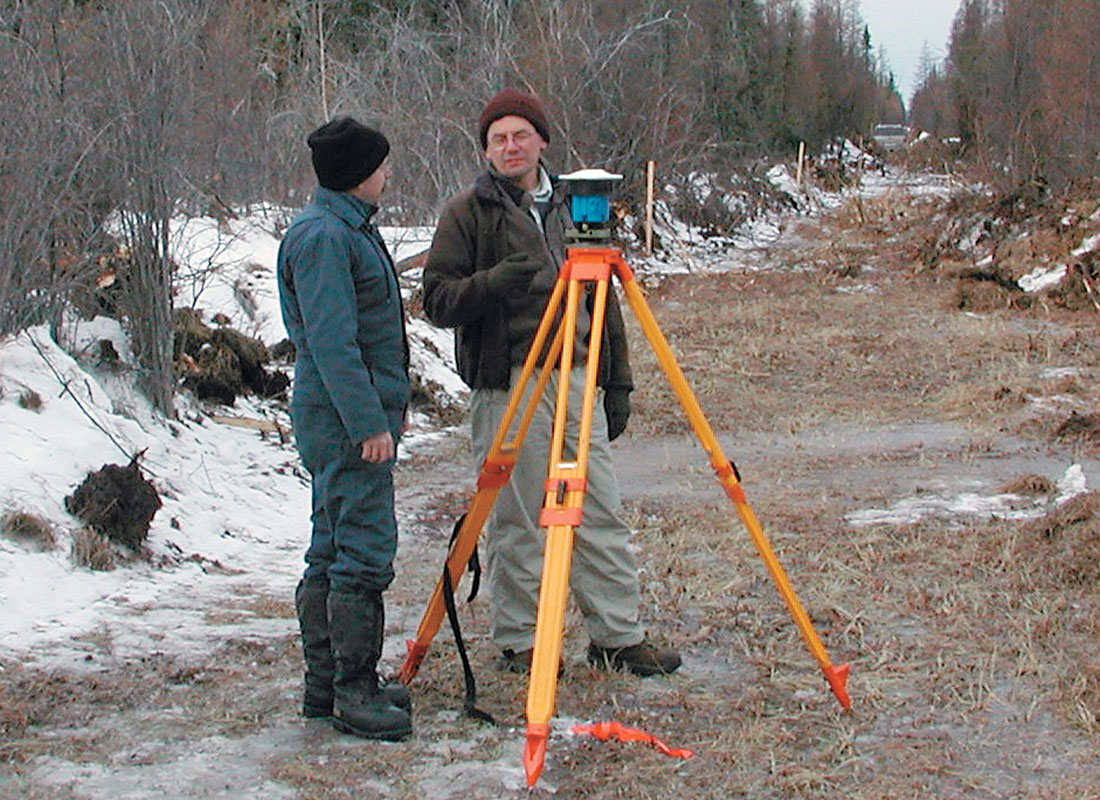
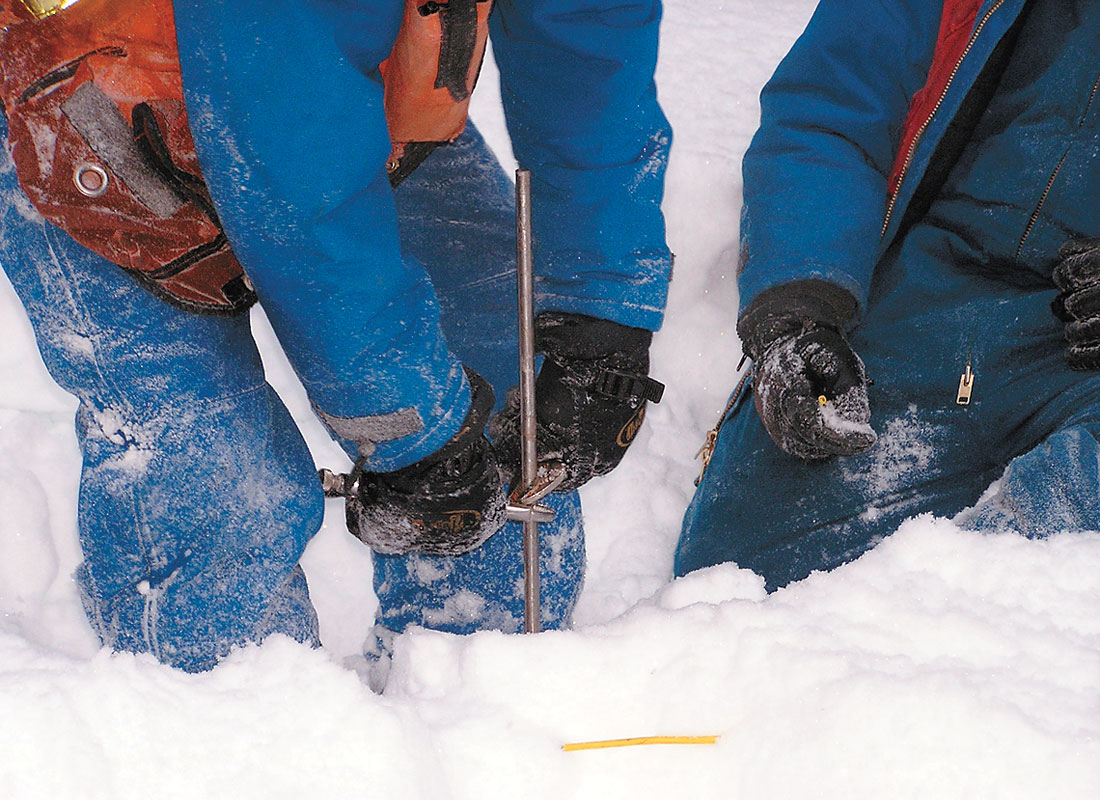
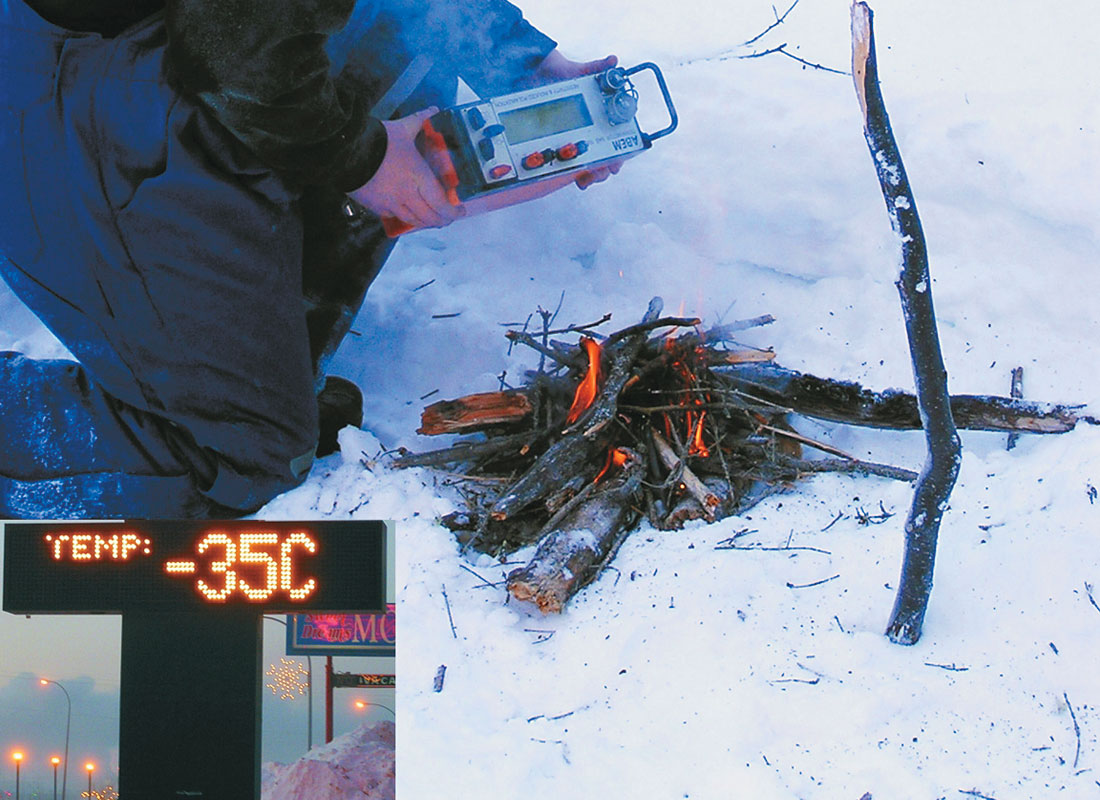
Initial analysis of the seismic refractions and the preliminary reflection profile showed promise in locating the buried channel. Based on these results, an ERT profile was acquired in January 2005 in order to add additional information particularly with regards to the correlation of nearby resistivity anomalies. This work was carried out commercially in January 2005 with members of the scientific team assisting. Conditions in January were not so favourable with extreme cold causing some problems with placement of electrodes and equipment operation (Figure 4).
Results and Discussion
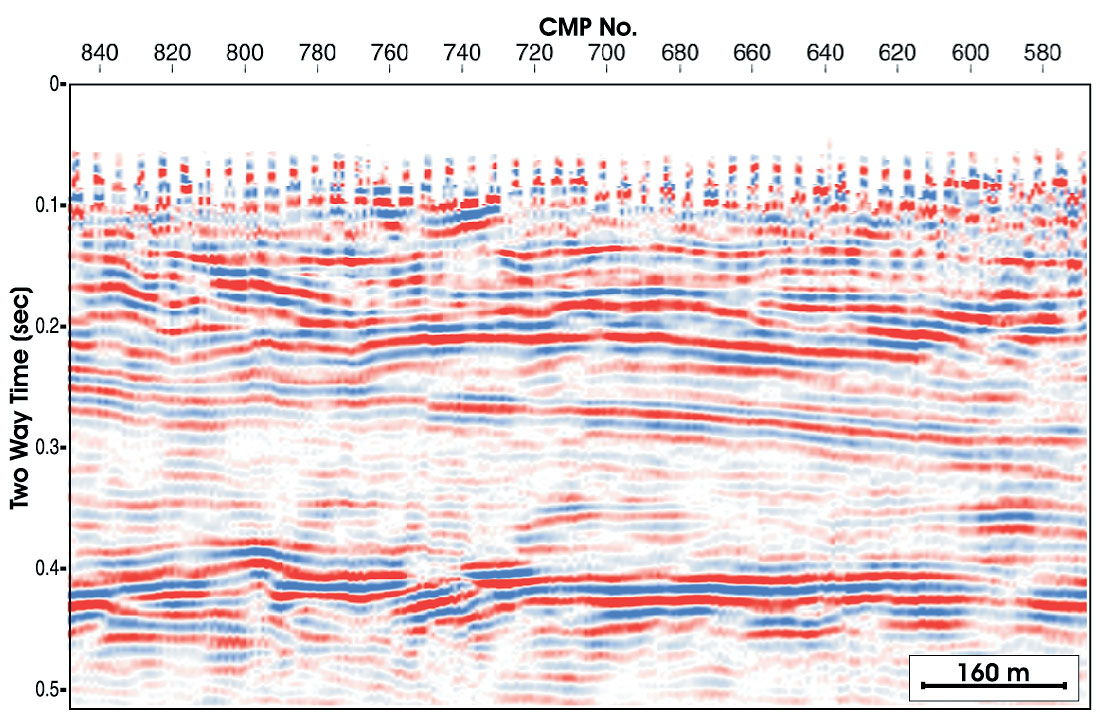
Seismic data was processed at U of A using a conventional processing flow. The shallow nature of the targets made proper velocity analysis difficult; a standard semblance analysis was essentially confirmed by close analysis of the first break refractions, however. Both indicated low velocities to the top of the pre-Cretaceous unconformity, consistent with weakly consolidated channel fill materials, to the east and evolved to higher velocity Cretaceous sediments to the west. Only a portion of the seismic profile is provided here. Preliminary interpretation of seismic profile reveals the Pre-Cretaceous unconformity and shows the presence of stacked Quaternary channel margins (Fig. 5). The processing results are presented in detail in Ahmad et. el., (2005).
The refraction interpretation and velocity analysis clearly reveals the presence of the Sub-Cretaceous unconformity (Mississippian), characterized by materials with seismic velocities of > 5000 m/sec; this is in good agreement with the limestone/dolomote lithology below the unconformity (Ahmad et. el., 2005). Above the unconformity, the refraction analysis yields velocities ~2600 m/s and ~1800 m/s, respectively. These velocities are consistent with the expected and more competent Cretaceous sediments on the west of the line and loosely consolidated laterally migrating Quaternary paleochannel fill sediments to the east (Ahmad et. el., 2005). The detailed geological interpretation is presented in two different poster presentations of Pawlowicz, et. el., (2005) and in Project Poster, (2005).
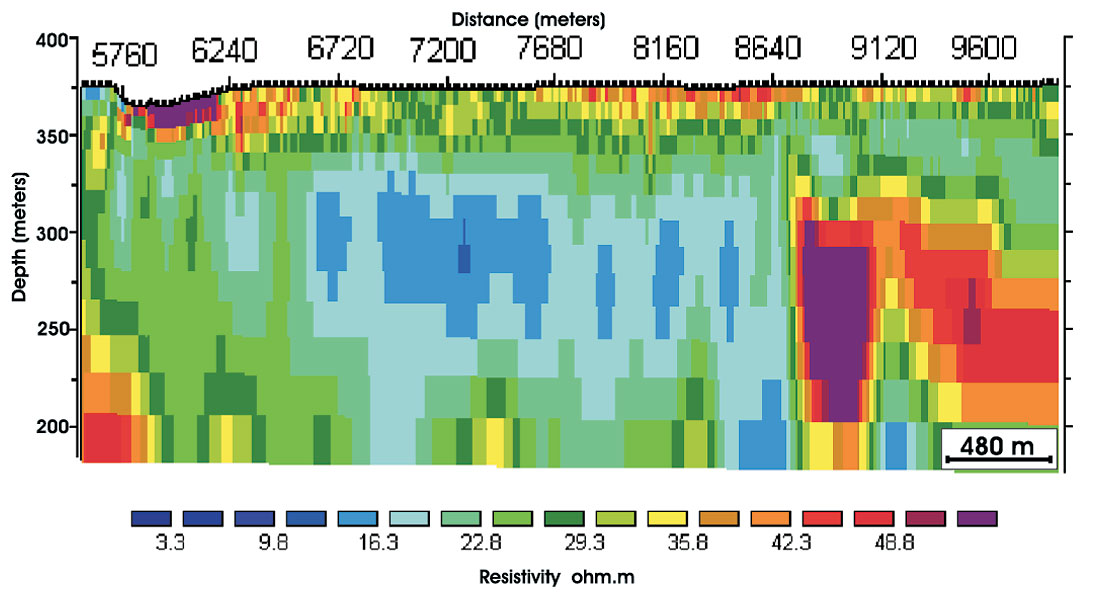
The ERT surveys can highlight potential gas zones based on their high resistivity relative to the surrounding formations. A number of attempts were made to invert this data. A portion of one such inversion shows the existence of one high resisitivity anomaly within the paleovalley filled Quaternary drift (Figure 6).
Quaternary sediments are deposited almost all over Canada during the periods of the last glaciations. Bedrock topography map helps us identifying incised valleys, paleo highs and lows and can be used in a regional context for identification of potential gas plays. Similar features i.e. incised valleys, meltwater channels, glacial lake deposits and preglacial fluvial river systems may be used to find Quaternary gas in many regions.
Such shallow Quaternary gas produces safety hazards which are not unlike those caused by gas chimneys in the offshore environment for which a geohazard survey prior to the drilling is normal practice (Barthold et. el., 2003). High resolution seismic especially processed for detecting ultra shallow high amplitude anomalies, followed by an ERT profile on the same place, will confirm the presence of shallow gas prior to the drilling. Shallow high resolution seismic is a cost effective tool and widely used in hydrogeological and engineering studies. Shallow seismic data processing requires experienced personnel and modification in conventional industry processing software’s that are mainly optimized for deeper targets.
Electrical Resistivity Tomography is a DC resistivity technique that is relatively new in the oil and gas industry although it has been used for decades in detecting aquifers. Advancement in modern computers and inversion algorithms made ERT more effective in imaging shallow geological features. Details of ERT surveying can be found from the RECORDER article by Paul Bauman, (2005).

Acknowledgements
The lead author is thankful to the financial support by Geological Survey of Canada through ‘Targeted Geoscience Initiative-2’ (TGI-2). Thank to the field crew: Marek Welz, Len Tober, Gabrial Solano, Tiewei He, Dean Rokosh and Doug Schmitt (University of Alberta); John Pawlowciz, (Alberta Geological Survey, Edmonton); and Alain Plouffe (Geological Survey of Canada, Ottawa). Marek Welz also assisted greatly with organization , reconnaissance, and data header preparation. The ERT data was acquired by Komex, Calgary by Chris, Christeen and other employees. John Pawlowciz and Jawwad Ahmad also assisted in the ERT field data acquisition.
This paper was presented as an oral presentation at the 2005 CSEG Convention, and adjudged as an ‘Honourable Mention’ item in the student category.


Join the Conversation
Interested in starting, or contributing to a conversation about an article or issue of the RECORDER? Join our CSEG LinkedIn Group.
Share This Article