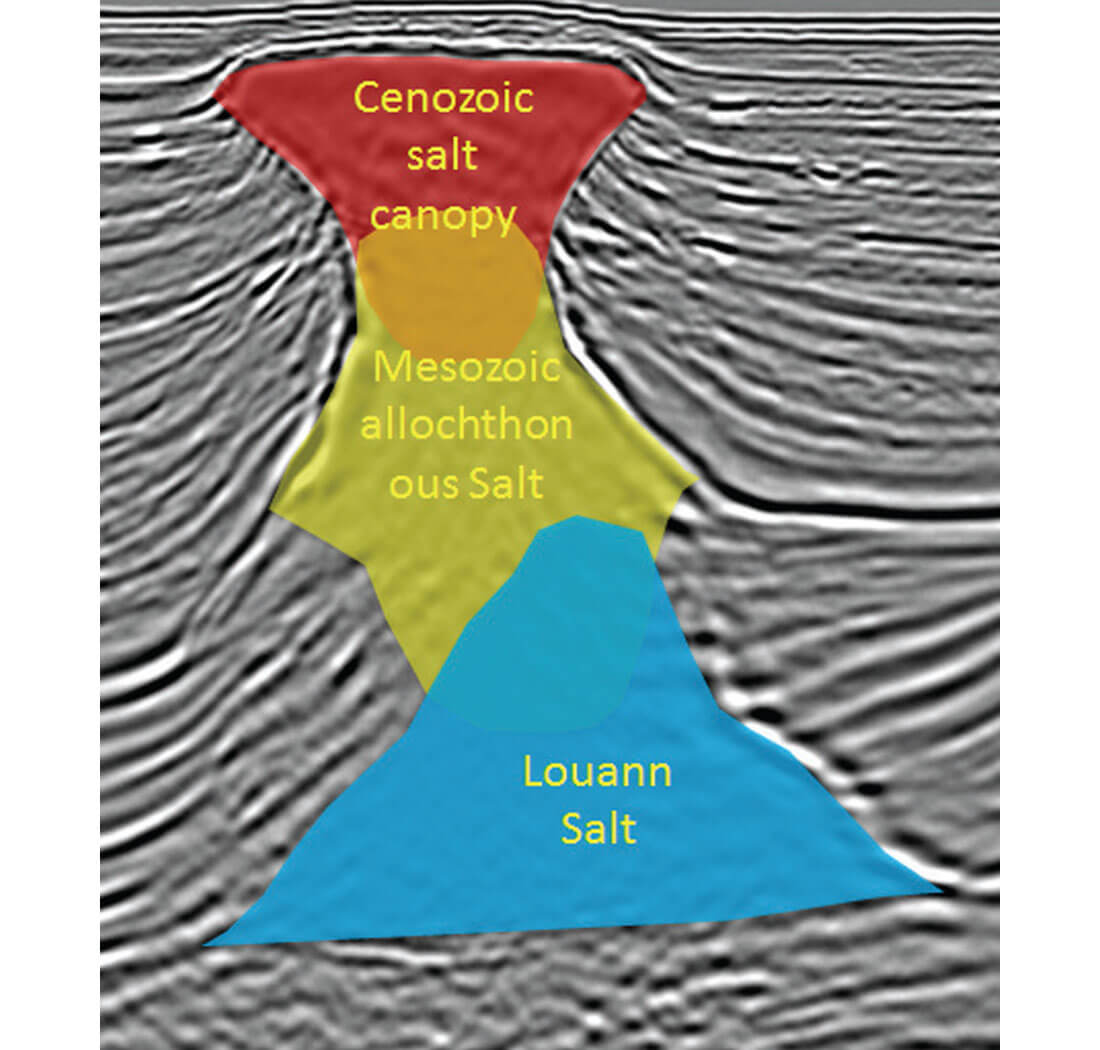
In the Mississippi Canyon a unique characteristic of salt geometries are their stacking hourglass shapes (Figure 1) – autochthonous Louann salt forms the lower part, allochthonous Mesozoic salt forms the middle part, and a Cenozoic salt canopy forms the shallow part. Due to this unique characteristic and the numerous overhangs common in the Cenozoic salt canopy, a piecewise salt modeling workflow with 4 salt bodies is typically followed for defining the salt bodies in this area. Salt body 1 and salt body 2 define the shallow Cenozoic salt canopy which commonly contains multiple overhangs. Salt body 3 defines the allochthonous Mesozic salt and salt body 4 defines the autochthonous Louann Salt. In complex areas where the conventional salt modeling workflow is not sufficient to accurately capture the required details we add a local scenario workflow to the salt modeling workflow in order to more properly define these complex details.
Introduction
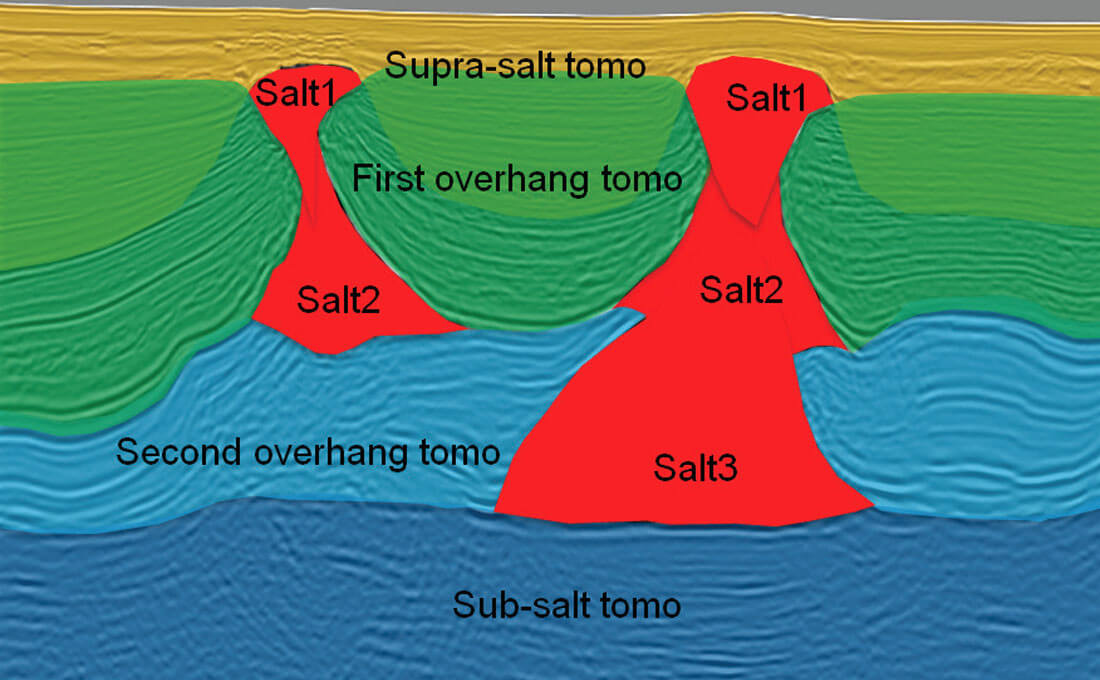
The conventional salt modeling workflow (Figure 2) is a top-down approach. It is done step-by-step, interpreting pairs of salt horizons (each top salt (TOS) paired with a base salt (BOS)) to build the salt model, body-by-body, from shallow to deep. The conventional salt modeling workflow has been the standard workflow for most salt modeling projects during the last decade. In theory, no matter how complex the salt geometry is or how many levels of overhangs there are, a salt model can always be built with this method. However, in practice, some salt geometries in local areas can be quite complex. A conventional model building workflow, where time and iterations are limited, will not be able to solve the complex salt model issues. We will introduce the concept of stacking hourglass-shaped salt and a conventional salt modeling workflow for this type of salt. We will then discuss salt-model challenges in some locally complex areas and present a local salt scenario workflow to address the challenges. Finally we will present an optimized salt-modeling workflow which is the integration of the conventional salt modeling workflow and the local salt scenario workflow.
Geological and geophysical characterization of a typical stacking hourglass salt in Mississippi Canyon area
unique characteristic of salt in the Mississippi Canyon area is its stacking hourglass shape (Figure 1) – directly underneath a salt canopy, there is a widened feeder connecting it to the deep source autochthonous salt. The three levels of the stacking hourglass salt can be defined as below (Figure 2, Figure 3).
The bottom level is the autochthonous Louann Salt which was deposited in the early stages of the formation of the Gulf of Mexico. The Louann Salt is the source of the widespread presence of salt in the Gulf of Mexico. The base of the Louann Salt is usually expected to be geologically flat and smooth, so flatness of the base of the Louann Salt in a depth-processed seismic volume is widely used to evaluate whether the velocity model is geologically plausible.
The middle level is comprised of allochthonous Mesozoic salt. It represents the first, mainly upward movement of salt from its source to younger formations and is usually capped by Upper Cretaceous carbonate in most areas. The geology of the Mesozoic allochthonous salt was not, until relatively recently, well understood. This lack of understanding is due in part to the difficulties of obtaining a reliable image. This level of salt is obscured by a large salt canopy and generally has steeply dipping flanks. These factors combined with a low acoustic-impedance contrast with surrounding high-velocity Cretaceous carbonate have been a challenge to imaging algorithms. Thanks to long-cable wide-azimuth data acquired recently, we begin to see clear images of the middle-level salt and its surrounding sediments. Consequently, we are able to make a more accurate salt model based on these improved images.
The top level is a shallow Cenozoic salt canopy which is the most impressive geological unit in the Gulf of Mexico. The Cenozoic salt canopy includes many periods of salt progression, which result in numerous salt overhangs and inclusions in this level of salt.
Conventional salt modeling workflow and its limitations
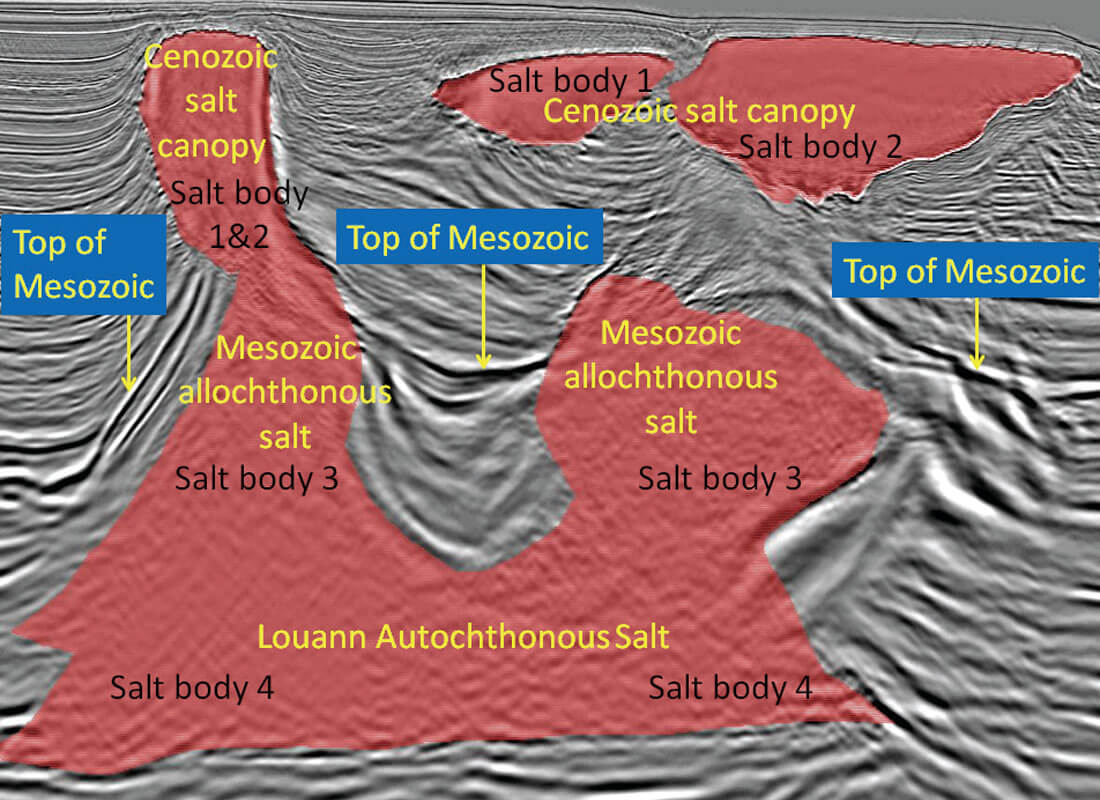
Based on the geological understanding of the stacking hourglass shape of the salt and its numerous overhangs in the shallow Cenozoic canopy level, a four-salt-body model methodology (Figure 3, Table 1) is commonly used for building salt models in the Mississippi Canyon area. Salt body 1 and salt body 2 are used to define the Cenozoic salt canopy in the shallow (first bulb of a stacking hourglass in Figure 2); salt body 3 to define the Mesozoic allochthonous salt in the middle (second bulb of a stacking hourglass); and salt body 4 to define the autochthonous salt in the deep (third bulb of a stacking hourglass). In every salt bulb, there could be multiple levels of small overhangs which represent changes in salt-sediment interactions, so in some local areas extra iterations may be needed to define those small overhangs.
| Salt Level | Salt Model | |
|---|---|---|
| Table 1. Relationship between salt bodies and their geological settings. | ||
| Cenozoic Salt Canopy | Salt Body 1 | TOS 1 |
| BOS 1 | ||
| Salt Body 2 | TOS 2 | |
| BOS 2 | ||
| Mesozoic Allochthonous Salt | Salt Body 3 | TOS 3 |
| BOS 3 | ||
| Louann Autochthonous Salt | Salt Body 4 | TOS 4 |
| BOS 4 | ||
During the past decade the conventional salt-modeling workflow has been commonly used for the majority of depth projects in salt provinces. This methodology has proven to work well in many areas where the salt is not overly complex. However, it is not difficult to imagine scenarios where the conventional salt-modeling workflow might be problematic. First, it is a time-consuming process – a significant portion of project time needs to be allocated to interpreting and picking the top of salt and base of salt horizons. Second, when the exploration targets are becoming more focused on subsalt areas, the accuracy of the salt model is becoming more critical in order to meet project objectives in the Gulf of Mexico. Third, in some mature areas where there already are old salt models from legacy projects, salt modeling is becoming more focused on adding details and accuracy to the existing models rather than using the conventional workflow to redo the salt model.
Here we present 3 typical salt-modeling challenges to better explain the limitations of the conventional salt-modeling workflow and the necessity to optimize the salt-modeling workflow to fit the requirements of subsalt exploration in both timing and quality.
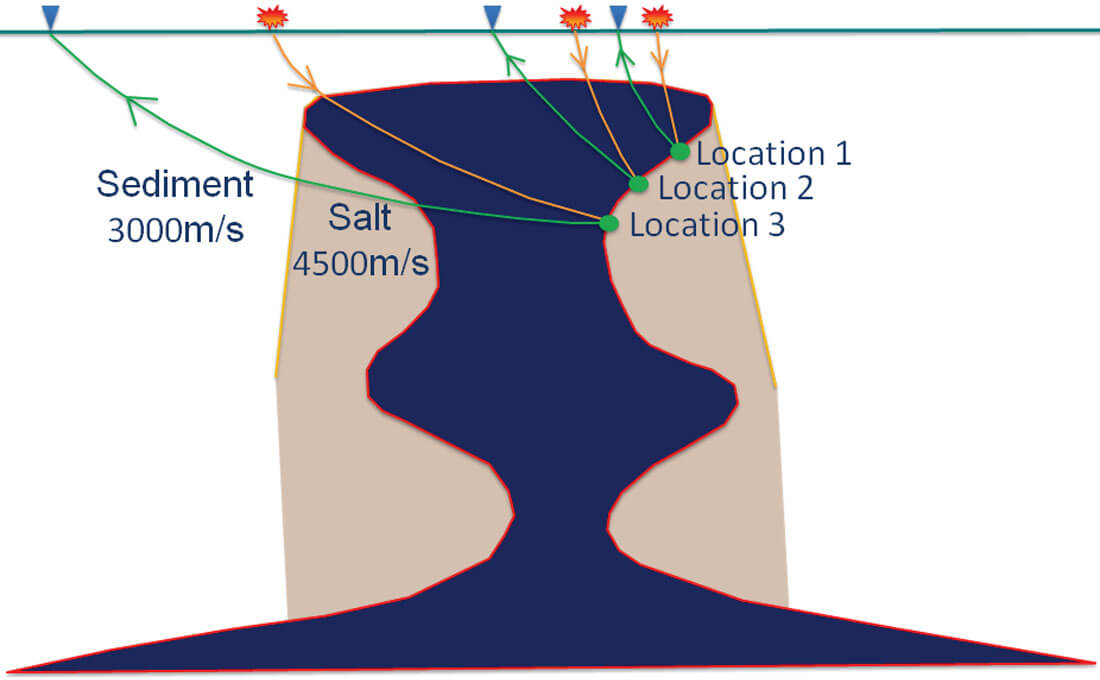
The first challenge is to define steeply dipping salt flanks. The conventional salt-modeling workflow is based on the assumption that when the velocity field is changed, the positions of salt flanks will mainly move vertically, and that their lateral movement is negligible. This assumption works well for tabular salt, but for salt with steeply dipping flanks, a change of the velocity field can cause the salt flank events to move laterally. Figure 4 is a simplified ray-racing analysis showing why salt flanks could change a lot laterally when the velocity field is changed. For BOS at Location 1 and Location 2, the rays go through the correct velocity zones in the salt-flood migration, so the positions of the BOS at the two locations are correct in the salt-flood volume. But for Location 3, the ray would go through the incorrect velocity zone in the salt-flood migration, so the position of the BOS at Location 3 in the salt-flood volume is not correct. Based on this analysis, we can expect that after replacing salt velocity with sediment velocity below the BOS the position of the BOS would change. Also, a sediment velocity update in this area will consequently change the position and image of the BOS at Location 3. This analysis explains that in the salt-flood volume in Figure 5 the BOS was picked as the red horizon and that in the salt-body volume in Figure 5 the BOS moves up after the velocity below the BOS is changed from salt velocity to sediment velocity.
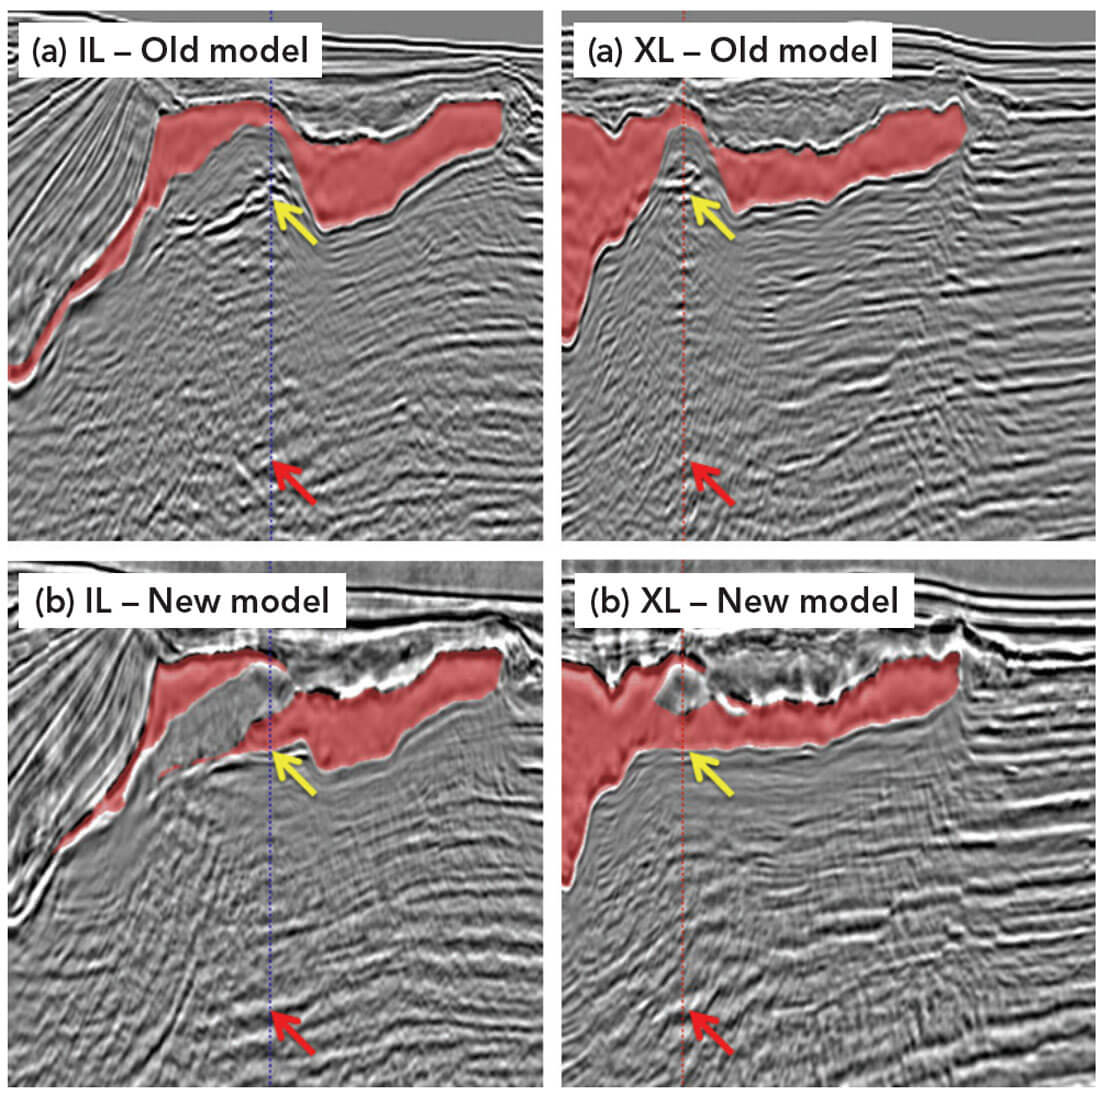
The second challenge is to model small multioverhangs. Small overhangs are traditionally considered as noncritical and frequently are compromised when time and iterations are limited. But more and more examples have shown that small overhangs, especially in shallow areas, can have significant impact on subsalt images. Figure 6 is a comparison of two different salt models and their impact on subsalt images.
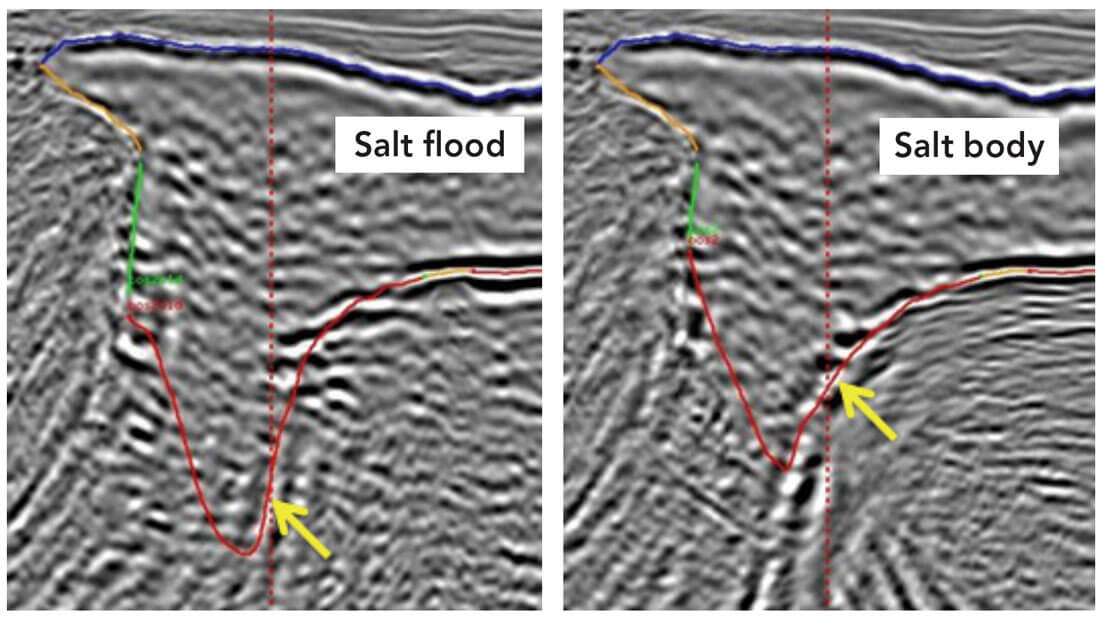
Figure 6(a) shows a simplified model and its RTM images in the IL and XL directions. Figure 6(b) shows a new model with the overhang well defined on the same IL and XL as in Figure 6(a). Clear improvements have been made with the new detailed salt model. In Figure 6(a), BOS energy at the location identified by the yellow arrows is not focused, the events are broken and noisy, and the subsalt image identified by the red arrows is not clear or continuous. In Figure 6(b), BOS energy, identified by the yellow arrows, is well focused and the BOS event is aligned with the regional trend of the salt canopy. Furthermore, the subsalt events are well connected regionally and the subsalt structures are also better focused.
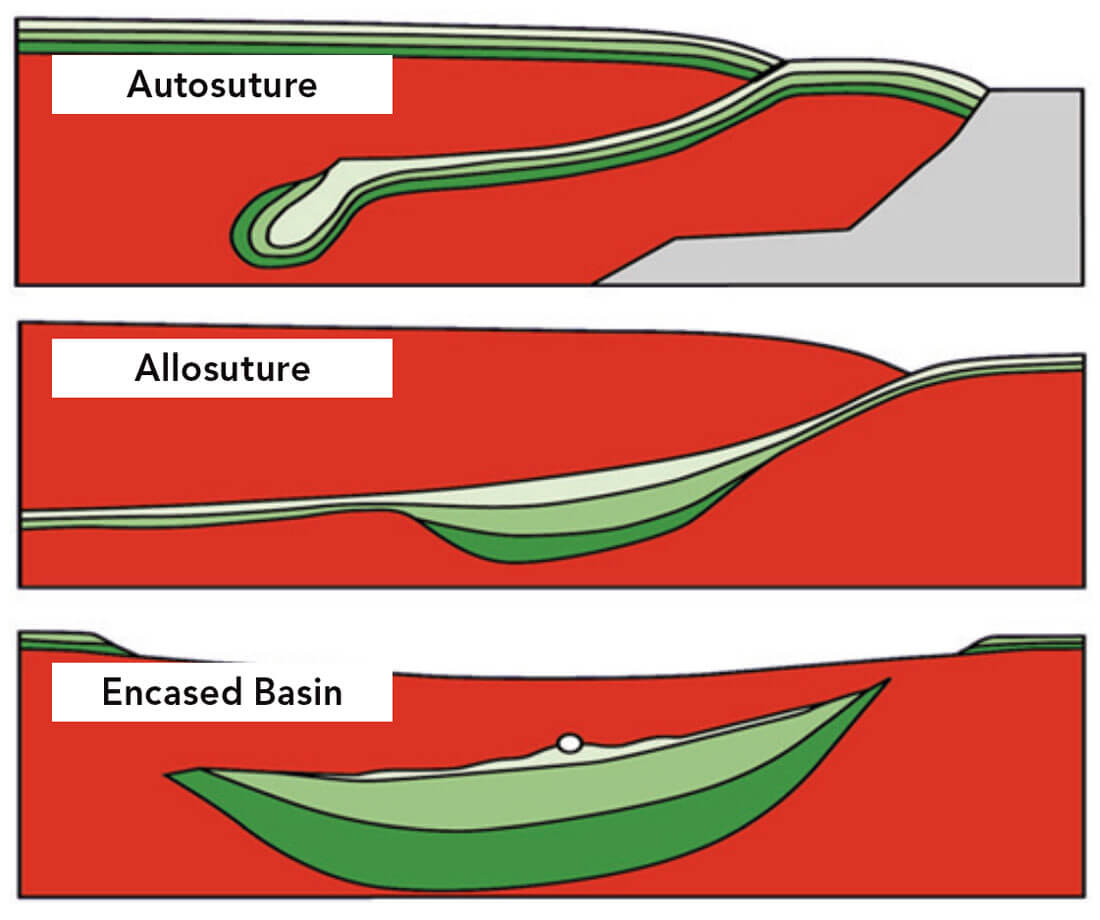
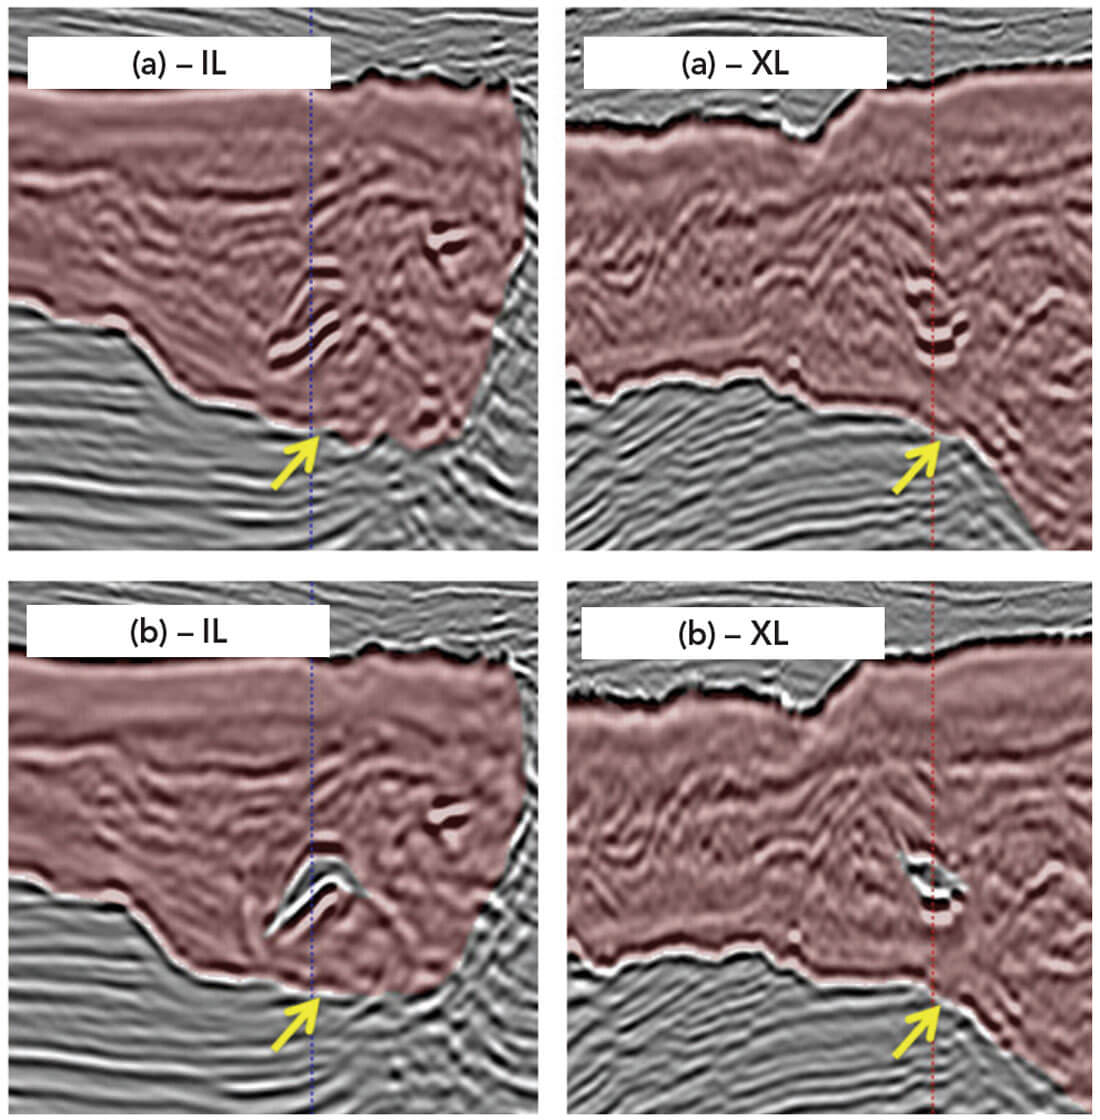
The third challenge is to model sediment inclusions in the salt. Hudec et al. (2012) described three types of salt inclusions (Figure 7) – autosuture, allosuture and encased basin. An autosuture is a suture between two lobes of the same salt sheet, an allosuture is a suture between salt sheets having separate feeders, and an encased basin is a secondary minibasin covered by a higher allochthonous salt sheet or equivalent salt weld. Even if the inclusions are very small, they can still have a significant impact on subsalt images. Figure 8 is a comparison of salt models with and without the sediment inclusion. Figure 8(a) shows an RTM image migrated with a salt model in which the inclusion is ignored. The result shows that below the inclusion the BOS reflection is discontinuous. With the inclusion model shown in Figure 8(b) the BOS image issue is healed. It is clear that the model with the inclusion interpreted produces a more geologically consistent image.
Local salt scenario workflow for complex salt
In a conventional salt-modeling workflow, project time and iterations are usually not enough to solve the challenges presented in the previous section. To solve these challenges, we have designed a local salt-scenario workflow to ensure that these complex salts can be accounted for and also that projects can be completed effectively and efficiently. The local salt-scenario workflow involves identifying scenario areas, picking comparable scenarios based on different geological concepts, applying the scenario models for migration, evaluating results, identifying the best scenarios as well as the geological concepts behind the scenarios. The reasons for applying the local salt-scenario workflow are described in more detail below.
First, limited iterations based on the conventional salt-modeling workflows may not be sufficient to define some complex salt areas. As introduced in the beginning, in a normal salt-modeling workflow the first and second salt bodies are used to define the shallow salt canopy, the third salt body is used to define the Mesozoic allochthonous salt and the fourth salt body is used to define the Louann autochthonous salt. However, in each of these salt regimes there can be multiple overhangs in some local areas which would require several extra iterations.
Second, allocated interpretation time may not be generous enough for solving difficult salt-model problems. Production salt modeling is a time-consuming process and many steps may be needed for solving salt-model problems in some locally difficult areas. A scenario approach targeting those locally difficult areas will make the salt modeling more efficient.
Third, there are often complex areas where we need to test and compare different scenarios before we can determine which scenario will give the best subsalt image and which geological concept is the most reasonable one to pursue.
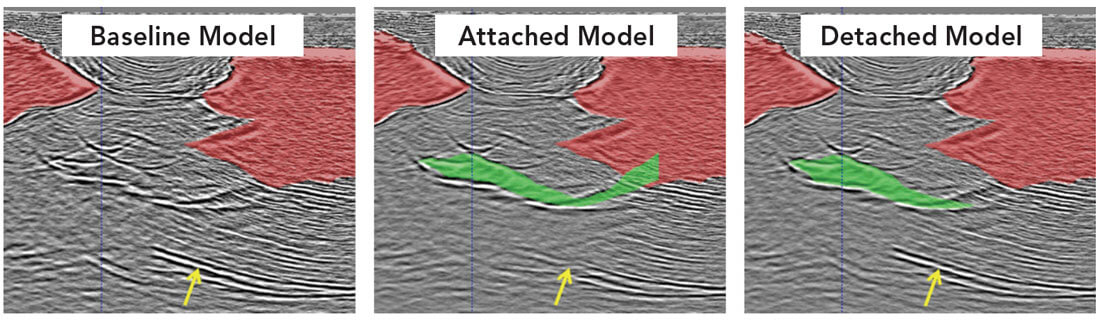
Figure 9 shows an example of the local-scenario workflow. The red-colored area is the existing shallow salt model. There are two scenarios starting from the same baseline model. The first scenario, an attached salt model, proposes that the thin salt between the two red-colored salt canopies is attached to the salt canopy on the right; and the second scenario, a detached salt model, proposes that the thin salt is not attached to the salt canopy on the right. By comparing migration results based on the two scenario models we found that for the model where the thin salt is attached to the larger shallower salt body, the subsalt image is not preserved or enhanced and the base-salt reflector is not well positioned or flattened. The model where the thin salt is detached from the larger, shallower salt body produces an image where the subsalt event is retained or enhanced and the base-salt reflector is well positioned and flattened. Clearly the detached salt model gives a better and more geologically reasonable subsalt image. We conclude that the detached salt model is preferred over the attached salt model. Table 2 is a list of the key information for the scenario test migrations.
| Scenario 1 | Scenario 2 | Scenario 3 | |
|---|---|---|---|
| Table 2. A template example of a local salt-scenario test. | |||
| Purpose | Establish baseline | Test if the thin salt is connected to the main salt canopy | Test if the thin salt is detached to the main salt canopy |
| Algorithm | Kirchhoff depth migration | Kirchhoff depth migration | Kirchhoff depth migration |
| Model | Legacy shallow canopy model (TOS1/BOS1 and TOS2/BOS2) | Legacy TOS1/BOS1, TOS2/BOS2, plus the attached salt model | Legacy TOS1/ BOS1, TOS2/BOS2 plus the detached salt model |
| Inline range | 1234–2345 | 1234–2345 | 1234–2345 |
| Xline range | 4567–6789 | 4567–6789 | 4567–6789 |
| Depth | 0–10,000 m | 0–10,000 m | 0–10,000 m |
Conclusions
In the Mississippi Canyon area, due to the unique characteristics of stacking hourglass-shaped salts, a four-salt-body model is usually applied in a conventional salt modeling workflow. In a locally complex salt area, the conventional four-salt-body model is not enough to define the detail and accuracy needed for optimal imaging, at least not without adding several iterations and time for interpretation. We describe a local salt-scenario workflow to specifically target those complex salt areas. In this combined workflow, a conventional salt modeling workflow is applied to the whole survey to build a salt-model framework, and in the complex areas the local salt-scenario workflow is used to make sure all needed detail and accuracy are identified and incorporated into the final salt model. By integrating the conventional salt-modeling workflow with the local scenario- modeling workflow we can greatly improve the accuracy of the resulting salt model and can significantly reduce project turnaround time.

Acknowledgements
The authors would like to thank Susan Williams, Dan Chaikin, Sidra Shahid, Griselda Martinez, Jianshun Sheng and Zhongyang Dong for their contributions; Connie VanSchuyver for proofreading the manuscript; CSEG editors Omid Aghaei, Brian Schulte and Nicole Willson for reviewing the manuscript; and TGS management for permission to publish this paper.


Join the Conversation
Interested in starting, or contributing to a conversation about an article or issue of the RECORDER? Join our CSEG LinkedIn Group.
Share This Article