Summary
Various physical processes cause anomalous pressures of underground fluids in a petroleum province. We quantify the effect on seismic properties caused by the common mechanisms of overpressure generation such as (kerogen-to-oil and oil-to-gas conversion) disequilibrium compaction.
Fluid pressure due to kerogen-to-oil conversion in source rock shale significantly reduces the seismic velocities and enhances the anisotropy. Attenuation and attenuation anisotropy are also strongly affected, thus further enhancing the seismic visibility of overpressure in the shale.
In deeply buried reservoirs, oil-to-gas cracking may increase the fluid pressure to reach the lithostatic pressure, and the seismic velocities decrease significantly when only a small fraction of oil in a closed reservoir is converted to gas.
Non-equilibrium compaction generates abnormal pressures that, under certain conditions, can be detected with seismic methods. In this case, the fluid mixture filling the pore space has a major influence on P-wave velocity and may cause under- or over-pressures depending on its compressibility and thermal expansion coefficient. Rocks saturated with fluids of low compressibility and high thermal expansion are generally overpressured and can be seismically visible.
Based on a generalized Biot-Gassmann model for the acoustic properties of shaley sandstones, with an arbitrary pore fill mixture of fluid and gas, we have developed a new method for estimating fluid pressure in reservoir rocks from seismic data. The method which rely upon calibration against well data or laboratory data, when available, has been applied to a deeply buried overpressured gas-field in the Norwegian North Sea using velocities obtained from 3-D reflection tomography.
1. Introduction
Abnormal pressure, or pressures above or below hydrostatic pressure, occurs on all continents in a wide range of geological conditions. Various physical processes cause anomalous pressures in an underground fluid. The most commonly cited mechanisms for abnormal pressure generation in petroleum provinces are compaction disequilibrium and hydrocarbon generation including oil-to-gas cracking (Mann and Mackenzie, 1990; Luo and Vasseur, 1994). In young (Tertiary) deltaic sequences, compaction disequilibrium is the dominant cause of abnormal pressure. In older (pre-Tertiary) lithified rocks, hydrocarbon generation and tectonics are most often cited as the causes of overpressure (Law et al, 1998).
Hydrocarbon accumulations are frequently found in close association with abnormal pressure. In exploration for hydrocarbons and exploitation of the reserves, knowledge of the pressure distribution is of vital importance for prediction of the reserves, for the safety of the drilling and for optimising the recovery rate. Moreover, drilling of deep gas resources is hampered by high risk associated with unexpected overpressure zones. Knowledge of pore pressure using seismic data, as for instance from seismic-while- drilling techniques, will help producers plan the drilling process in real-time to control potentially dangerous abnormal pressures.
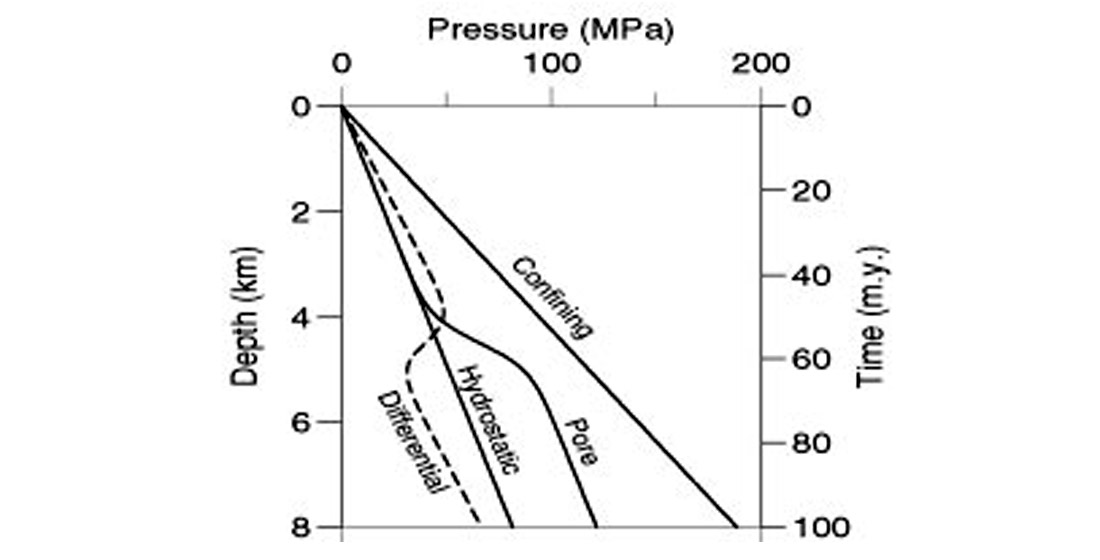
In order to illustrate the physics of geopressure, let as review the main concepts (see Figure 1.1). Pore pressure, also known as formation pressure, is the in situ pressure of the fluids in the pores. The pore pressure is equal to the hydrostatic pressure when the pore fluids only support the weight of the overlying pore fluids (mainly brine). The lithostatic or confining pressure is due to the weight of overlying sediments, including the pore fluids. In the absence of any state of stress in the rock, the pore pressure attains lithostatic pressure and the fluids support all the weight. However, fractures perpendicular to the minimum compressive stress direction appear for a given pore pressure, typically 70-90% of the confining pressure. In this case, the fluid escapes from the pores and pore pressure decreases. A rock is said to be overpressured when its pore pressure is significantly greater than hydrostatic pressure. The difference between confining pressure and pore pressure is called differential pressure. As we shall see later, acoustic and transport properties of rocks generally depend on effective pressure, a combination of pore and confining pressures.
In deeply buried oil reservoirs, oil-to-gas cracking may increase the pore pressure to reach or exceed the lithostatic pressure (Chaney, 1950; Barker, 1990; Luo and Vasseur, 1996). Oil can be generated from kerogen-rich source rocks and flow through a carrier bed to a sandstone reservoir rock. Excess pore-fluid pressures in sandstone reservoirs are generated when the rate of volume created by the transformation of oil to gas is more rapid than the rate of volume loss by fluid flow. If the reservoir is sealed on all sides by an impermeable shale or limestone, then the condition of a closed system will be satisfied for gas generation. Due to the presence of semi-vertical fault planes and compartmentalization, this condition holds for most North Sea reservoirs.
Non-equilibrium compaction or mechanical compaction disequilibrium is a consequence of a rapid deposition compared to the rate of expelling pore fluids by gravitational compaction. In this situation, the fluids carry part of the load that would be held by grain contacts and abnormal pore pressures develop in the pores-pace. A description of this overpressure mechanism is given by Rubey and Hubbert (1959) and mathematical treatments of the problem are provided, for instance, by Bredehoeft and Hanshaw (1968), and Smith (1971) and Dutta (1983). These models use Darcy’s law and their predictions are greatly affected by the choice of the constitutive relations between porosity, permeability and effective stress.
Experimental data shows that Poisson’s ratio is a good indicator of overpressure, since in gas-saturated rocks Poisson’s ratio decreases with increasing pore pressure, while it increases in liquid-saturated rocks (Dvorkin and Walls, 2000). These properties are used by Carcione and Cavallini (2002) to design an algorithm for predicting pore pressure from seismic data.
Pressure compartments are common in sedimentary basins (Chiarelli and Duffaud, 1980; Bradley and Powley, 1994; Law et al., 1998). Their knowledge is extremely important to the drilling engineer to prevent blowouts and/or lost circulations. Pressure compartments can be subdivided into two different classes: those created by disequilibrium compaction and characterized by large volumes of low permeability rock; and those bounded by seals, which are formed by a combination of low permeability effects (e.g., shales) and high capillarity pressure due to the interfacial tension between two fluids (Iverson et al., 1994). Pressure compartments are bounded by pressure seals. Unlike pure capillary seals, which permit the flow of the wetting phase (brine), a pressure seal restricts both hydrocarbon and brine flow.
Effective stress and effective pressure play an important role in rock physics. The use of this concept is motivated by the fact that pore pressure, p, and confining pressure, pc, tend to have opposite effects on the acoustic and transport properties of the rock. Thus, it is convenient to characterize those properties with a single pressure, the effective pressure pe. Terzaghi (1936) proposed pe = pc – ϕp, where ϕ is the rock porosity, but his experiments, regarding the failure of geological materials, indicated that pe = pc – p. Nowadays, it is well known that effective pressure takes the form pe = pc – np, where n is the effective stress coefficient (Biot, 1962; Todd and Simmons, 1972; Carcione, 2001, p. 224). Biot’s theory predicts an effective stress coefficient n = 1 – Km /Ks , where Km is the bulk modulus of the dry frame and Ks is that of the elastic solid from which the frame is made. It is found that n ≈ 1 for static measurements of the compressibilities (Zimmerman, 1991), while n is approximately linearly dependent on the differential pressure pd = pc – p in dynamic experiments (Gangi and Carlson, 1996; Prasad and Manghnani, 1997).
In general, non-seismic methods to predict pore pressure are based on a relation between porosity or void ratio and effective stress (Bryant, 1989; Audet, 1996; Traugott, 1997; Holbrook et al, 1995). Indirect use of velocity information involves the estimation of the porosity profile by using sonic-log data (Hart et al., 1995; Harrold et al., 1999). AMWD (measurement while drilling) technique is proposed by Lesso and Burgess (1986), based on mechanical drilling data (rock strength computed from ROP (rate of penetration), weight on bit (DWOB) and torque (DTOR)) and gamma ray logs.
Hydrocarbon reservoirs are generally overpressured. This situation can, in principle, be characterized by seismic waves. To this end, the dependence of the P-wave and S-wave velocities on effective stress plays an important role. Seismic data can be used to predict abnormal pore pressures in advance of drilling. In general, this prediction has been based on normal move-out analysis (e.g., Bilgeri and Ademeno, 1982) and empirical models relating pore pressure to seismic properties. In order to obtain the acoustic properties, such as wave velocity and attenuation factor, versus pore and confining pressures, the dry-rock bulk and rigidity moduli, Km and μm, should be evaluated as a function of the effective pressure. Then, an appropriate model, such as Biot’s theory (Biot, 1962; Carcione, 2001, p. 219-293), can be used to obtain the properties of the saturated porous medium. Those moduli can be obtained from laboratory measurements in dry samples or from well data.
The procedure is to fit the experimental data by exponentiallike functions (e.g., Zimmerman, 1991, p. 43). Knowing the effective- stress coefficients for Km and μm (from Biot’s theory or obtained from well or laboratory data), it is possible to obtain the wave velocities for different combinations of the pore and confining pressures, since the property should be constant for a given value of the effective pressure. This is achieved by simply replacing the confining pressure by the effective pressure. An example of the application of this approach can be found in Carcione and Gangi (2000a,b), where the effects of disequilibrium compaction and oil to gas conversion on the seismic properties are investigated. Use of high-frequency (laboratory) data to make predictions in the seismic — low-frequency — band should be considered with caution, since the fluid effects on wave velocity and attenuation depend on the frequency range (e.g. Pham et al., 2002).
Louis and Asad (1994) used a modeling technique to analyze the amplitude variations with offset (AVO) of pressure seals. Acoustic synthetic seismograms based on well logs showed that a strong AVO effect is associated with steep pressure and velocity gradients. Carcione (2000a) considers a rock-physics model relating pressure and temperature to wave velocity and studies amplitude variations with offset of pressure-seal reflections. The model relates pore pressure to the seismic properties of a closed rock volume (the compartment). Carcione investigates the AVO response of pressure seals consisting of interbedded shale and sandstone units. The pressure model assumes that the pores are filled with oil, gas and brine. Balancing volume fractions in the pore-space yields the fluid saturations and the porosity versus pore pressure, as a function of the initial (hydrostatic) saturations and porosity (Berg and Gangi, 1999; Carcione, 2001, p. 227-229). Laboratory experiments on dry and saturated samples, for different confining and pore pressures, provide the rock moduli versus effective pressure. The AVO response of the seal is obtained by computing the reflection coefficient of a set of transversely isotropic layers (the seal) embedded between two isotropic half-spaces (the rock units above and below the seal).
The effect of clay and frequency on the acoustic properties (mainly velocity dispersion and attenuation) can be modeled by using a micro-structural theory where all the relevant physical quantities can be taken into account. The model developed by Pham et al. (2002) establishes a relation between wave velocity and attenuation and clay content, porosity, pore and confining pressures, frequency, and pore-fluid saturation. Modeling the acoustic properties of shaley sandstones is achieved by using the theory developed by Carcione et al. (2000) in the framework of Biot’s theory of poroelasticity. Unlike previous theories, this approach uses a Biot-type three-phase theory that considers the existence of two solids (sand grains and clay particles) and a fluid. The theory has been generalized to include the effects of pore pressure, partial saturation and the presence of dissipation mechanism of different nature (Pham et al., 2002). Pressure effects are introduced by using an effective stress law. The effect of partial saturation on velocity and attenuation depends on the frequency range. At low frequencies, the fluid has enough time to achieve pressure equilibration (relaxed regime). In this case, the Reuss model for the bulk modulus of the fluid mixture yields results that agree with the experiments. On the other hand, at high frequencies the fluid can not relax and this state of unrelaxation induces a stiffening of the pore material, which increases the wave velocity considerably (Cadoret et al., 1995). This effect implies an uneven distribution of fluids in the pore-space, which is normally termed patchy saturation. In this case, Reuss’ model is not appropriate and, in general, a Hill average is used to model the wave velocities at ultrasonic (laboratory) frequencies. No microstructural theory is able to predict the behavior at intermediate frequencies. A modified empirical fluid mixing law, proposed by Brie et al. (1995), gives the Reuss modulus at low frequencies and the Voigt modulus at high frequencies.
Attenuation is described by using a constant-Q model for the dry-rock moduli (Kjartansson, 1979; Carcione, 2001, p. 73). This approach is phenomenological, since a theory describing all the attenuation mechanisms present in a real sandstone is difficult, if not impossible, to develop. The constant-Q kernel is the simplest model based on only one parameter. We assume that the lower the frame modulus, the lower the quality factor is (that is, the higher the attenuation). Using this property, we assign a Q-factor to the sandstone bulk modulus, and obtain the Q-factor associated with the shear modulus. The Biot attenuation mechanisms are modeled by the original theory (Carcione et al., 2000), and, high-frequency viscodynamic effects are described by an optimal viscodynamic function obtained by Johnson et al. (1987).
As stated in previous works (Carcione and Gangi, 2000a,b), the large change in seismic velocity is mainly due to the fact that the dry-rock moduli are sensitive functions of the effective pressure, with the largest changes occurring at low differential pressures. The major effect of porosity changes is implicit in the dry-rock moduli. Explicit changes in porosity and saturation are important but have a lesser influence than changes in the moduli. In this sense, porosity-based methods can be highly unreliable. In fact, variations of porosity for Navajo sandstone, Weber sandstone and Berea sandstone, are only 1.7%, 7% and 4.5%, respectively, for changes of the confining pressure from 0 to 100 MPa (Berryman, 1992). The bulk and shear moduli of the sand and clay matrices versus porosity are obtained from a relationship proposed by Krief et al. (1990). To obtain the expression of the dry-rock moduli versus effective pressure, the model requires calibration based on well, geological and laboratory data, mainly sonic and density data, and porosity and clay content inferred from logging profiles.
Oil can also be extracted from shales, which can be overpressured (Matusevich et al, 1997; Berg and Gangi, 1999). In this case, overpressure takes place by conversion of kerogen to oil. Carcione (2000b) obtains a model for source-rocks relating seismic anisotropy (in velocity and attenuation) to kerogen content, pore pressure and water saturation. Recent petrophysical analyses of petroleum source-rocks (Vernik and Landis, 1996) indicate that the observed strong velocity anisotropy can be associated with the presence of organic matter and its distribution in the rock matrix. Most hydrocarbon source-rocks are laminated structures composed of organic matter (kerogen and oil) and illite layers. When the seismic wavelength is much larger than the thickness of the single layers, the finely layered medium behaves as a homogeneous transversely isotropic material, whose stiffnesses can be obtained using Backus averaging technique (Schoenberg and Muir, 1989). Assuming that the illite and the organic material are attenuating media, a generalization of the averaging technique to the dissipative case gives not only the wave velocities (Vernik and Nur, 1992; Vernik, 1994) but also the dissipation factors as a function of organic matter and propagation direction.
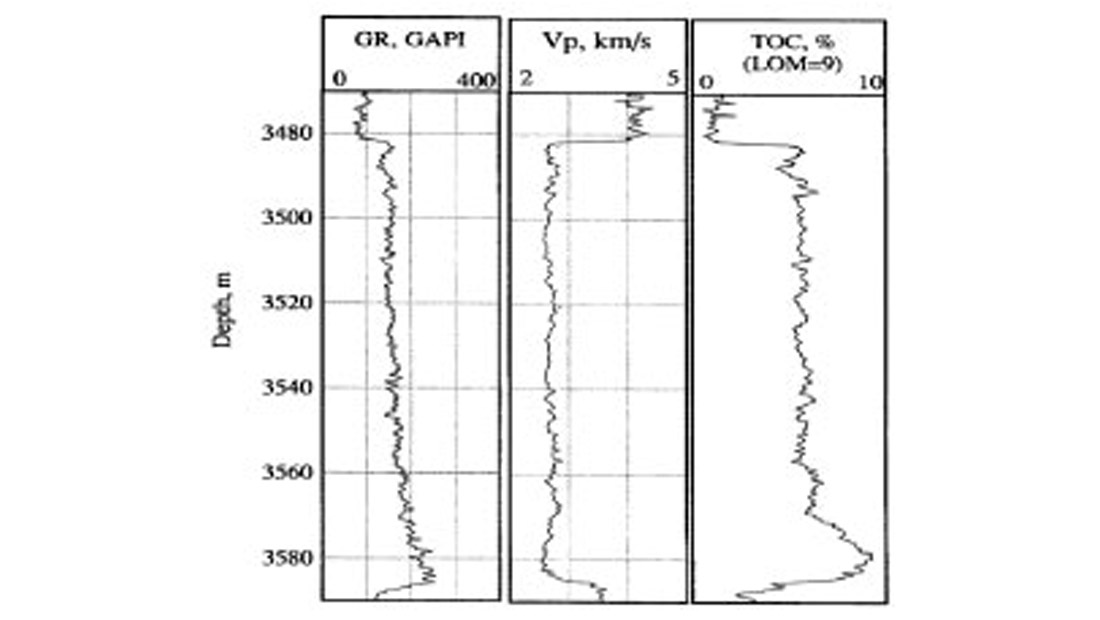
The maturation level of source-rocks can be associated with oil generation and overpressuring (e.g., Meissner, 1978). If the conversion rate is more rapid than the rate of volume loss by fluid flow, excess pore pressure is generated. A typical situation in the North Sea source-rocks is represented by the Kimmeridge shale, a source-rock from the Draupne formation, with a maximum thickness of nearly 200 m, overlain by high velocity chalk. The observed velocity contrast and thickness make the Kimmeridge shale an easily identified seismic unit. P-wave velocity and quality factor of the hydrocarbon source-rock (normal and parallel to the bedding plane) are calculated as a function of organic content and pore pressure.
We illustrate the use of the concepts mentioned above by predicting pore pressure in a North-Sea reservoir using seismic and well data. In general, this prediction has been based on empirical models relating pore pressure to sonic and/or seismic velocity ( Dutta an Levin, 1990; Foster and Whalen, 1966; Pennebaker, 1968; Eaton, 1976; Belotti and Giacca, 1978; Bilgeri and Ademeno, 1982; Keyser et al., 1991; Kan and Sicking, 1994; Bowers, 1995; Eaton and Eaton, 1997; Sayers et al., 2000). Here we use the Biot-type three-phase theory developed by Carcione et al. (2000). At low frequencies, this theory is a generalization of Gassmann’s equation for shaley sandstones, based on first physical principles. The method requires high-resolution velocity information, preferably obtained from seismic inversion techniques. As is well known, interval velocities obtained from conventional seismic processing are not reliable enough for accurate pore pressure prediction (Sayers et al., 2000; Carcione and Tinivella, 2001). Calibration of the model requires well information, that is, porosity and shale volume estimation, direct measurements of pore pressure and sonic-log data. Laboratory measurements of P- and S-wave velocities on cores samples may further improve the calibration process (Carcione and Gangi, 2000a,b).
2. Mechanisms of overpressure generation and the effect on seismic properties.
In order to find the appropriate relationships between underground fluid pressure and seismic properties, we first investigate the impact of the main pressure generating mechanisms on the petrophysical characteristics of source-rock shales and sandstones.
Hydrocarbon generation from source-rocks
The maturation level of a source-rock can be associated with oil generation and overpressuring (e.g., Meissner, 1978). If the conversion rate is more rapid than the rate of volume loss by fluid flow, excess pore pressure is generated. Berg and Gangi (1999) developed a simple model to calculate the excess pore pressure Δp as a function of the fraction of kerogen F converted to oil:

where ρk and ρo are the densities of kerogen and oil, respectively, and cp, ck and co are the pore, kerogen and oil compressibilities.
A typical situation in the North Sea is represented by the Draupne Formation (Figure 2.1), a Kimmeridge source-rock shale, with a maximum thickness of about 200 m, overlain by a high velocity chalk (Vernik, 1995). Between the overlying chalk and the hydrocarbon source-rock, the P-wave velocity drops from about 4.5 to 3.5 km/s (normal to the bedding plane) and density from 2.75 to 2.35 g/cm3, producing the strongest regional seismic marker at Jurassic level in the North Sea.
Carcione (2000b) use Berg and Gangi’s model for computing the material properties of the organic matter (kerogen/oil mixture), and thus the phase velocities and quality factors of the source-rock versus initial kerogen content and excess pore pressure (see Figures 2.2 and 2.3).
Composite model of the source-rock
Following Vernik and Nur (1992), Carcione (2000b) assumed that the immature rock is a two-layer composite made of illite and kerogen, with no additional pore fluid for the immature source-rock. Carcione considers illite transversely isotropic, kerogen isotropic, and both viscoelastic. The Backus averaging gives a transversely isotropic equivalent medium. For the source-rock under maturation the fluid (oil) is assumed to be included in the isotropic kerogen, while the anisotropic illite component remains dry.
Immature source-rock
Kerogen, in the Kimmeridge shale investigated by Vernik (1995), is mostly type II organic matter (e.g., see Vernik, 1994). Therefore, the rock is in an early maturation stage, with no hydrocarbons. Since illite has a lenticular textural pattern, only the stiffnesses “parallel to bedding” are affected. Following Vernik and Nur (1992), Carcione (2000b) modifies the stiffnesses using an equation which incorporate the respective local constants of both illite and kerogen. The modelled phase velocities and anisotropy parameters as a function of kerogen content provides a fairly good fit to the experimental values. The data show that the shale is substantially anisotropic, with positive anisotropy parameters ε and γ, which is characteristic of laminar transversely isotropic composites. Maximum stiffness anisotropy is obtained for a kerogen content of approximately 30 %.
Having calibrated the model with experimental data, it is possible to analyse the anisotropic dissipation characteristics of the source-rock versus kerogen content. The quality factor at 90° corresponding to the horizontally polarised shear wave, is dominated by the illite dissipation, while the (rapidly decreasing) quality factor at 0° is dominated by the kerogen dissipation. Maximum attenuation anisotropy is obtained for a kerogen content of approximately 18 %, compared to the 30 % for stiffness anisotropy. Thus, in the range of the experimental kerogen saturation, attenuation anisotropy can be an important indicator of the presence of kerogen, with shear wave anisotropy γ greater than 2.
From immature to mature source-rock
The different maturation stages of a source rock can be modelled by evaluating the kerogen/oil conversion and the excess pore pressure. Using certain assumptions, a simple equation relating these quantities is obtained. Knowing the fraction of kerogen converted to oil, we can compute the properties of the kerogen/oil mixture by using the model of Kuster and Toksöz (1974), and then the properties of the source-rock as a function of the excess pore pressure. Wave velocities versus excess pore pressure are represented in Figure 2.2, where an initial kerogen content of 35 % has been assumed. The bedding-normal velocities decrease more rapidly than the parallel velocities, implying higher anisotropy parameters with increasing pore pressure. The quality factors, represented in Figure 2.3, show a different behaviour; while Q(0°) decreases for both waves, Q(90°) increases with pore pressure, causing a significant attenuation anisotropy at high pressures.
This study demonstrates that anisotropy of wave velocity and attenuation can be used as indicators for the detection of kerogen-rich shales having different maturation levels. These levels depend on the pressure change due to oil generation in low-permeability source-rocks. The conclusions, for the North Sea Kimmeridge shale, can be summarized as follows:
- In the presence of kerogen-to-oil conversion, excess pore pressure occurs. This process simulates the different maturation levels. At the same value of the conversion factor, the excess pressure is higher in rigid rocks. For instance, for a Kimmeridge shale with 35 % kerogen content, the pore pressure necessary to reach fracture is 48 MPa, with about 28 % of the kerogen converted to oil. At this pressure, the porosity increase is approximately 10 % of the initial porosity.
- The anisotropy parameters increase and the velocities decrease with increasing kerogen-to-oil conversion and excess pore pressure. Normal-bedding quality factors decrease, but parallel quality factors increase slightly with kerogen content
- The polar anisotropy, i.e., variations with respect to the propagation direction, is more pronounced at high pore pressures.
- Increasing kerogen content and pore pressure increases the seismic visibility of the shale. The impedance contrasts calculated with the bedding-normal velocities are more sensitive than those computed with the parallel-bedding velocities.
Extension of this investigation to a more realistic situation considers the presence of water (Carcione, 2000b) and the conversion of oil to gas. Moreover, it is known that pore-volume compressibility increases greatly as the pore pressure approaches the fracture pressure (Zimmerman, 1991). The role of temperature is also important. For instance, there is experimental evidence that the compressional to shear velocity ratio increases with temperature when measured in the direction normal to bedding (Vernik and Nur, 1992).
Overpressure due to oil-gas conversion
In deeply buried oil reservoirs, oil-to-gas cracking may increase the pore pressure to reach or exceed the lithostatic pressure (Chaney, 1950; Barker, 1990; Luo and Vasseur, 1996). Oil can be generated from kerogen-rich source-rocks and flow through a carrier bed to a sandstone reservoir rock. If the reservoir is sealed on all sides by an impermeable shale or limestone, then the condition of a closed system will be satisfied for gas generation. Due to the presence of semi-vertical fault planes and compartmentalization, this condition holds for most North Sea reservoirs.
Berg and Gangi (1999)’s model can be used to calculate the excess pore pressure as a function of the fraction of kerogen converted to oil and the fraction of oil converted to gas. We use an extended version of this model for computing the porosity variations and fluid saturations as a function of the excess pore pressure (Carcione and Gangi, 2000b). Let us assume a reservoir at depth z and the lithostatic pressure for an average sediment density, ρ is equal to pc = ρgz , where g is the acceleration of gravity. On the other hand, the hydrostatic pore pressure is approximately pH = ρwgz , where ρw is the density of water. For a constant sediment burial rate, S, and a constant geothermal gradient, G, the temperature variation of a particular sediment volume is T = T0 + G z, z = St, with a surface temperature at time t = 0. Typical values of G range from 20 to 30 °C/km, while S may range between 0.05 and 0.5 km/m.y. (m.y. = million years). The mass of convertible oil changes with time t at a rate proportional to the mass present. Assuming a first-order kinetic reaction (Luo and Vasseur, 1996; Berg and Gangi, 1999) and a reaction rate following the Arrhenius equation, the oil-to-gas conversion factor F can be obtained as a function of temperature and deposition time (Carcione and Gangi, 2000b).
The excess pore pressure at depth z is Δp = p – pH , where pH is the hydrostatic pore pressure and p is the pore pressure when a fraction F of oil has been converted to gas (F = 0 and p = pi – pH at time ti). Compressional and shear wave velocities depend on effective pressure pe = pc – np, where n is the effective stress coefficient. We assume the following functional form for the pore compressibility cp as a function of effective pressure pe:

that the medium is fully saturated with oil and that, before oil-gas conversion occurs, the initial pressure, pi , is hydrostatic. Balancing mass and volume fractions in the pore-space, yields the relation between the oil-to-gas conversion factor F and the pore pressure p:
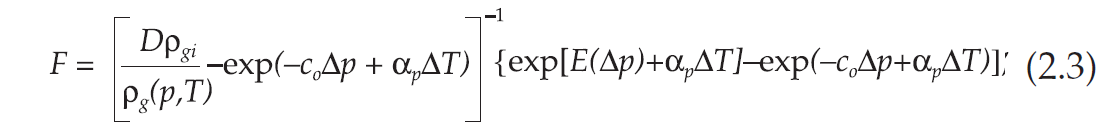
where

In these equations, D = ρ0 / ρgi , where ρ0 is the oil density and ρgi is the initial gas density, obtained from the van Der Waals equation, c0 is the oil compressibility, α0 is the thermal expansion of oil, ΔT is the temperature increase, and αp is the thermal expansion of the pore-space. With a surface temperature of 25 °C a temperature gradient G = 25 °C/km, a sedimentation rate S = 0.08 km/m.y. and a reservoir at zi = z1 = 2 km, we have ti = t1 = 25 m.y. and T1 = 75 °C. After 75 m.y., the depth of burial is z2 = 8 km, t2 =100 m.y. and T2 = 225 °C. On the other hand, if ρ = 2.4 g/cm3, the confining pressure has increased from pc1 = 47 MPa to approximately pc2 = 188 MPa, and the initial pore pressure is pi ≃ 20 MPa (assuming ρw = 1 g/cm3). If no conversion takes place, the final pore pressure would be the hydrostatic pressure at 8 km, i.e., approximately 78 MPa.
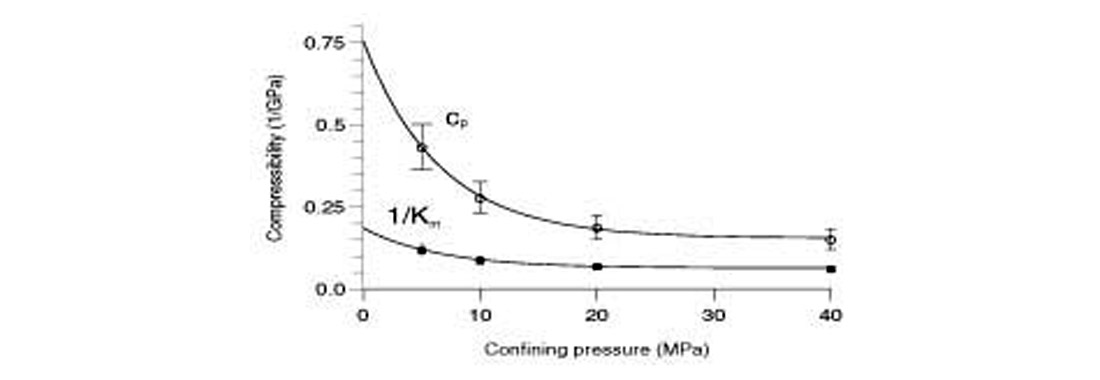
Experimental data for oil-saturated sandstone are available in Winkler (1985, his Figures 3 and 4, and Tables 4 and 7). The experiments on dry samples correspond to zero pore pressure. Best-fit plots of the dry-rock compressibility and shear modulus vs. confining pressure are
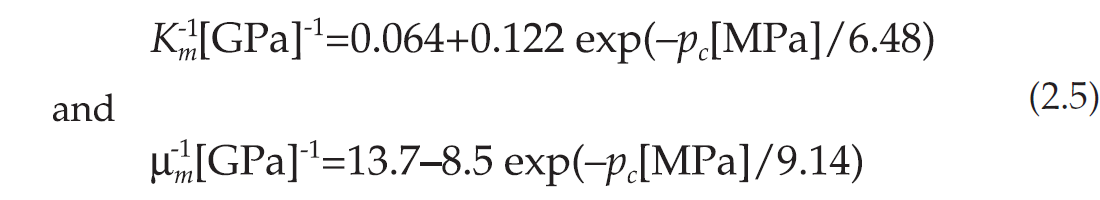
and cp in GPa-1 is given by equation (2.2), with c∞p = 0.155, ß = 0.6 and p* = 6.48. The pore compressibility cp has been obtained from the dry-rock bulk modulus by assuming that the porosity is that at hydrostatic pore pressure [this approximation is supported by experimental data obtained by Domenico (1977) and Han et al. (1986)]. The best-fit plots for cp and K-1m are illustrated in Figure 2.4. In order to obtain the moduli for different combinations of the confining and pore pressures, we should make the substitution pc➝ pe = pc – n(pH + Δp), where we assume, following Gangi and Carlson (1996), that n depends on differential pressure as n = n0 – n1pd , n0 = 1, n1 = 0.014 MPa-1. This dependence of n versus differential pressure is in good agreement with the experimental values corresponding to the compressional velocity obtained by Christensen and Wang (1985) and Prasad and Manghnani (1997).
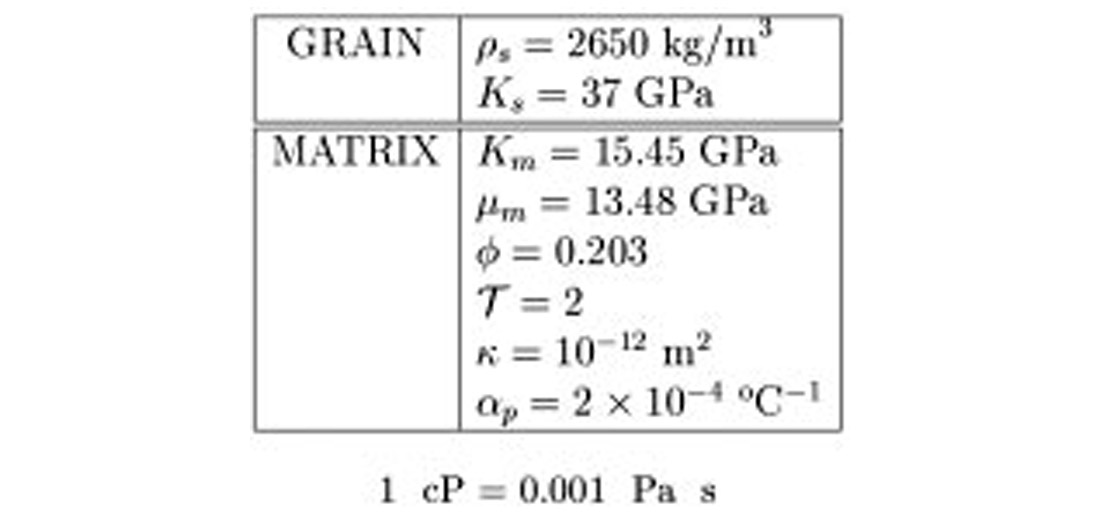
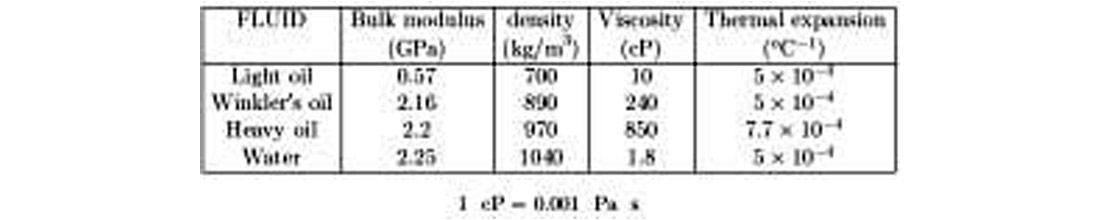
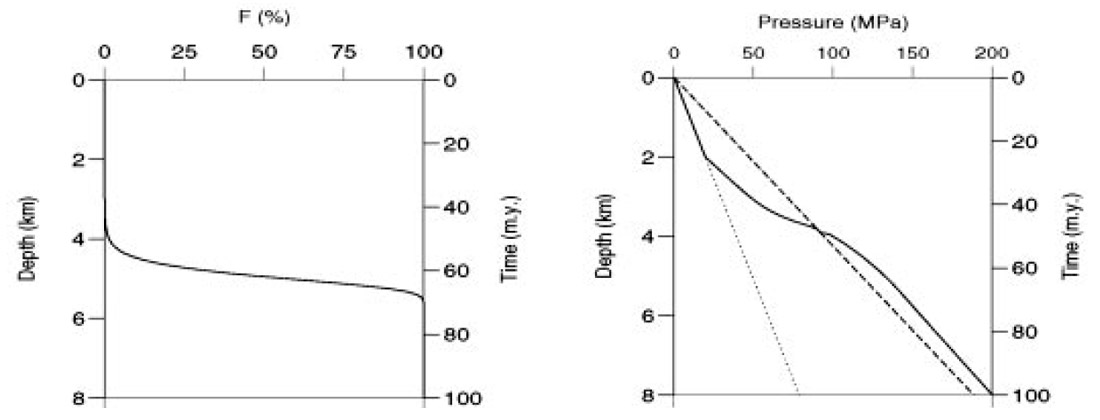
Table 2.1 indicates the properties for Berea sandstone and Table 2.2 the properties of the different fluids, with the values corresponding to the initial (hydrostatic) pore pressure. The oil density and bulk modulus are assumed pressure-independent and equal to the values indicated by Winkler (1985) for 20 MPa. The oil and gas viscosities as a function of temperature and pore pressure are taken from Luo and Vasseur (1996). Figure 2.5 shows the oil/gas conversion factor [equation (2.3)] as a function of depth and time and the pore-pressure buildup with depth. The high activation energy requires either a long time or deep burial, on the order of 4.5 to 5 km, before appreciable fractions of conversion occur, but significant fractional conversions occur at 3 km. The pressure rapidly increases for very small fractions of oil converted to gas. This is due to the low compressibility of the rock. Beyond the lithostatic pressure the effective pressure becomes negative and the pore compressibility increases (see Figure 2.4), making the rock highly compliant. This precludes a rapid increase of the pore pressure, which follows the lithostatic pressure below 4 km depth.
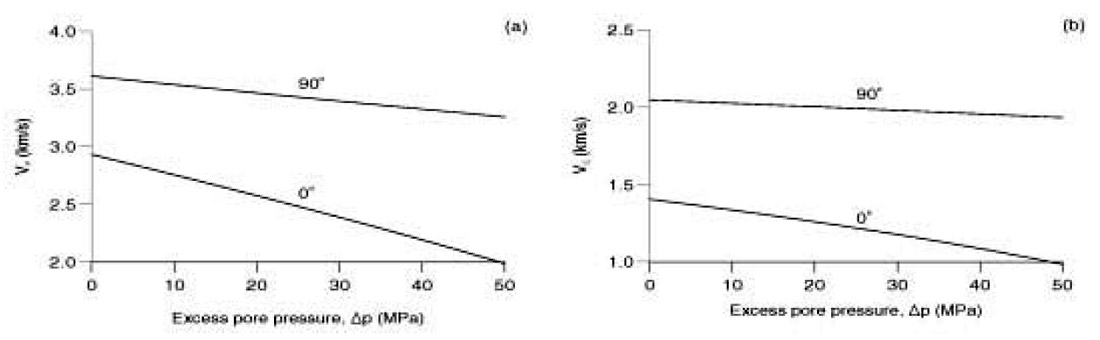
Biot’s theory successfully describes the wave propagation properties of synthetic porous media such as sintered glass beads. In natural porous media such as sandstone, discrepancies between Biot’s theory and measurements are due to complex pore shapes that are not present in simple synthetic media (Gist, 1994). Skeleton-fluid mechanisms are modeled by generalizing the coupling modulus to a time dependent relaxation function, based on the generalized linear solid with L dissipation mechanisms (Carcione, 2001, p. 69). The mixture organics/water behaves as a composite fluid with properties depending on the constants of the constituents and their relative concentrations. The low-frequency wave velocities versus excess pore pressure and differential pressure for this model are shown in Figure 2.6. An excess pore pressure of 50 MPa corresponds to zero differential pressure. The oil/gas conversion starts at a differential pressure of 27.4 MPa, which corresponds to an onset time of approximately 25 million years, when the sandstone is fully saturated with oil. As can be appreciated, the velocities decrease substantially after an excess pore pressure of approximately 35 MPa. This is partially due to the replacement of oil by gas at high oil saturations, but mainly to the decrease in the matrix bulk moduli Km and μm caused by the decrease in effective pressure.
Abnormal pressure due to disequilibrium compaction
The case of non-equilibrium compaction is that in which the sedimentation rate is so rapid that the pore fluids do not have a chance to ‘escape’. We assume that the pore-space is filled with organic material and water, that the compressibilities of the organics and water are independent of pressure and temperature, and that of the rock is independent of temperature but depends on pressure. At time ti, corresponding to depth zi, with initial hydrostatic fluid pressure pi = ρwgzi , the volume of rock behaves as a closed system. That is, if the unit is a shale, its permeability is extremely low, and if the unit is a sandstone, the permeability of the sealing faults is sufficiently low so that the rate of pressure increase greatly exceeds the dissipation of pressure by flow. Pore pressure excess is measured relative to hydrostatic pressure. Then, it can be shown that balancing mass and volume fractions in the pore-space yields

where Swi is the initial water saturation, cw is water compressibility, αw is water thermal expansion and E(Δp) is given by equation (2.4). The solution of equation (2.6) gives the pore pressure p = Δp + pi as a function of depth and deposition time, with ΔT = T – Ti = GS(t – ti), for a constant geothermal gradient and a constant sediment burial rate. Table 2.1 indicates the properties of dry Berea sandstone, where the values correspond to those at the initial (hydrostatic) pore pressure. The pore-fluid properties are given in Table 2.2.
The pore-pressure buildup with depth for different pore fluids is shown in Figure 2.7, where the continuous lines represent the hydrostatic and lithostatic pressures. The dotted line corresponds to full light-oil saturation, and the broken lines to full Winkler’s oil saturation (label 1), partial saturation (Swi = 0.5 and heavy oil) (label 2), and full heavy-oil saturation (label 3). As can be appreciated, the rock is underpressured for full light-oil saturation and increasing pore-fluid bulk modulus gives overpressure. For low compressibilities and high thermal expansion coefficients of the pore fluid, the pore pressure may exceed the lithostatic pressure. In the case of heavy oil, the cause is the high thermal expansion coefficient.
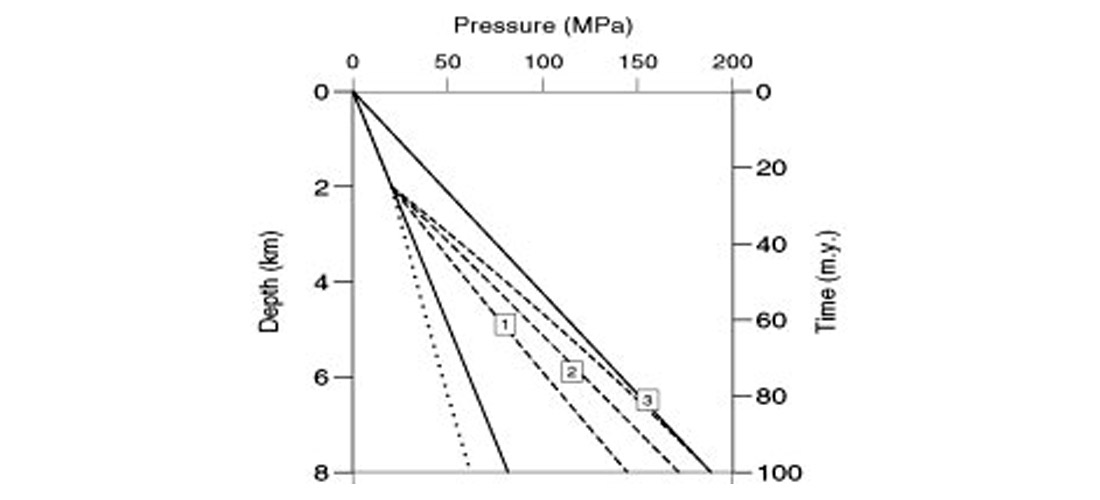
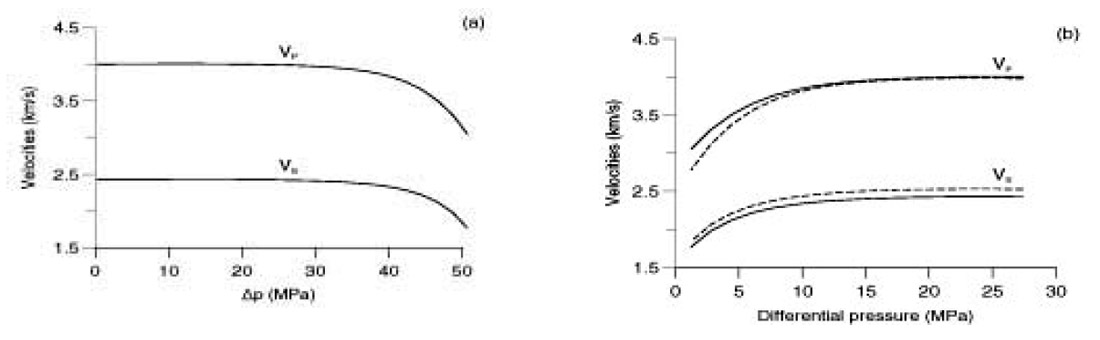
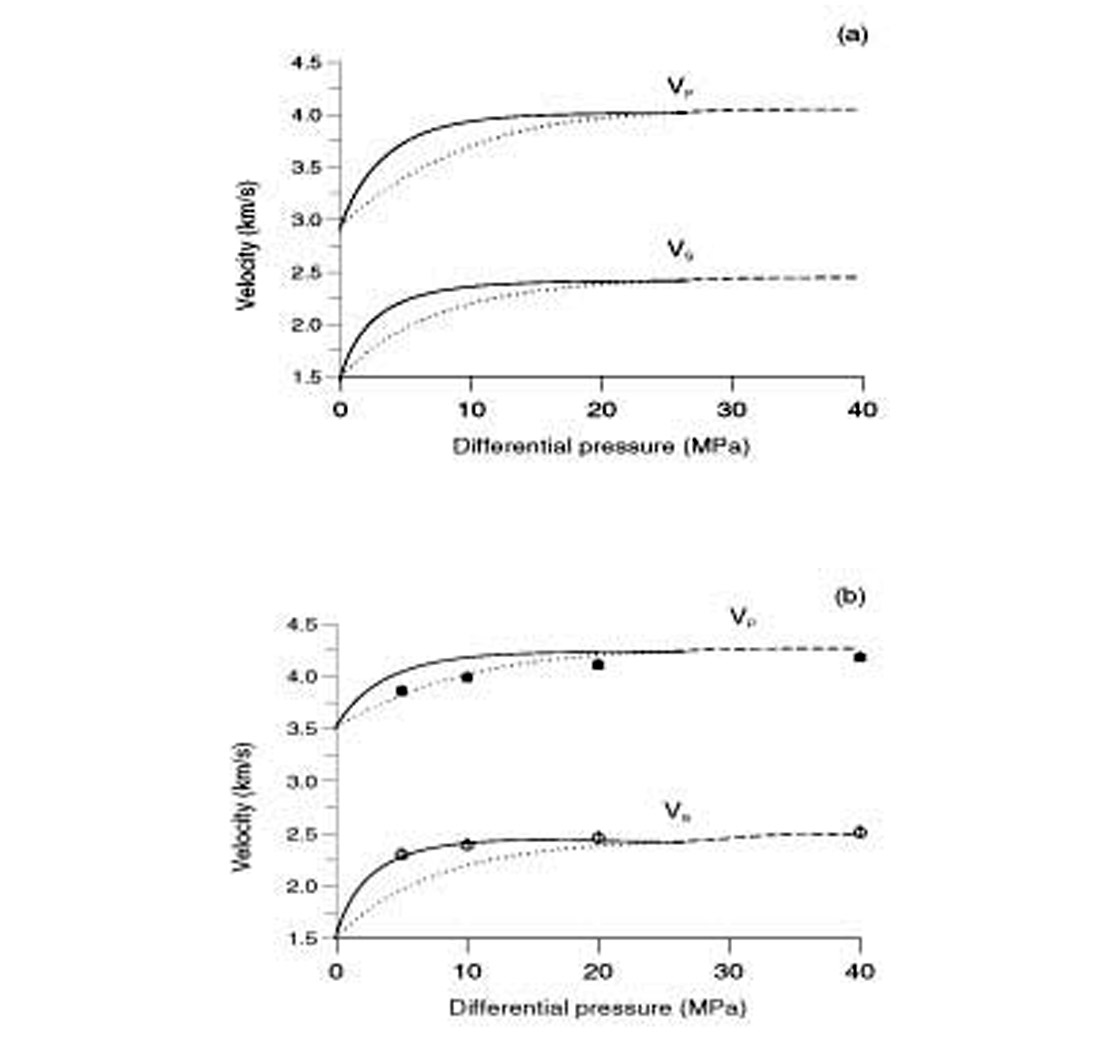
Figure 2.8 shows (a) the low-frequency (25 Hz) and (b) the ultrasonic (1 MHz) compressional and shear velocities versus differential pressure pd for heavy oil (continuous line) and Winkler’s oil (broken and dashed lines). The dotted line corresponds to the range 0 to 2 km, where the rock is normally pressured (see Figure 2.7); the black squares and empty circles are the experimental compressional and shear velocities obtained by Winkler (1985) for oil-saturated Berea sandstone. We use a continuous spectrum of dissipation mechanisms for the Biot’s coupling modulus, from 1 Hz to 1 MHz, regardless of the saturations. The pore-fluid affects mainly the compressional velocity, with unrelaxed velocities (1 MHz) higher than relaxed velocities (25Hz), as expected. The decrease in wave velocity at low differential pressures is due to the unconsolidation effect, implicitly contained in equations (2.5). From 2 to 8 km (continuous lines) the cause is overpressuring, and from 0 to 2 km (dotted lines) the cause is the pore pressure approaching the confining pressure at very shallow depths, since in this case the rock is normally pressured. At deep depths, the wave velocities decrease substantially when the pore pressure approaches the confining pressure, as it is the case for full heavy-oil saturation.
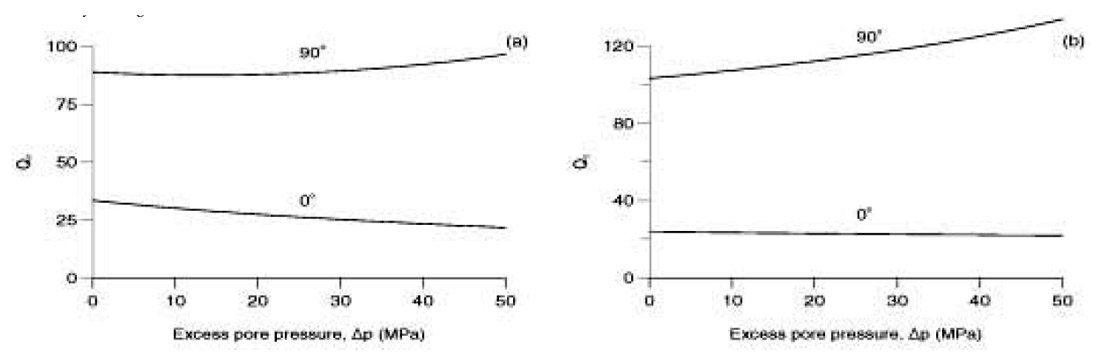
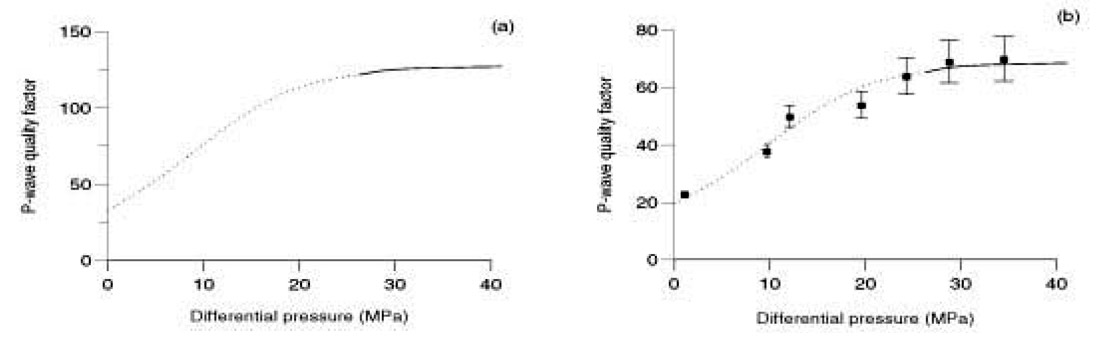
The seismic (a) and ultrasonic (b) P-wave quality factors versus differential pressure for water-saturated Berea sandstone (Swi = 1) are represented in Figure 2.9, where the black squares are the experimental values (parallel to the bedding plane) obtained by Prasad and Manghnani (1997). The low-frequency curve is obtained under the assumption of a constant quality factor from the seismic to the ultrasonic band. As before, the dotted line corresponds to the range 0 to 2 km, where the rock is normally pressured, and the continuous lines to the range 2 to 8 km, where the rock is overpressured. As wave velocities, the quality factor is not sensitive to overpressure when the pore fluid is water or Winkler’s oil. Overpressure implies low quality factors and therefore high wave dissipation. Quality factor can be a good indicator of excess pressure provided that reliable estimates can be obtained at seismic frequencies.
Non-equilibrium compaction generates abnormal fluid pressures that, under certain conditions, can be detected with seismic methods. This is very important in drilling applications. The results for a model in which a reservoir volume is buried at a constant sedimentation rate for a geothermal gradient, which is both constant in time and depth, show that wave velocities and quality factors decrease with decreasing differential pressure (or effective pressure). The large change is mainly due to the fact that the dry-rock moduli are functions of the effective pressure, with the largest changes occurring at low differential pressures. For a given pore-space compressibility, the fluid mixture filling the pore-space has a major influence on P-wave velocity and may cause underpressure or overpressure depending on its compressibility and thermal expansion coefficient. Rocks saturated with fluids of high compressibility and low thermal expansion coefficient are generally underpressured, and rocks saturated with fluids of low compressibility and high thermal expansion coefficient are generally overpressured, and can be seismically “visible”. At high differential pressures the velocities are almost constant. Perceptible changes in the velocities occur when the differential pressure decrease to 20 MPa and become significant when the differential pressure decreases to about 15 MPa. The quality factor curve for full water saturation calculated with the present model is in good agreement with experimental values obtained at the ultrasonic frequency band. The model is able to predict pore pressure from seismic properties if reliable estimates of wave velocities and quality factor can be obtained.
3. Poro-viscoelastic representation of shaley sandstones
Modeling the acoustic properties of shaley sandstones of (VP , VS versus porosity, clay content and frequency) is achieved in the framework of Biot’s theory of poro-elasticity. For clay/sand mixtures, such an approach requires the consideration of a medium consisting of three phases: sand, clay, and fluid. A three-phase Biot-type theory was developed by Leclaire et al. (1994) for frozen porous media. This three-phase theory assumes that there is no direct contact between sand grain and ice, implying the existence of the water layer around the grains, isolating them from the ice. The model, which predicts three compressional waves and two shear waves, has recently been applied, with some minor modifications, to modeling the acoustic properties of permafrost (Carcione and Seriani, 2001) and gas hydrates (Carcione and Tinivella, 2000).
Carcione et al. (2000) replaced ice with clay and included the terms responsible for the interaction between the sand grains (pure quartz grain) and the clay particles in the potential and kinetic energies. Lagrange’s equations provide the differential equations of motion. A plane-wave analysis gives the wave velocities and attenuation factors of the different modes. The bulk and shear moduli of the sand and clay matrices versus porosity are obtained from a relationship proposed by Krief et al. (1990). This relationship introduces two empirical parameters that can be obtained by calibrating the model with real data. An additional parameter provides one more degree of freedom for adjusting the velocity-porosity curves (at constant clay content) to the data.
The model for shaley sandstones provided by Carcione et al. (2000) is somewhat similar to that recently proposed by Goldberg and Gurevich (1998). An important difference, however, is associated with the three-phase approach. Indeed, Goldberg and Gurevich (1998) assumed that the medium is composed of only two phases, solid and fluid. The solid matrix, in turn, is a composite material, made of sand grains and clay particles. The elastic moduli of the solid/fluid mixture were derived using Gassmann’s equation. However, the latter is valid only when the solid matrix is homogeneous (Brown and Korringa, 1975). This implies that the sand and clay particles are mixed homogeneously and forming in effect composite grains, which in turn form the rock matrix. The three-phase approach is free of such assumption, but it also implies a particular topological configuration, namely the one where sand and clay form two continuous and interpenetrating solid matrices.
We consider the model of Krief et al. (1990) to obtain estimates of the dry-rock moduli Ksm, μsm (sand matrix), Kcm, μcm(clay matrix) versus porosity and clay content. The porosity dependency of the sand and clay matrices should be consistent with the concept of critical porosity, since the moduli should vanish above a certain value of the porosity (usually from 0.4 to 0.5). The theory predicts three compressional waves and two shear waves.
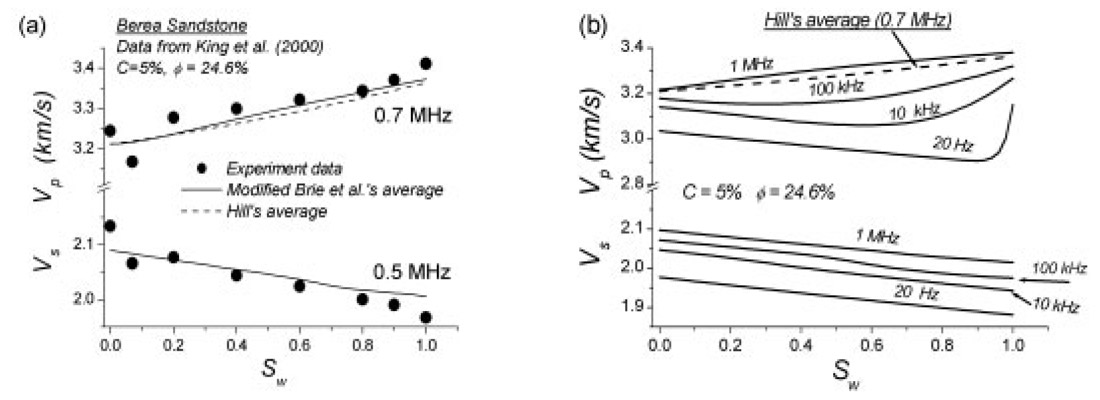
Due to complexity of natural rocks and its pore-fill, Biot’s theory alone is not sufficient for modeling porous media. Several effects should be added and taken into considerations such as the viscodynamic effect, viscoelasticity, pressure effects, and partial saturation (Pham et al., 2002). Figures 3.1a,b compare the P- and S-wave velocities predicted with experimental data obtained by King et al. (2000). In (b), the velocities are represented for several frequencies, from the seismic to the ultrasonic band. Also shown is the P-wave velocity obtained by using Hill’s equation (Mavko et al., 1998, p. 115). We average the reciprocal of the P-wave modulus (ρV2p ) in the absence of attenuation. The use of the modified Brie et al.’s model (Pham et al., 2002)., though empirical, allows us to model the acoustic properties of the sandstone in the whole frequency range.
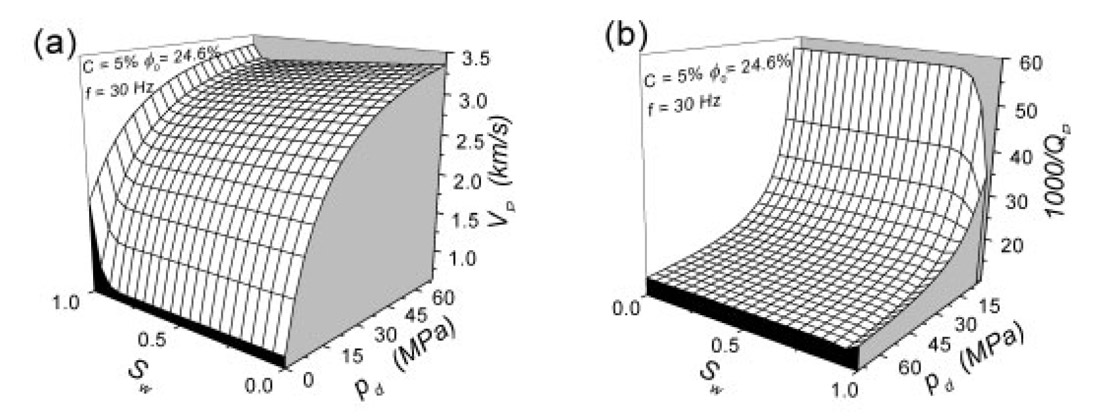
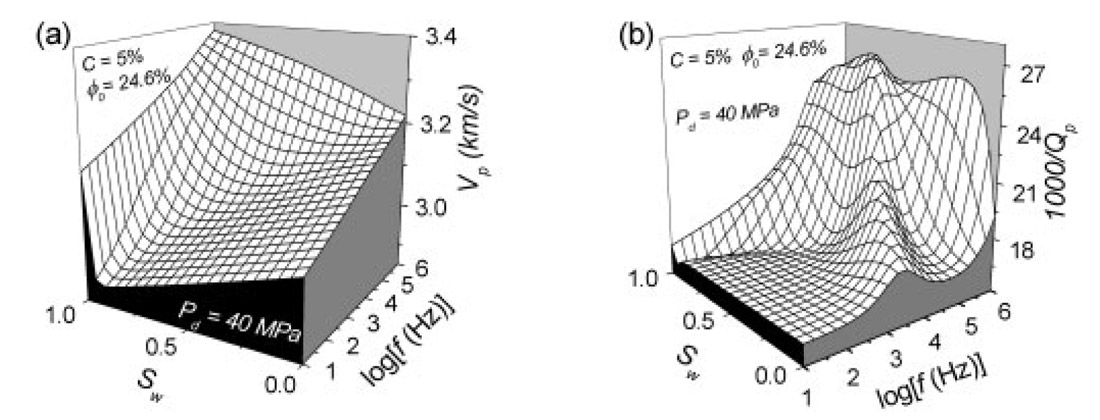
Three-dimensional plots of the P-wave velocity (a) and dissipation factor (b) versus differential pressure — confining pressure minus pore pressure — and water saturation are displayed in Figure 3.2. The clay content is 5 % and the frequency is 30 Hz. Note the strong decrease of the velocity and Q factor with decreasing differential pressure This effect is mainly due to the fact that the dry-rock moduli are sensitive functions of the effective pressure. (At very low effective pressures, the rock becomes unconsolidated.) Figure 3.3 shows the same properties as in Figure 3.2, but versus water saturation and frequency. In this case, the differential pressure is 40 MPa (pc = 70 MPa and p = 30 MPa), and we assume that the temperature is 90 °C in van der Waal’s equation (Carcione and Gangi, 2000b), corresponding to a reservoir at 3 km depth. Figure 3.3b agrees qualitatively with a similar plot — based on experimental data of Massilon sandstone —published by Murphy (1982). The dissipation factor has a maximum value at the Biot relaxation peak, ranging from sonic frequencies for gas (Sw = 0) to ultrasonic frequencies for water saturated rock with a peak value around Sw = 0.8. The latter behaviour agrees with experimental data published by Yin et al. (1992).
Article is continuted with Rock Physics of Geopressure and Prediction of Abnormal Pore Fluid Pressures Using Seismic Data (Part 2).

Acknowledgements
The European Union under the project “Detection of overpressure zones by seismic and well data” has supported a substantial part of this work.


Join the Conversation
Interested in starting, or contributing to a conversation about an article or issue of the RECORDER? Join our CSEG LinkedIn Group.
Share This Article