Introduction
The Experimental Geophysics Group (EGG) carries out a wide variety of field and laboratory studies. These studies focus on understanding what controls the physical properties of rocks and how these relate to geophysical surface observations. Here, we hope to give some overview of the laboratory facilities that EGG has developed over the years for characterizing porous rock samples and for making ultrasonic P and S wave measurements for both conventional rock property evaluation and for more fundamental studies of wave propagation in porous and anisotropic media. This leads to a summary of some of the recent laboratory results obtained.
The motivations for much of this research vary and often it is in support of our research activities in scientific drilling, geomechanics, and stress determination. One portion of our work focuses on conventional laboratory rock property measurements, in these we gain knowledge of the properties of the rock under conditions of pressure, temperature, and saturation expected in situ. The results in such cases provide constraints on geophysical observations, such as providing the difficult-to-obtain dry or drained bulk modulus necessary for Gassmann fluid substitution calculations. The second portion concentrates on measurements that allow us to better understand how waves propagate through complex materials. This work is of a more fundamental nature and it seeks to better constrain our interpretations of geophysical data.
Experimental Facilities
Measurements under In Situ Conditions: Rock is a notoriously complex material. One aspect of this is that the P and S wave speeds are highly dependent on in situ conditions, and in particular, the velocities of nearly all rocks depend on the effective pressure they are subject to. As such, making a measurement of a rock property at atmospheric pressure will mislead an interpretation of field data if it is assumed this is representative of the same property at depth in the earth. Consequently, the measurements must usually be made on rocks subject to confining and pore pressures. This significantly complicates carrying out such tests as now one must adequately seal a rock sample to protect it from the fluid transmitting confining pressure. Further, one must be able to send and receive signals from the sensors inside the pressure vessel to the data acquisition systems outside.
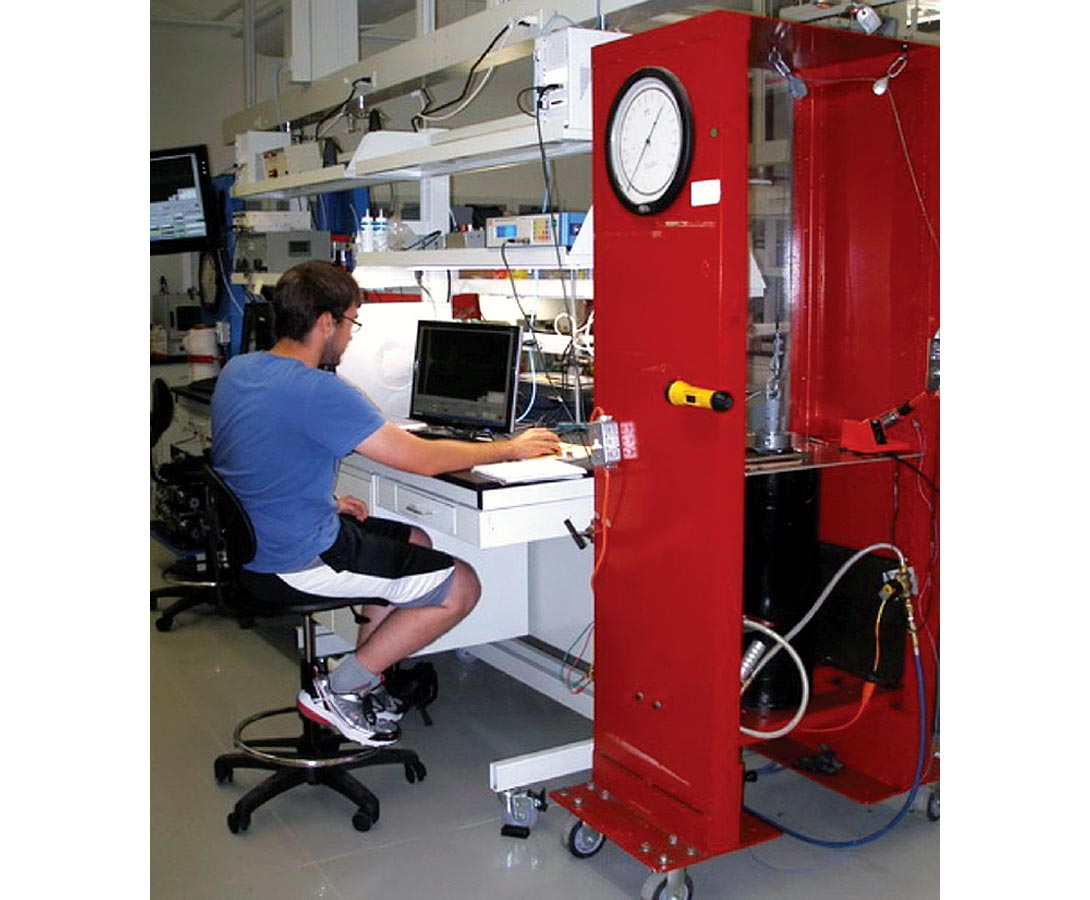
To carry out such experiments, EGG has constructed two main pressure vessel systems here informally called Blue and Red. In part for reasons of safety, these vessels are capable of reaching relatively high confining pressures of 300 MPa (~45,000 psi or about 12km depth) and 200 MPa (~30,000 psi about 8 km depth), respectively. Red (Fig. 1) is most often used on smaller diameter (~2.54 cm) cylindrical plug samples in simpler cases that do not require the sample to contain pore fluids. The high confining pressure that can be achieved is much greater than necessary for most sedimentary rock studies (< 50 MPa), but has been used on studies of the anisotropy of metamorphic and igneous rock whose elastic properties are strongly controlled by microcracks. Such high pressures are necessary to close most of the microcracks in order to obtain values representative of the intrinsic pore-free material.
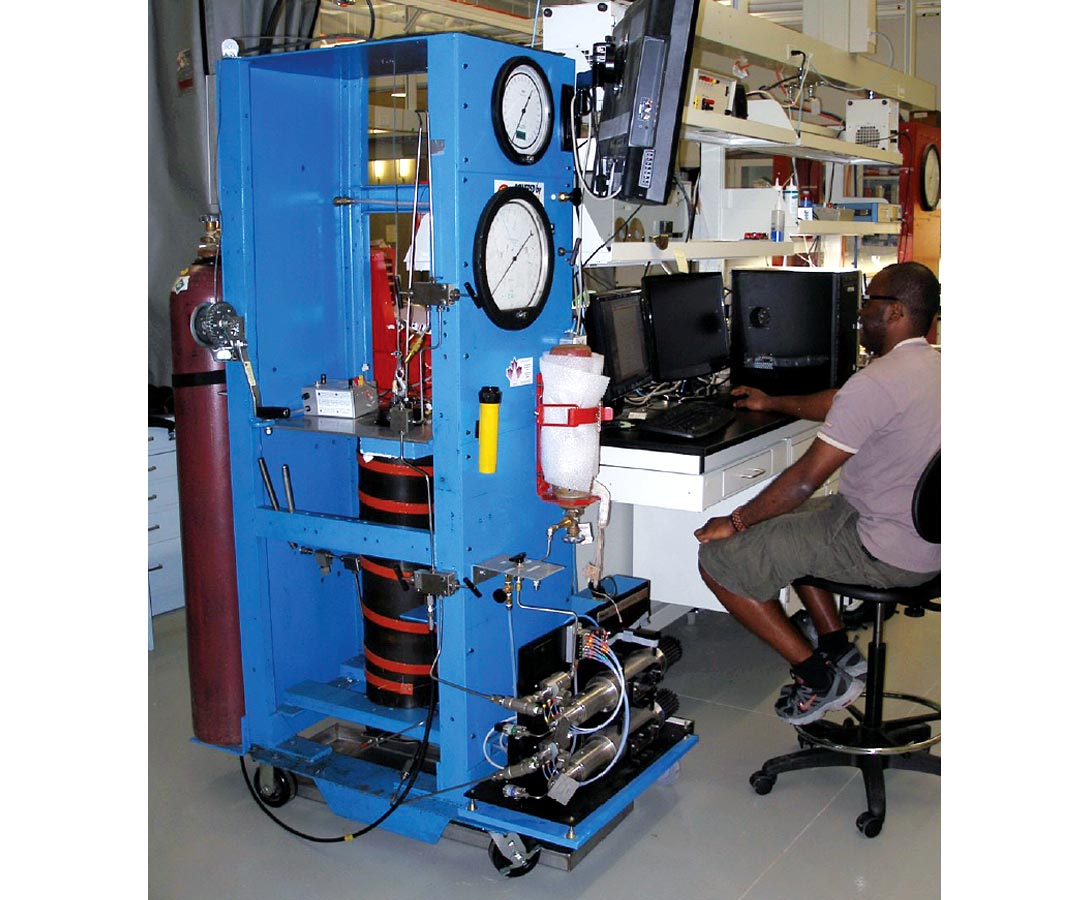
Blue (Fig. 2) is substantially more complicated as it allows for independent controls on pore fluid pressure, confining pressure, and temperature. This machine is currently extremely busy in rock physics studies related to CO2 sequestration and recently completed an extensive study of carbonates from the Arab D formation [Bakhorji, 2009]. The vessel can accommodate samples with diameters nearly up to 10 cm; and this added real estate allows for additional experimental flexibility. Pore pressures are varied and maintained by a Quizix™ dual-cylinder pumping system. Temperatures up to ~100C are varied using a ribbon heater wrapped around the pressure vessel. The entire control and acquisition system is operated by a specially written Labview™ program.
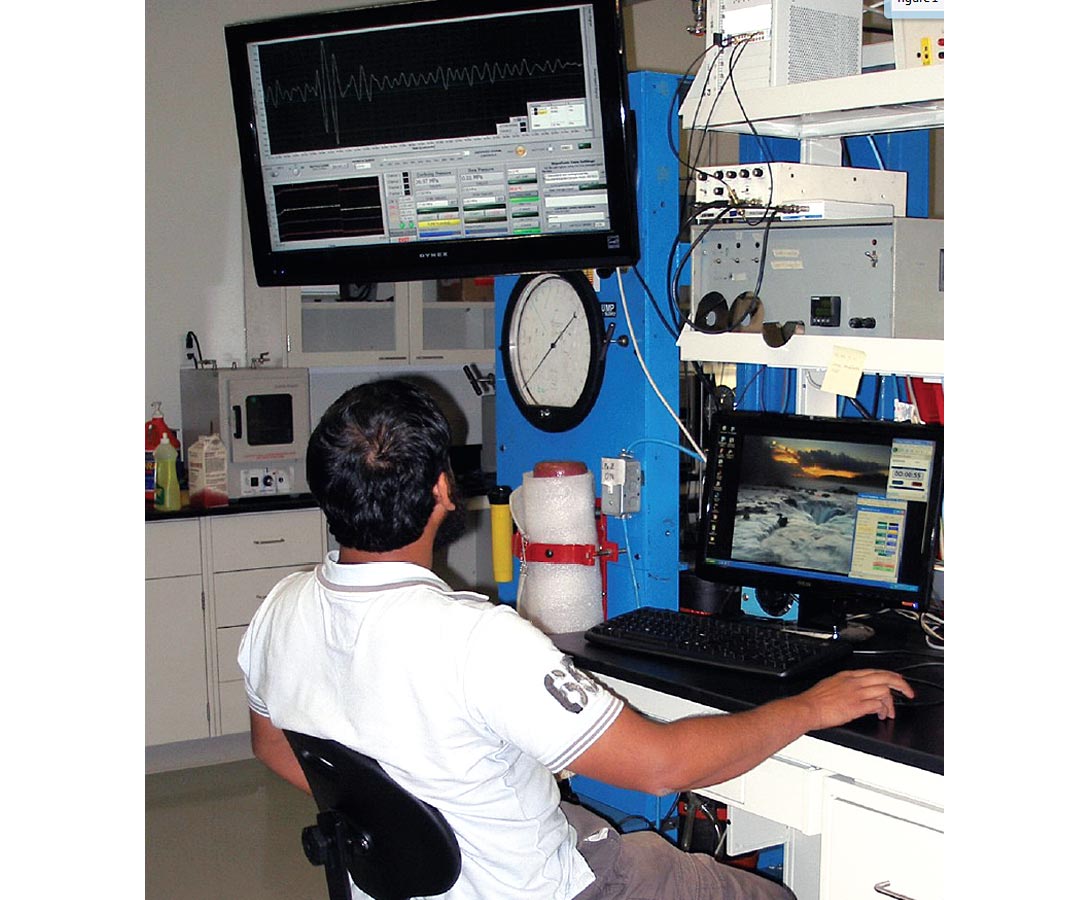
Our current data acquisition systems are based on racked modules that include high resolution loggers (to continuously record pressures, temperatures, and strain) as well as a 12-bit high speed digital oscilloscope for acquiring the ultrasonic waveforms (typically sampling at rates ~10 ns/sample). This information is all displayed on a large screen from which the experiment can be monitored (Fig. 3), all of the acquisition takes place using the same specialized Labview program that control the sample conditions.
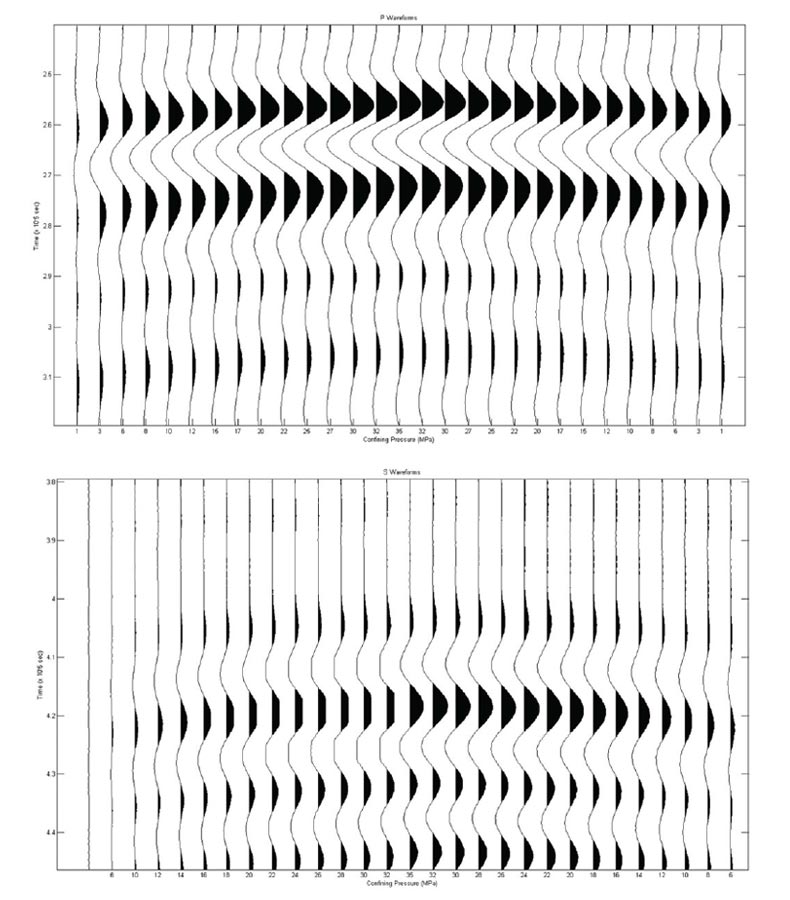
Ultrasonic Transducers: EGG has developed considerable experience in the construction of differing kinds of ultrasonic transducers from piezo-electric ceramics. This allows for a great deal of flexibility in the design of measurements, which would not be possible using commercially available sensors. Our current generation of ‘time-offlight’ transducers allows for the simultaneous recording of P and S waveforms (see Fig. 4), and we are currently working on a further stacked system that will have a second S wave ceramic in order to simplify measurements of elastic wave anisotropy (where two split shear waves need to be measured[Njiekak et al., 2011]. We are also working on ‘hardening’ our transducers so that they can survive longer the severe conditions of pressure they experience while in the pressure vessel.
Technical concerns of sealing a sample for pressure and routing information into and out of the pressure vessel aside, an ultrasonic velocity measurement is otherwise conceptually a simple affair. In most applications, a cylindrical rock sample is first cored and its ends are ground to be as parallel and flat as possible. The cylinder is then pushed into a flexible tube that is necessary to exclude the confining pressure oil from the rock’s pore space. Two dual P-S wave transducers are then mounted on either end of the cylinder taking care to ensure the S-wave particle polarizations are aligned together. In this configuration, one transducer assembly transmits while the other receives. The transmitter is activated, crudely, by applying a fast-rising high voltage step to the piezo-electric ceramic producing a mechanical disturbance. This disturbance propagates as an elastic wave through the transducer assembly buffers and the sample to be detected by the receiver that transduces it back to a voltage that is recorded by the high speed digitizer to produce the waveform. The wave velocity is obtained by dividing the sample length (sometimes corrected using strain) by the wave transit time (corrected for the transducer delay) as picked from the observed waveform.
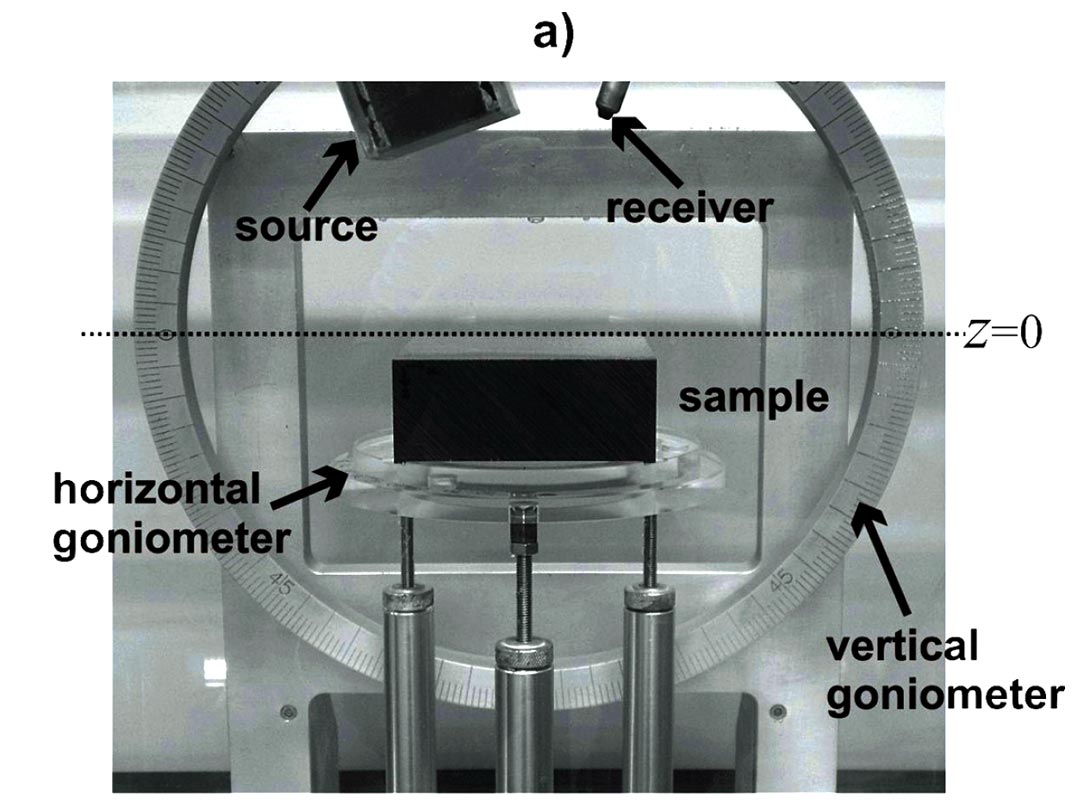
Reflectivity Experiments: Our ultrasonic goniometer is a unique system for carrying out fundamental studies of wave reflectivity (Fig. 5). This essentially consists of a large aperture transmitter and a small near-point receiver both aligned to the reflection point on the surface of a block of the material under study. This combination differs from all other similar reflectivity systems that employ two identical transducers. The advantage of our system is that the large transmitter mimics to a degree (although not perfectly) a plane wave and it also transmits a large energy acoustic pulse. In other systems, the effects of transducer diffraction must be considered for both the transmitter and the receiver and the subsequent corrections required add additional error to the measurements. The goniometer can also be configured for material transmission tests.
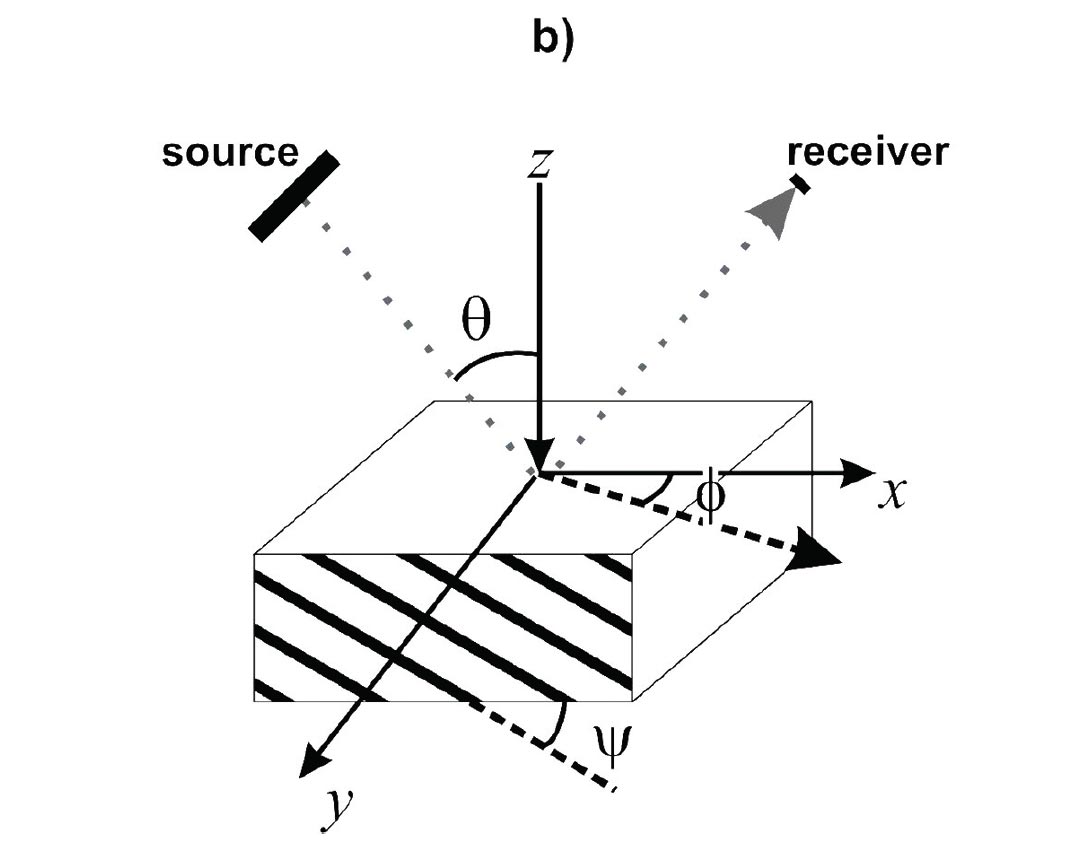
Dielectric Properties: A collaboration with the Potash Corporation of Saskatchewan has allowed us access to an advanced instrument (Agilent™ E4991A) radio frequency (10 MHz to 3 GHz) impedance/material analyzer (Fig. 6a). This instrument allows one to measure the dielectric properties of materials over the frequencies typically used in ground penetrating radar (GPR). Briefly, for low loss materials, the relative dielectric permittivity κ relates to the speed of an electromagnetic wave ν through

Knowledge of κ allows calculation of the reflection co-efficient R from the interface between two materials of differing κ1 and κ2 using the Fresnel equations that at normal incidence reduce to

This is being used to study GPR wave speed dispersion and attenuation in the potash and surrounding formations, this is primarily done as an aid to mine development and safety as well as providing a better understanding of clay containing materials [Aqil and Schmitt, 2009].
Material Characterization: In many rock physics studies in the literature, the materials under study are often poorly characterized; and this limits the ultimate utility of the work. As such, obtaining as much information about the material’s composition and structure has been a priority in most of our projects, and a number of differing techniques are employed to obtain such information. The Rock Physics Laboratory operates the following pieces of equipment:
Helium Pyncnometer: This device uses Boyle’s Law for the expansion of He gas to accurately determine the volume of the solid (mineral) portion Vm of a given rock sample or a powder. Since the corresponding mass of the sample is easily measured, the pyncnometer (Quantachrome™ Multipyncnometer) (Fig. 6a) most directly provides a measure of the sample’s ‘grain density’ ρg; and as such it can provide constraints on the mineralogical composition. Further, if knowledge of the bulk density ρb or the ‘envelope’ volume Ve is available then this information can be used to calculate the porosity via:

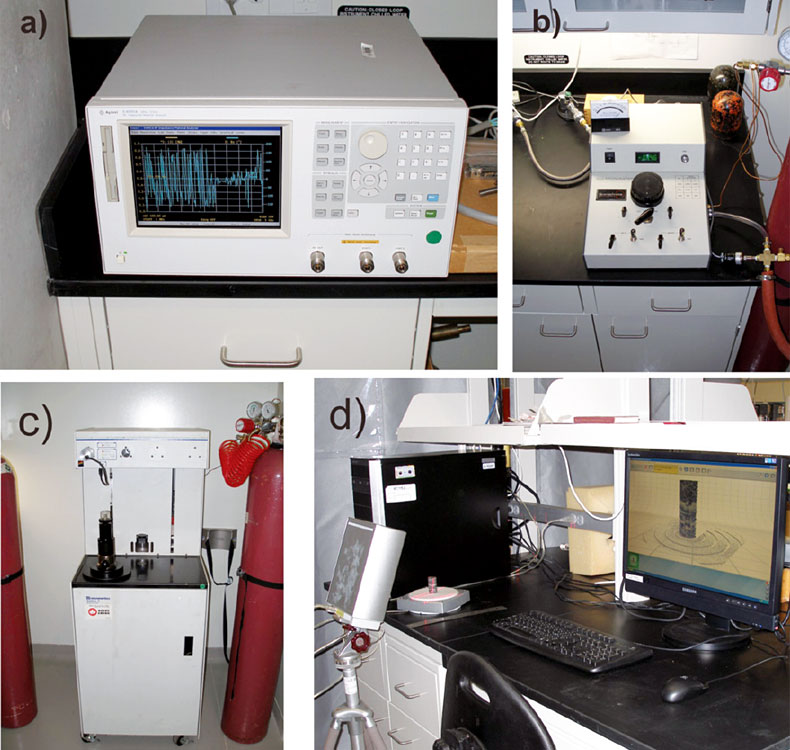
Mercury Injection Porosimetry: This is a substantially more sophisticated device (Micromeritics AutoPore IV) Fig. 6b that measures the sample’s porosity but also gives a wealth of additional data on the structure of the porosity, and most particularly some idea of the distribution of the pore dimensions (or more strictly the pore throat dimensions). Petroleum engineers refer to this data as capillary pressure curves. Although the operation of this instrument is beyond the space necessary here, the basic concept relies on the nonwetting properties of liquid Hg. Unlike most other fluids such as water that will be sucked by capillary forces into the rock, pressure must be applied to Hg to force it to enter the rock’s pores. The higher the applied pressure the smaller the pore throat the Hg will breach according; and therefore carefully monitoring the Hg pressure and the volume injected allows for constraint on the proportions of the porosity at different scales. An example of one porosimetry curve is shown in Fig. 7d.
3D Scanner: Porosity φ is defined simply as the ratio of the pore volume Vφ to the envelope volume Ve. While this is a rather trivial relation, actually determining Ve in reality can be quite challenging particularly if the sample dimensions are irregular. We are currently experimenting with a benchtop 3D laser scanning system that essentially maps the outer surface of the sample in 3D. Once this is obtained one can directly determine the sample’s envelope volume. As well, the 3D scanner provides an interesting image of the sample for presentation purposes.
The laboratory also makes use of additional geological characterization tools available elsewhere on campus for making geological thin sections, (Figure 7b) carrying out X-ray diffraction mineral identification, scanning electron microscopy (SEM) (Figure 7c), and 3D micro-CT x-ray imaging (see Figure 7e). If necessary, full X-ray CT scanning of cores can be carried out at the Edmonton facilities of Alberta Innovates – Technology Futures. Full chemical analysis using XRF techniques are usually sent out to commercial providers.
Some Current Measurement Programs
CO2 Sequestration: As noted above, ‘Blue’ has been configured to make measurements on CO2 saturated rock samples. These are particularly interesting as the physical properties of CO2 itself varies substantially over the range of relatively modest pressures and temperatures that are expected to be encountered during sequestration. Indeed, depending on the temperature gradients in an area, one might expect to encounter CO2 as either a gas, a liquid, or a supercritical fluid within the uppermost km of the earth’s crust. The density and bulk modulus (and hence sound speed) of CO2 will consequently vary dramatically and this influences the seismic properties of the material [Yam and Schmitt, 2011]. An example (Fig. 8) of the variation in P and S wave velocity with pore pressure as measured at two temperatures of 28°C and 40°C, where CO2 gas transforms to either a liquid or a supercritical fluid, respectively, illustrates the differences that can be observed. It is interesting to note that the gas-liquid phase transformation is abrupt but that from gas-supercritical fluid is much more gradual; and the latter phase transformation will likely be difficult to detect with seismic monitoring.
Anisotropy: In sedimentary basins seismic anisotropy is produced at many scales be it from preferred mineralogical alignment or layering. While anisotropy appears to be nearly ubiquitous, there is actually very little hard data with regards to anisotropy in the earth or in core samples. Core scale anisotropy is interesting as it might provide useful attributes as to the rock structure and composition. This scale is also important as it must also affect the overall anisotropy of a formation. Three different studies of anisotropy are currently underway:
Shales: In part, the vigorous interest in unconventional resources is stimulating our work in the measurement of the anisotropy of ‘shales’. Building on previous measurements carried [Hemsing and Schmitt, 2006; Wong et al., 2008] we are measuring the elastic anisotropy of a series of ‘shales’ from the Western Canadian Sedimentary Basin. Under the assumption that the material is transversely isotropic, three plugs are cut at directions perpendicular, parallel, and oblique to the material’s layering (for sediments). The Pwave and the two orthogonal S-wave velocities are then measured as a function of confining pressure. An example of a relatively anisotropic Mannville shale from southern Alberta (Fig.9a) displays P- and S-wave anisotropies of δ ~ 0.08 and γ = 0.12, respectively, with ε = 0.175±0.02.
Metamorphic Schists: This work is motivated by the need to understand the off-axis anisotropy of a thick schist section as measured in a deep borehole [Schijns, 2009; Schijns et al., 2011] drilled into the Fennoscandian shield near the Outokumpu, Finland mining district. In this configuration, small P- and S-wave piezoelectric ceramics [after Mah and Schmitt, 2001] are mounted directly and at strategic positions relative to the foliation plane and lineation direction on the surface of cylinders of the schist.
Reflectivity from an anisotropic material: The use of AVO methods to look for fracture orientations has taken off in recent years. However, these method almost always assume a set of vertically oriented parallel fractures that results in the very specific geometry with a horizontal transversely isotropic (HTI) symmetry. In the real earth, however, fracture and joint systems are not so constrained by theoretical simplifications; and consequently it is interesting to examine the amplitude versus angle of incidence and azimuth (AVAAz) response of such formations. Figure 9a shows a set of reflectivity curves obtained from a nearly TI medium tilted at 45° with respect to the horizontal [Ortiz-Osornio and Schmitt, 2011] It is interesting to note that the responses show the most variation only past the P-wave critical angle.
Future Directions
With regards to the materials studied, a good deal of the work in the immediate future will likely focus on continued studies of CO2 saturation on the seismic properties of rocks. We have completed a large study of carbonates associated with the Weyburn CO2 project under various temperatures and pressures. We are currently working on sandstone materials for Carbon Management Canada with the eventual goal of developing seismic models for purposes of time lapse monitoring. We will be broadening this work to better understand the physical properties of CO2 saturated brines themselves and carry this into the rock samples. The system and experimental protocols we have set up to carry out the CO2 studies is somewhat unique and has attracted interest from additional collaborators; so CO2 studies will likely continue for some time.
Beginning with Bakhorji [2009] leading from the much earlier work of Schmitt and Li [1995] we have also begun including pseudo-static strain measurements simultaneously to the dynamic ultrasonic velocity measurements. The strains versus pressure plots yield the static bulk moduli which is useful geomechanical information. This will further be supplemented by strength determinations that are necessary in the design of fracture operations. [Melendez and Schmitt, 2011]
Of most interest, however, is our work towards the construction of an instrument to measure the moduli of rocks at seismic frequencies. Currently, we are working in collaboration with the Australian National University (Canberra) to study the effects of fluid saturation in cracked rocks. High frequency measurements are made in the Rock Physics Laboratory while low-frequency forced-oscillation tests are carried out at ANU on the same quartzite rock samples. We are currently designing a new system to measure the seismic band bulk moduli of the material directly.

Acknowledgements
The laboratory was put together using grants from a variety of sources but most crucially by NSERC through equipment grants and, in earlier times, the Alberta Oil Sands Technology and Research Authority. The most recent support of the Potash Corporation of Saskatchewan for the purchase of the dielectric material analyzer has been most appreciated. Similarly, most of our high pressure systems have been build from scratch as we were fortunate to be able to scavenge vessels, expensive pressure gauges, and costly high pressure fittings from a variety the labs of retired professors in condensed matter physics. In such a case, access to skilled technicians and machinists has been key and none of this work would have been possible without the past assistance of L. Tober, J. Haverstock, G. Lachat and current support from L. Duerksen, P. Zimmerman, T. Paget, and T. Walford.


Join the Conversation
Interested in starting, or contributing to a conversation about an article or issue of the RECORDER? Join our CSEG LinkedIn Group.
Share This Article