Abstract
Initial drilling and Time Domain Electro-Magnetic (TDEM) geophysical surveying (Geonics EM-47) indicated the presence of a sandy buried channel below till in Western Canada. Additional geophysical surveys used both resistivity measurements and seismic visualization techniques to explore the near surface lithology. The resistivity surveys (Komex International Ltd.) gave definitive images of the buried channel and the presence of the valley was confirmed by detailed drilling (MDH Engineered Solutions). Further to the east, careful interpretation of a 3D seismic survey (Boyd PetroSearch) using visualization techniques showed the presence of another large buried channel.
Introduction
Historic site investigations over two areas determined that palaeochannel aquifers incised into the Upper Cretaceous Shale had the potential to act as conduits for contaminant migration. The position and configuration of these channels is important in developing 3-D groundwater models needed to decommission the sites. However, it was determined that there were insufficient data to create a defendable 3-D finite-element model and additional data were needed. Locating the thalweg at multiple locations through drilling was determined to be cost prohibitive. As a result, a large-scale Electrical Resistivity Tomography (ERT) program was completed.
A 3D seismic survey was completed independently to the east of the centre of the resistivity survey, focusing on structural features located below 500 meters. In interpreting the results of the acquisition (using visualization software), it became apparent that the quality of the data was so good that it was possible to image another buried channel (surface to 91 m), which was filled with a low velocity material assumed to be sand. The direction of this valley was not parallel to that of the buried channel identified by resistivity but the two appeared to converge to the north of the site.
ERT Acquisition and Processing
ERT is a technique for imaging the resistivity of the subsurface in a cross-sectional format. Data were collected in an automated fashion from an array of 81 electrodes using a Wenner array configuration. The electrodes were connected to a resistivity meter through a switching box that selected a predefined sequence of current and voltage electrode pairs, resulting in a pseudosection of resistivity values. An inversion program was used to model the 2-D resistivity sections through the application of a finite difference or finite element forward modelling subroutine (Loke and Barker, 1996). The final product was a 2-D resistivity cross-section displaying resistivity versus depth.
ERT Interpretation
To establish the viability of ERT, initial survey lines were completed near known piezometer locations. The known borehole lithology was used to assist in interpreting the geophysical results and provided calibration of the ERT sections. After the calibration cross-section survey was completed, additional cross-sections and three longitudinal lines, paralleling the thalweg, were collected along the thalweg of the palaeochannel to assist in characterizing the bottom of the buried channel. These lines provided sufficient information to mimic a 3D survey.
Figure 1 shows ERT line 1, which was established as a template line over the location of the buried channel near two piezometers, P1 and P2, located at approximately line positions 240 m and 700 m, respectively. The logs from P1 and P2 were used to calibrate the ERT model successfully.
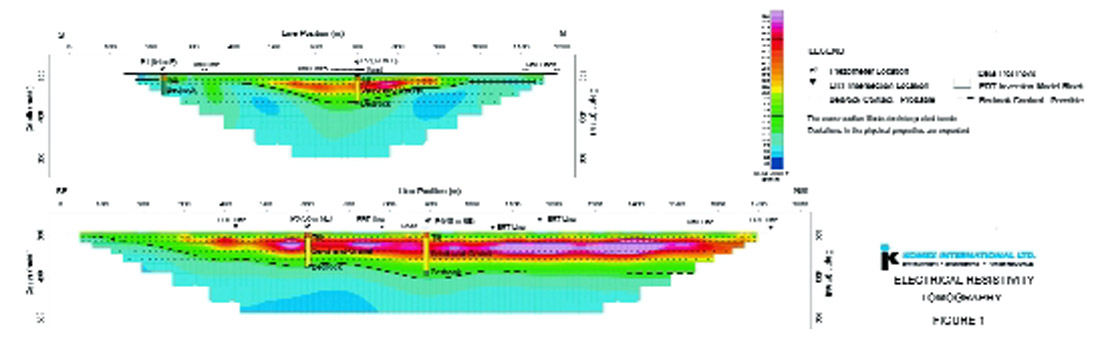
Line 2 was collected along the axis of the buried channel to map variations. The log of borehole P3 (at position 600 m) indicates a till layer overlying 80 m of sand and gravel resting on bedrock. The borehole log for P4 (at line position 885 m) indicates a 15 m till layer overlying a 65 m thick sequence of sand and gravel resting on bedrock shale. The ERT section outlined the buried aquifer along the entire length of the line. The logs from P3 and P4 were again used to calibrate the ERT model successfully.
The bedrock interface was interpreted on all ERT sections, geo-referenced and combined into a bedrock elevation map (Figure 2). The interpreted bedrock elevation data are plotted with warm colours (yellow to pink) representing higher elevations in metres above sea level (masl) and cooler colours (green to blue) representing lower elevations (masl).
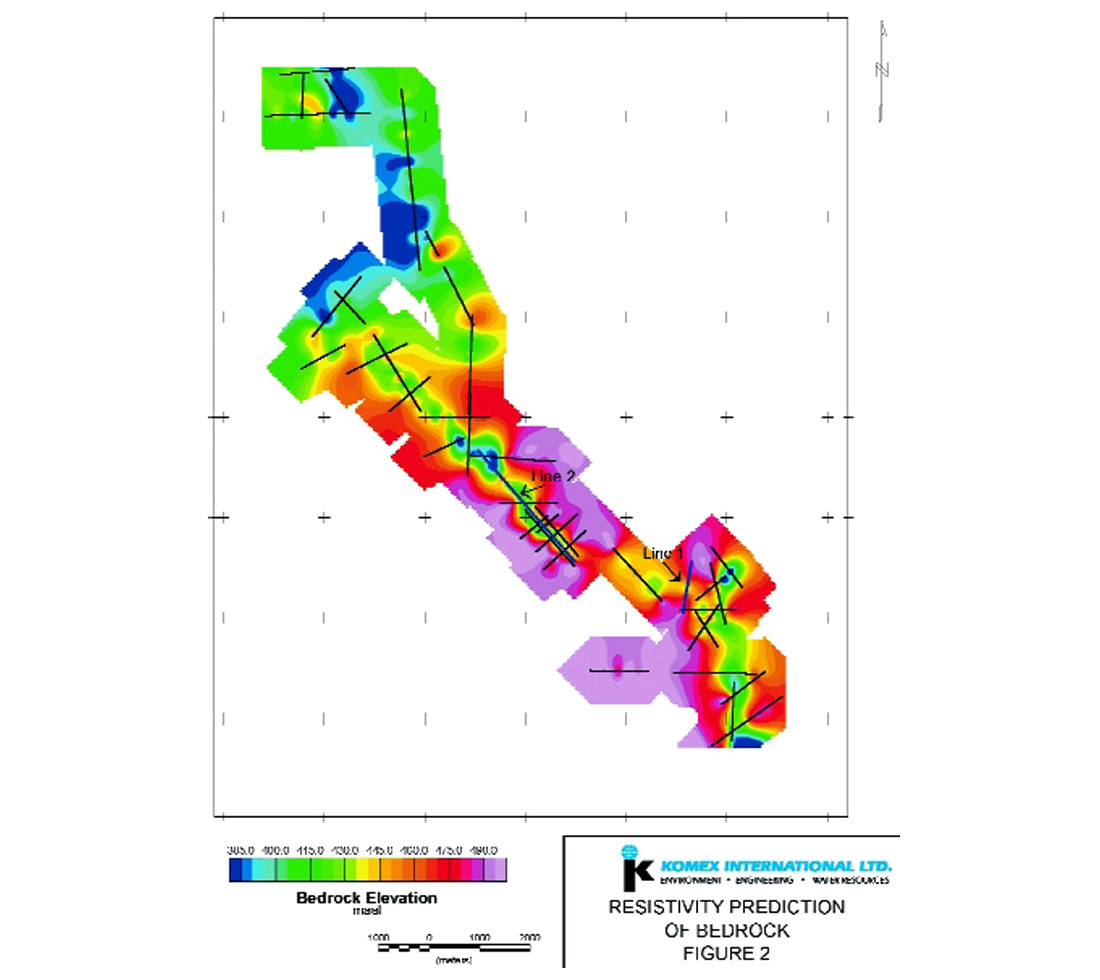
The palaeo-channel is characterized by a fairly consistent channel width of approximately 300 m from the southeastern end to approximately slightly past the middle of the survey coverage. The elevation of the thalweg of the channel is approximately 380 masl. Along the northwestern part of the survey coverage the bedrock elevation is below 380 masl.
Seismic Acquisition and Processing
The three dimensional (3D) seismic survey covered an area of approximately 37.5 square kilometres. It was designed to image a target from 0.6 to 0.8 seconds. The design and acquisition criteria for the survey were as follows:
- Fold – 10 to 14 at the zone of interest; 2 to 4 at 0.25 seconds.
- Bin size – 25 metres.
- Offset – 1100 metre far offset
- Energy Source – Dynamite 0.5 kg. at 9 metres, in fill with mechanical source.
- Recording – 24 Bit recording system.
The processing was conventional and designed to enhance high frequencies and reduce the effects of highly variable ground conditions. Near offset traces were not muted.
To compensate for near surface variations, a five component surface consistent deconvolution was applied to the data. Other processes to improve the quality of shallow reflectors included prestack frequency equalization and post stack F-X filtering. In general the data quality was excellent, with frequencies ranging from 10 to 150 Hz.
Seismic Data Interpretation
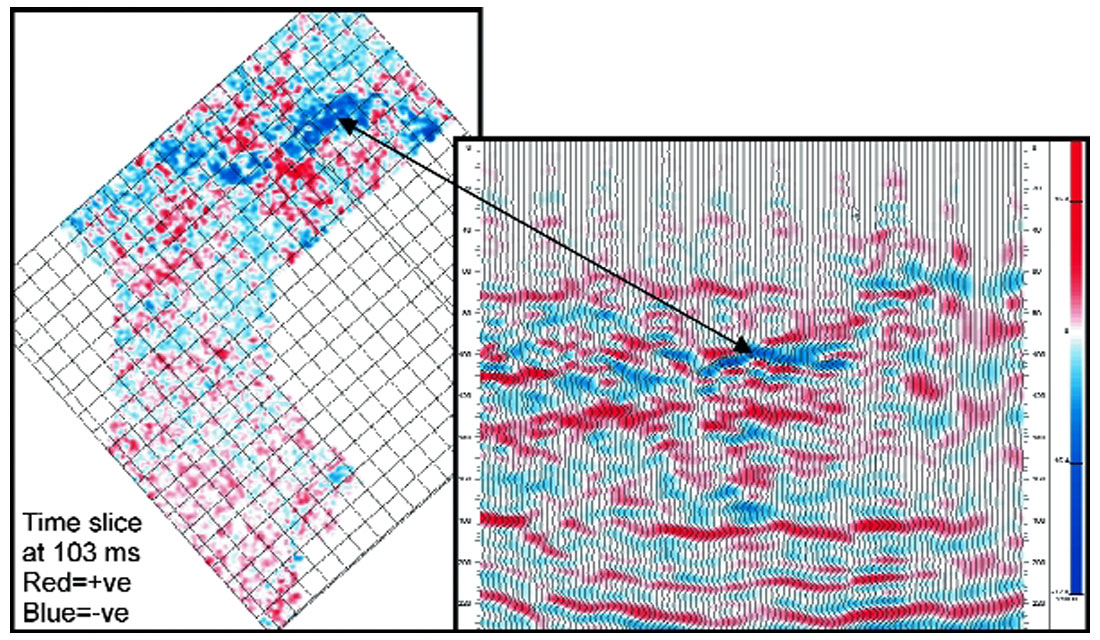
Interpretation was conducted using WinPics software. The low fold and poor signal to noise characteristics of the near surface seismic response suggested that reliable pick based mapping was not possible. Time slice displays were used to determine if the near surface data had imaged any geological features. The time slice display at 103 ms clearly shows a channel-like feature (Figure 3). The feature may be refracted energy or it may be critical angle reflection energy. If a near-surface interval velocity of 1800 m/s is used, the channel feature is encountered about 93 metres below surface. The depth and lateral extent of the channel are consistent with the buried channels identified by ERT methods.
Drilling and Ground-Truthing
Stratigraphic drilling was undertaken using a hydraulic rotary drill rig. Fifteen boreholes (Figure 4) were drilled along the thalweg of the palaeochannel indicated by the ERT survey. In all cases the aquifer sediments indicated by the ERT lines were present and drilling confirmed the location and depth (generally to within 10 m) of the palaeochannel as determined from the ERT survey. ERT resolution of the bedrock was often less than 5 m from confirmed values in the vicinity of the southern area. Resolution of the thalweg was poor in the vicinity of BH3, where the estimated bedrock elevation from the ERT data was over 60 m different from that verified through stratigraphic drilling. The ERT inversion models can be subject to considerable errors if the resistivity contrasts between the channel and the bedrock is subtle. However, the sand accumulations predicted by the ERT data were present at BH3. Similarly, The ERT lines completed near the northern area did not show strong resistive anomalies (even though known accumulations of aquifer sediments are present beneath the site). Porewater chemistry data from the site indicated that the aquifer in the immediate vicinity of southern area contains a high conductivity solute. The ERT surveys could be used to help delineate the plume within the channel aquifer.
Drilling in the northern area indicated the ERT survey could be ambiguous. Ambiguity resulted from the presence of stacked blanket-aquifers, from varying accumulations of silt, clay and till separating the aquifer horizons, and from unsaturated conditions within the upper blanket aquifer. Unsaturated conditions exist primarily east of the site where the top aquifer discharges into an adjacent creek and results in depression of the potentiometric surface. The unsaturated conditions resulted in large resistivity anomalies and poor resolution of the bedrock surface. Drilling in the vicinity of BH5 indicated that the sand and gravel had been replaced by silt and clay. ERT data helped to locate the position of the silt and clay.
Geological and Lithological Interpretation
A generalized stratigraphic profile in the investigation area is provided in Figure 4. Near the southern area, the palaeochannel reaches depths of over 127 m and can be divided into an upper coarse lithology and a lower finer grained stratified sequence. The total thickness of the palaeochannel aquifer sediments varies from 0 to 91 m. Drilling has verified that the undulating thalweg (indicated by the ERT surveys) likely exists within the palaeochannel, suggesting a subglacial origin for the channel. The channel splits into two separate channels east of the site (Figure 4).
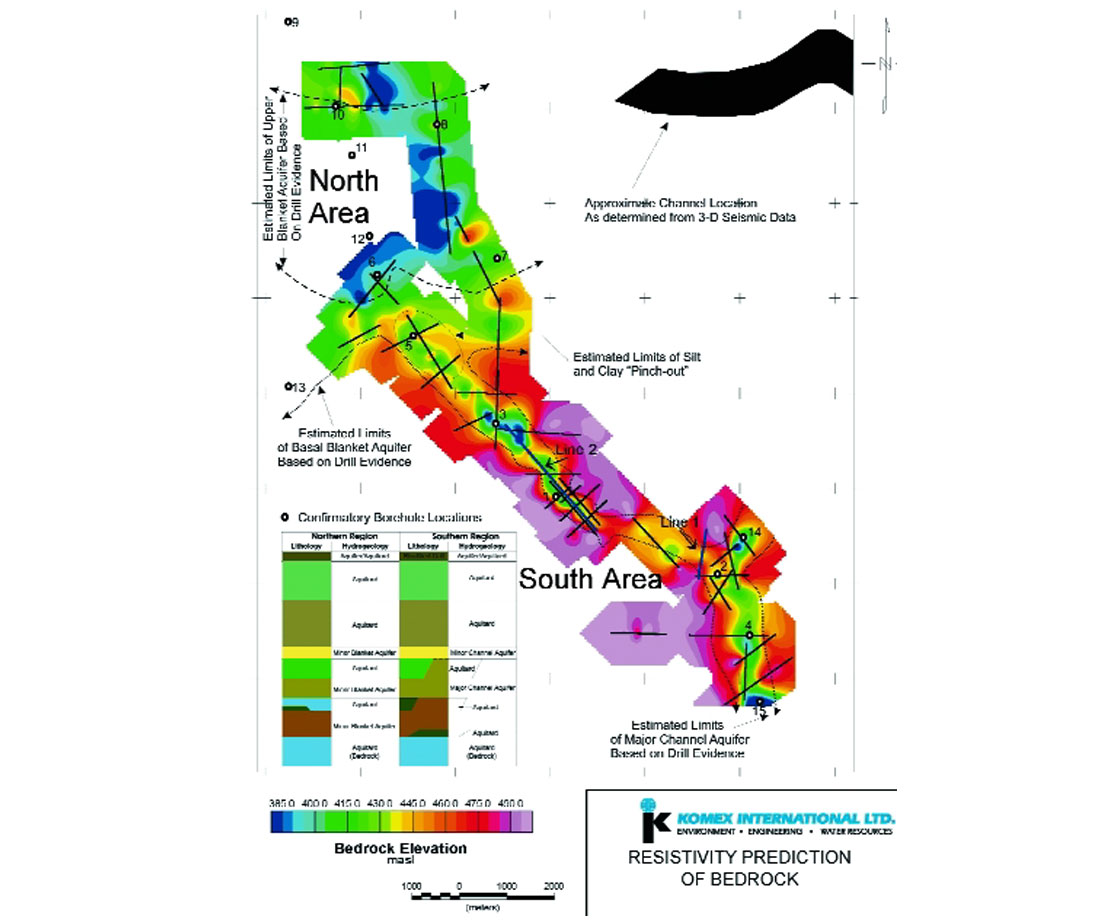
Near the northern area the palaeochannel widens and the valley-filling sediments become extensive. The blanket aquifer is separated into two horizons by an aquitard comprised of primarily silt and clay. The entire stratified sequence varies between 20 and 76 m, with the upper aquifer horizon pinching off to the north and south of the site (Figure 4). Both the separating aquitard and the basal aquifer unit are present at all borehole locations in the northern area. A glacial till cap covers the entire area and has been encountered in thicknesses between 14.0 and 62 m.
Conclusion
This case history serves to confirm the quality of resistivity measurements. The method proved successful and it was possible to trace the valley over several kilometers from the southeast to the northwest, where the sandy sediments become clay and silt rich and the difference in resistivity was not as clearly marked. The ERT results were confirmed by drilling and geological interpretation.
The conventional 3D seismic survey, despite being designed for much deeper targets (and therefore having low fold and poor offset distribution at very shallow target depths), was able to provide indications of buried channels in the upper 100 metres of earth. This may have implications for other industrial sites where the prevention of groundwater contamination is important and where 3D seismic surveys exist, for example, at sulphur stockpile sites.

Acknowledgements
We grateful acknowledge the owners of the site to allow us to publish these data and the conclusions.


Join the Conversation
Interested in starting, or contributing to a conversation about an article or issue of the RECORDER? Join our CSEG LinkedIn Group.
Share This Article