We present a case study of oil sands reservoir characterization using resistivity and density seismic volumes estimated from multicomponent seismic data. In the Athabasca Oil Sands region of Alberta, the Lower Cretaceous McMurray Formation is the reservoir. In this reservoir the sand can be differentiated from shale based on density. The sands could be wet or bitumen bearing and resistivity proved to be the only property which can differentiate between the two kinds of sands. We estimated resistivity from multicomponent 3D seismic data integrated with cores and wells data. Our workflow includes petrophysical analysis, joint PP-PS prestack inversion and neural network analysis. Joint PP-PS prestack inversion produces very good estimates of the elastic properties: P- and S-wave velocities and density. Neural network analysis is used for density and resistivity estimation. In all neural network analyses the most significant seismic attributes include converted-wave information. Key problems solved include excellent pay characterization, correct flank water mapping and accurate identification of high versus low oil saturation in zones with high salinity bitumen sand.
Introduction
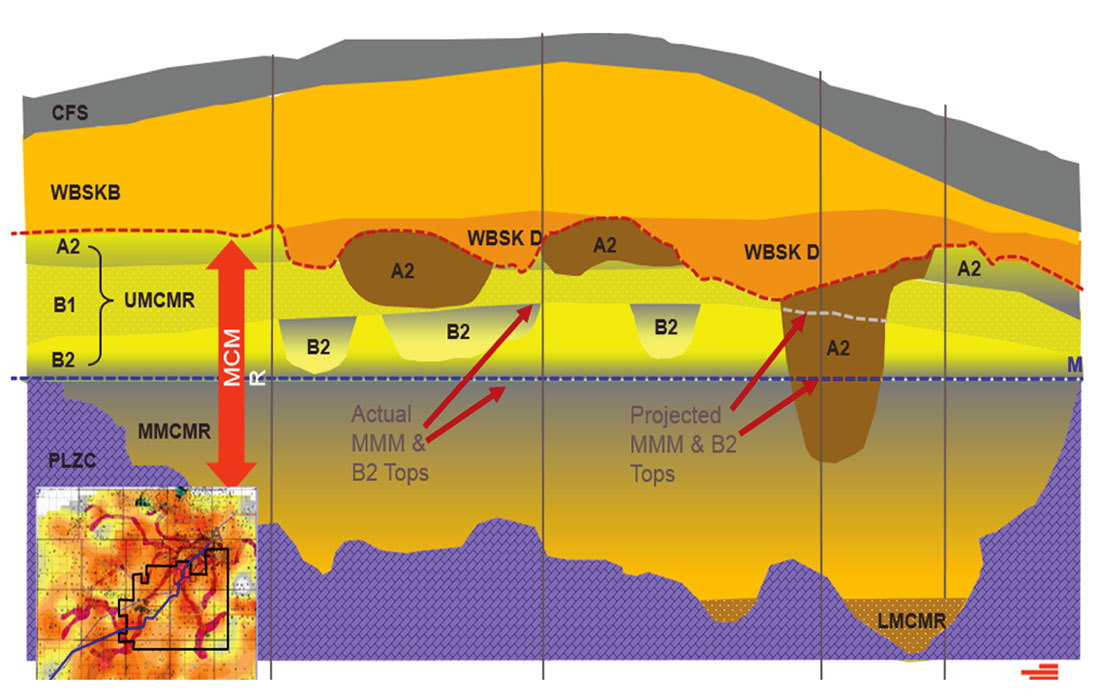
The unconsolidated sands of the Lower Cretaceous McMurray Formation reservoir used in this study are located in the Athabasca Oil Sands region of the Western Canadian Sedimentary Basin of northern Alberta, Canada. The dominant stratigraphic depositional model for the McMurray is considered fluvial (Hubbard et al., 2011). A generalized McMurray stratigraphy within the study area, shown in Figure 1, indicates a variable gross thickness and a complicated interplay of incision events and fluvial-estuarine deposition. This results in a complex amalgamation of heterogeneous elements including point bar deposits with associated sands and interbedded muds which can form inclined heterolithic strata (IHS). With the increasing interest in the Alberta oil sands, optimizing the reservoir production will require understanding the complex spatial distribution and lithological composition of the reservoir.
Inside the study area, the McMurray has been subdivided into a variety of lithofacies: 1) Sand, 2) Inclined heterolithic strata (IHS) 3) Mud/Shale, and 4) Breccia. A typical log through the formation is shown in Figure 2.
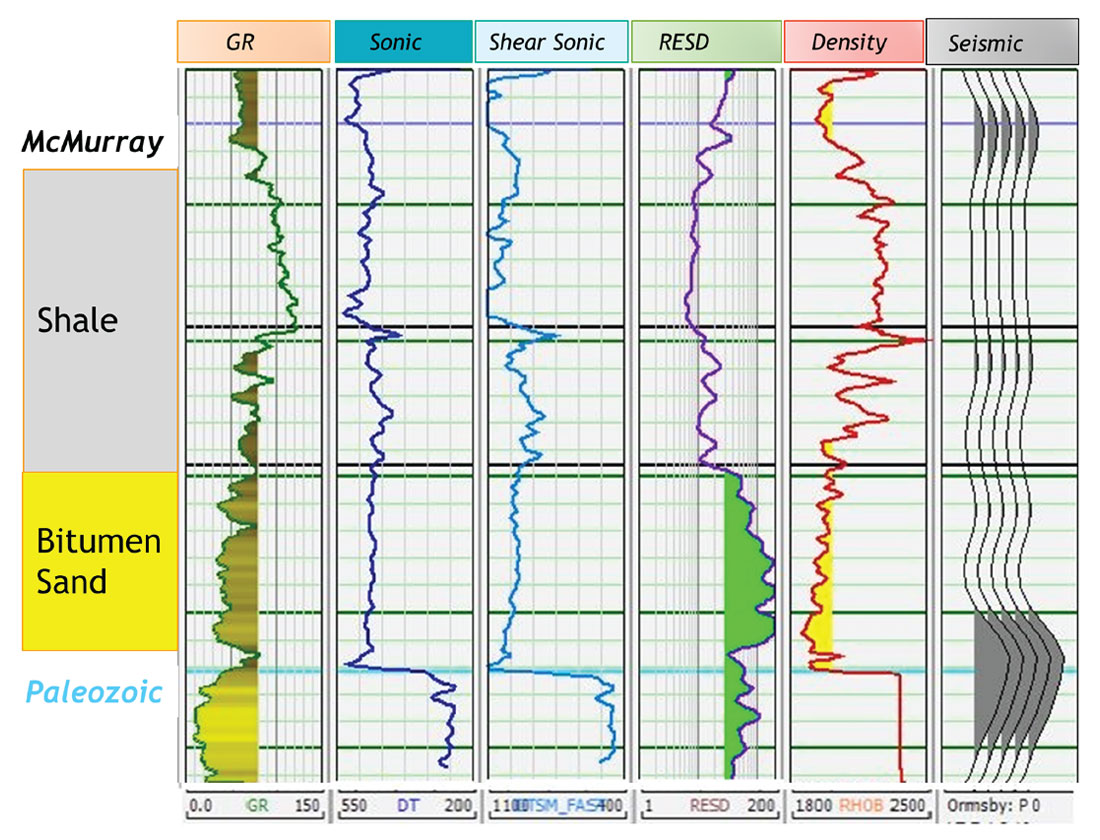
Included in the log suite are the compressional (DT) and shear (DTSM) transit time logs. Note the relative absence of reflectors between the McMurray and Paleozoic. This is why we turned to inversion for reservoir definition.
Densities less than 2150 kg/m3 are assumed to be sand, as calibrated by core. Densities greater than 2150 kg/m3 can be grouped into shale, breccia or muddy IHS, all of which are not pay.
Due to the large velocity increase at the Paleozoic, incidence angles become critical at 30 degrees. As a result, density cannot be directly estimated using two-term amplitude versus offset (AVO) analysis (we will need three-term AVO) but it can be estimated from prestack inversion (for more details see Method) and improved in neural network analysis.
Closer examination of the shear log in Figure 2 indicates a slight lowering of the velocity in the bitumen pay zone. The addition of bitumen to unconsolidated sands imparts a frequency-dependent shear modulus to the sands (Kato et al., 2008). This effect provides a method to estimate resistivity via seismic data.
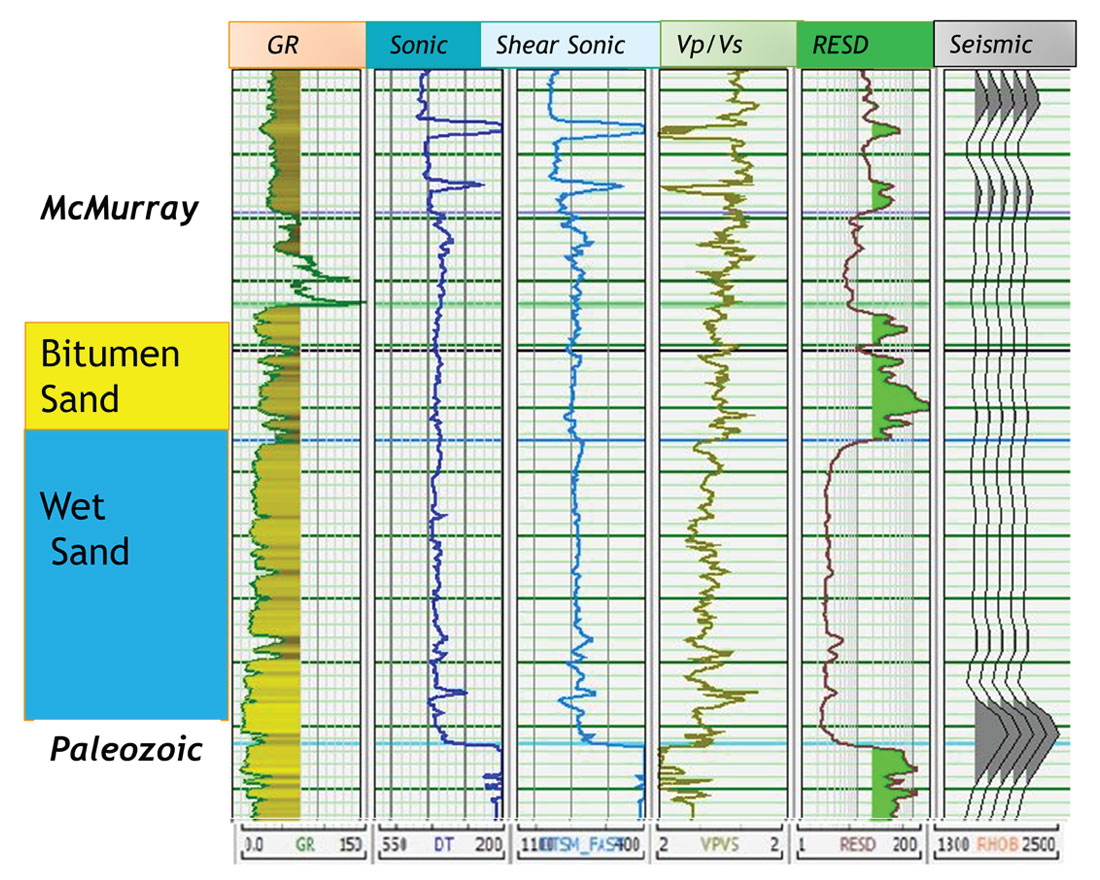
Wet sands display a low resistivity due to the presence of conductive brine. Displacing the brine with bitumen will lower the conductivity of the sands, as indicated by a higher resistivity. Figure 3 shows a typical log with both bitumen and wet sands. While reflection seismic is unaffected by the change in resistivity, it is affected by the change in shear properties. There is an AVO response as a result. Neural network analysis (NNA) can be used to calibrate this effect upon the resistivity curves.
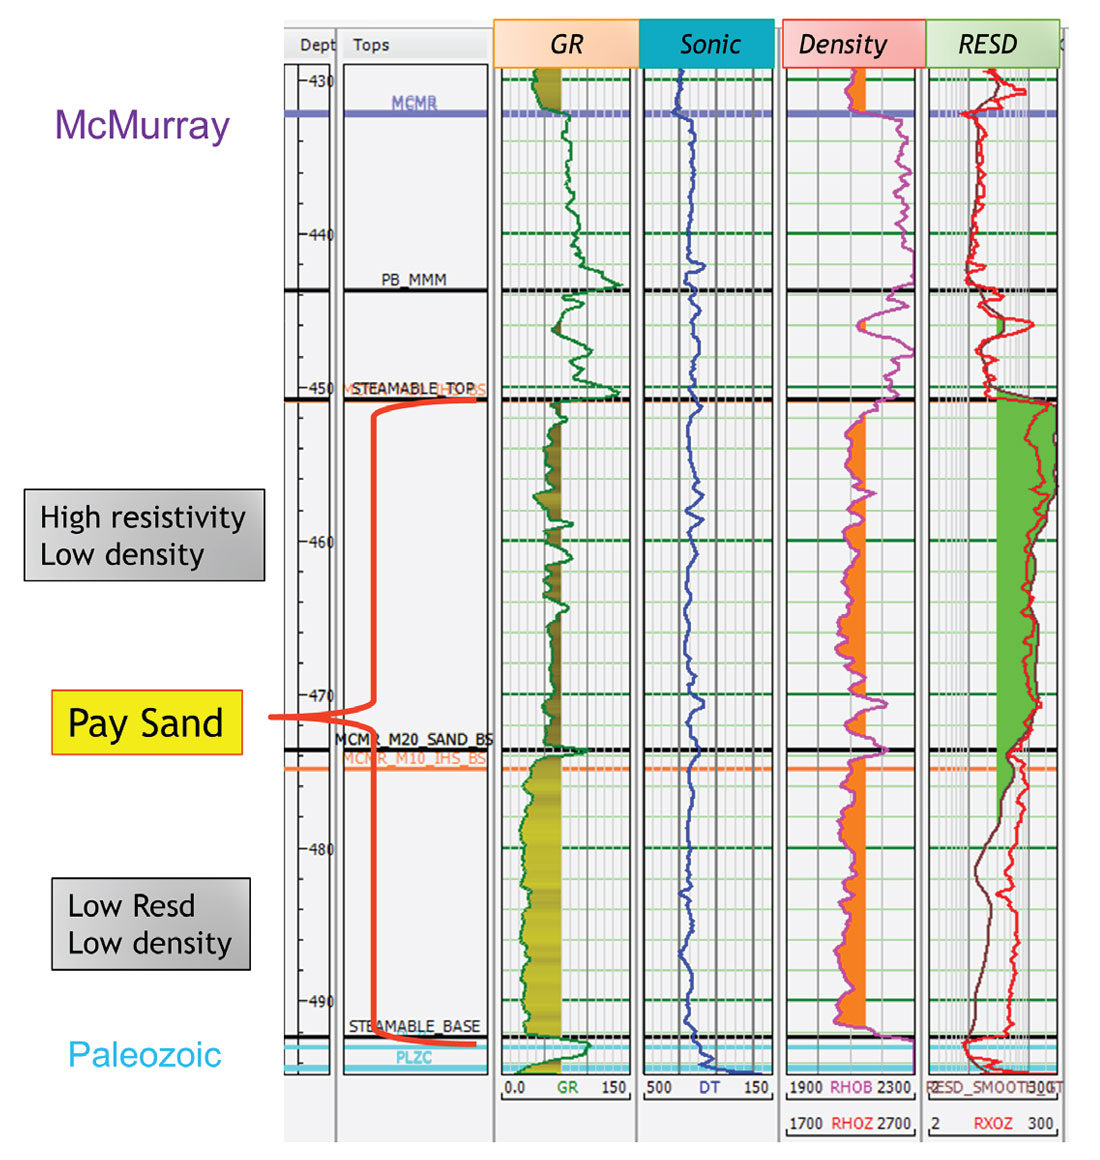
Some areas in our study have lower oil saturation and higher salinity. In these areas, the RESD logs show low resistivity even though the cores contain bitumen. Fortunately, the RXOZ log, which is normally used to measure resistivity close to the wellbore, is capable of detecting the bitumen as drilling mud of a lower salinity invades and replaces the high salinity formation water. In these areas, we performed NNA analysis for the RXOZ log in addition to the RESD log. An example log is shown in Figure 4.
Method
Multicomponent seismic data have regained importance because it provides one of the most powerful tools for expanding our understanding of rocks and fluid properties in the subsurface. Our 3D survey used dynamite as a source and 3 component geophones, allowing the recording of the normal PP seismic data as well as the converted mode PS seismic data.
The variation in PP and PS seismic data result from the fact that each type of reflection is controlled by different elastic properties of the medium, some associated with the rock matrix, and some associated with the fluid present in the rock pores (Wei et al., 2014). It is possible that combining the two types of data can reveal the stratigraphic architecture and a better understanding of the reservoir.
Prestack PP inversion (Hampson et al., 2005) algorithms directly estimate the P- and S-impedance and the density using their logarithmic relationships. Joint inversion of the PP and PS seismic data (poststack or prestack) is a natural extension of the theory of prestack PP inversion to the converted-wave seismic data (Aki and Richards, 2002, Margrave et al., 2001, Hampson and Russell, 2013).
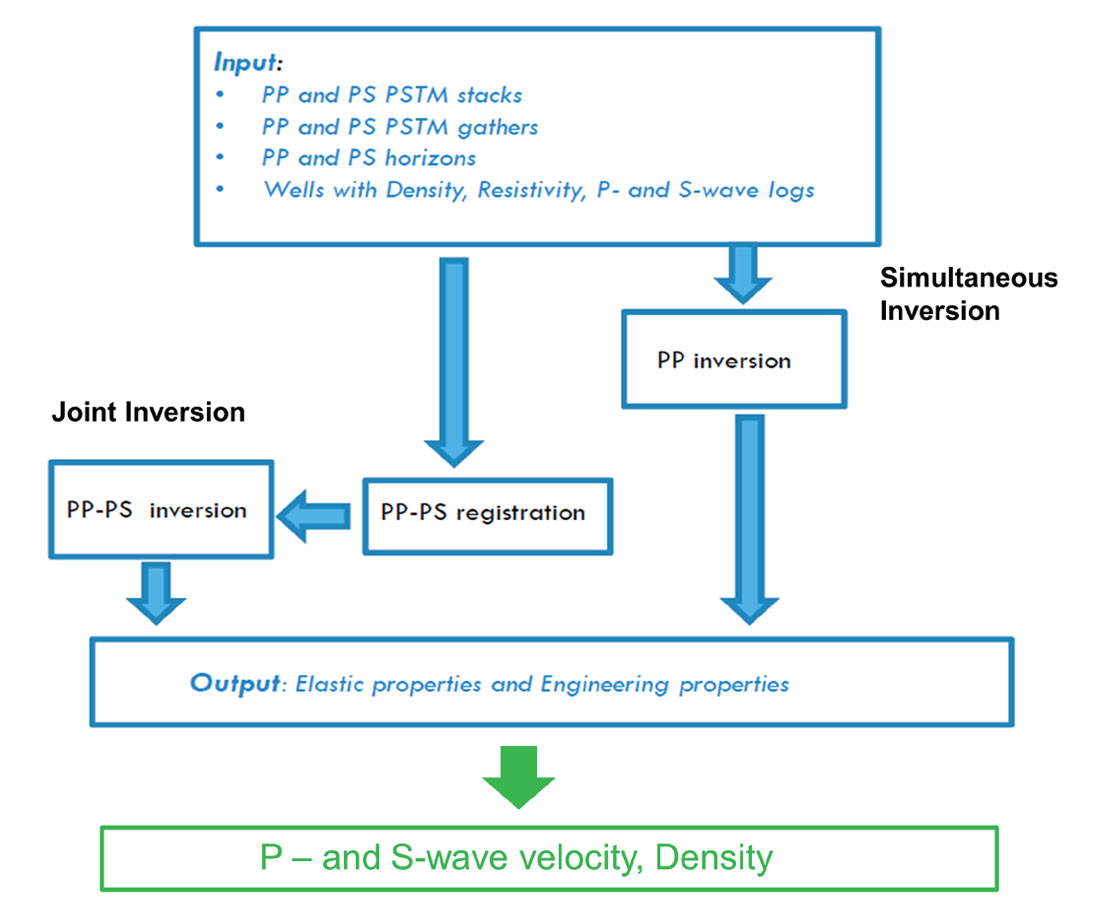
Our workflow for the inversions is shown in Figure 5 and was previously presented at the 76th EAGE Conference & Exhibition (Dumitrescu et al., 2014).
In previous studies, NNA for rock properties was used successfully to predict density and porosity changes in the thin Gething Formation channels and the Cadomin gas reservoir in the Western Canadian Foreland Basin (Dumitrescu and Mayer, 2009) and in an oil sands reservoir related to the Long Lake South project (Dumitrescu and Lines, 2010).
NNA has four steps: 1) perform a multi-attribute step-wise linear regression and its validation, 2) train neural networks to establish the nonlinear relationships between seismic attributes and reservoir properties at well locations, 3) validate results on the wells withheld from the training, 4) apply trained neural networks to the 3D seismic data volume.
The NNA was performed with 80 wells, the PP and PS PSTM volumes, attributes from the PP and PS AVO analysis, and attributes from the joint PP-PS prestack inversion. Using the ranking process available within the software and after error reduction, we selected the attributes for training the network for elastic, petrophysical, and engineering properties.
Density inversion analysis
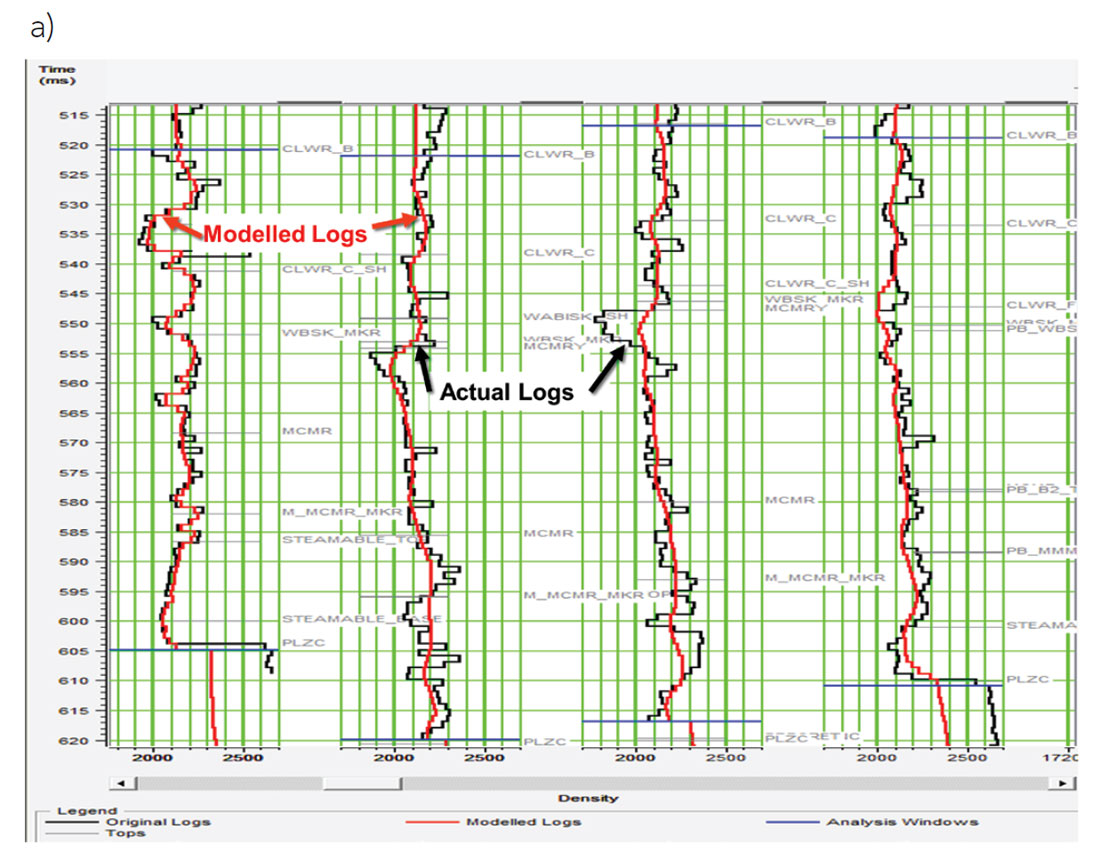
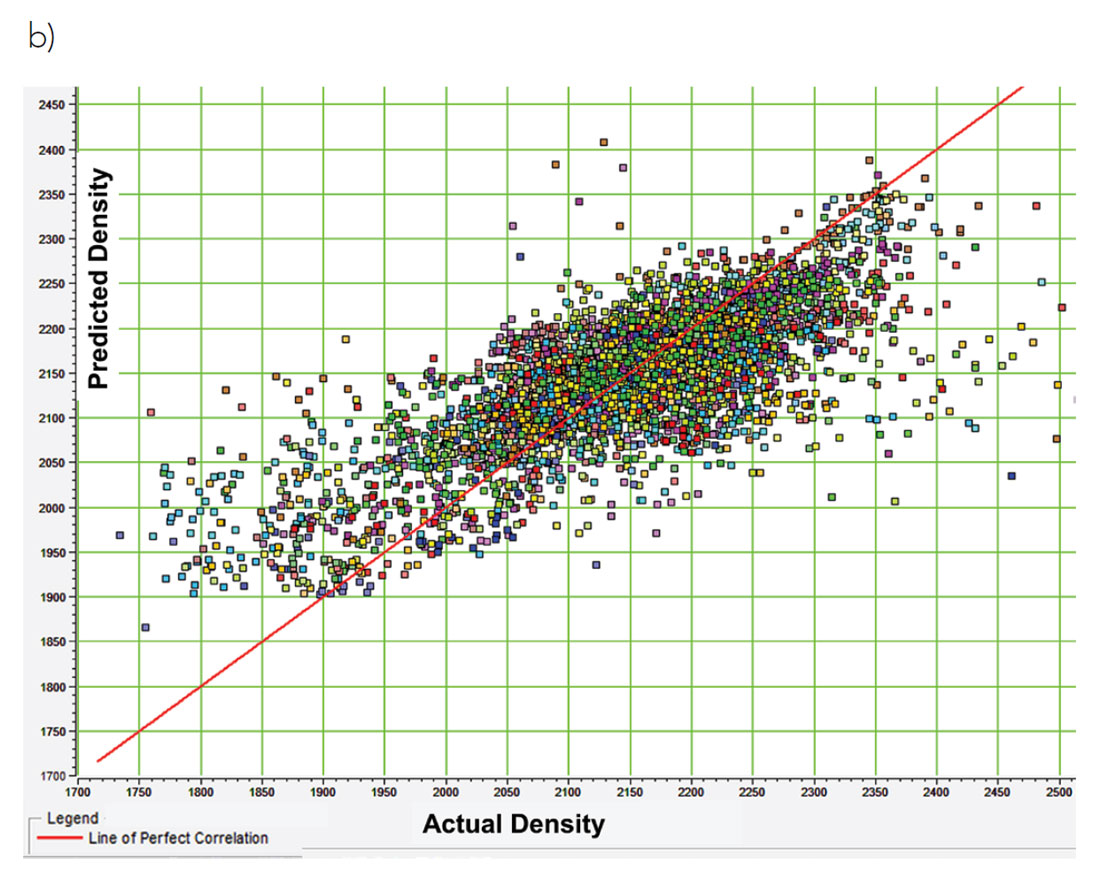
An example of the density inversions for four logs is shown in Figure 6a.
The first five attributes used in the NNA are from the PS seismic. This enhances the accuracy of the inversion compared to a PP alone inversion. The inversions tend to over-predict the lower density values and under-predict the high densities, with the crossover at the sand/shale boundary of 2150 kg/m3. This means we tend to under-predict the amount of sand. This occurs because of the nature of the logarithmic relationships used to predict the density. We are investigating a correction for this effect by cokriging the density volumes with the well data.
Resistivity inversion analysis
Resistivity logs discriminate hydrocarbons from brine sands by virtue of the lower conductivity of the hydrocarbons compared to the brines. Our NNA for resistivity uses the increased shear modulus of bitumen to image its presence. This technique works very well for bitumen reservoirs. Figure 7 shows results from the RXOZ inversions.
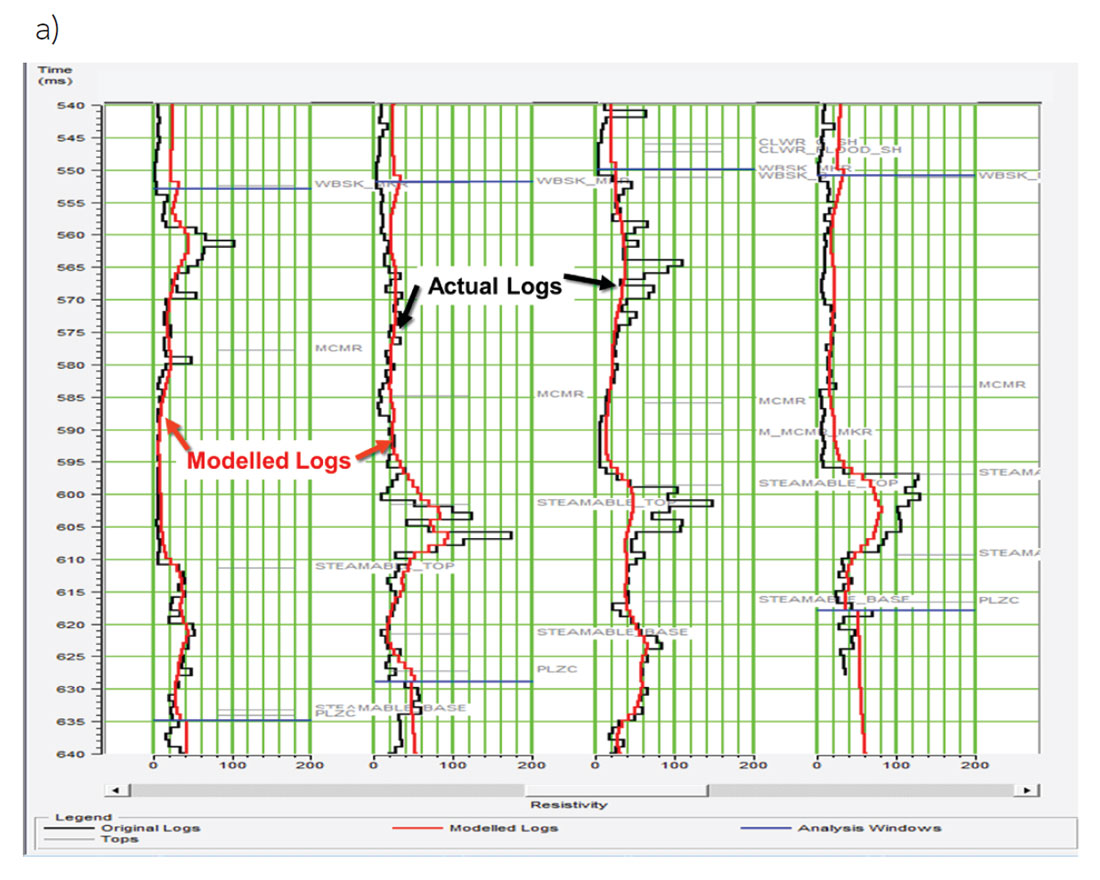
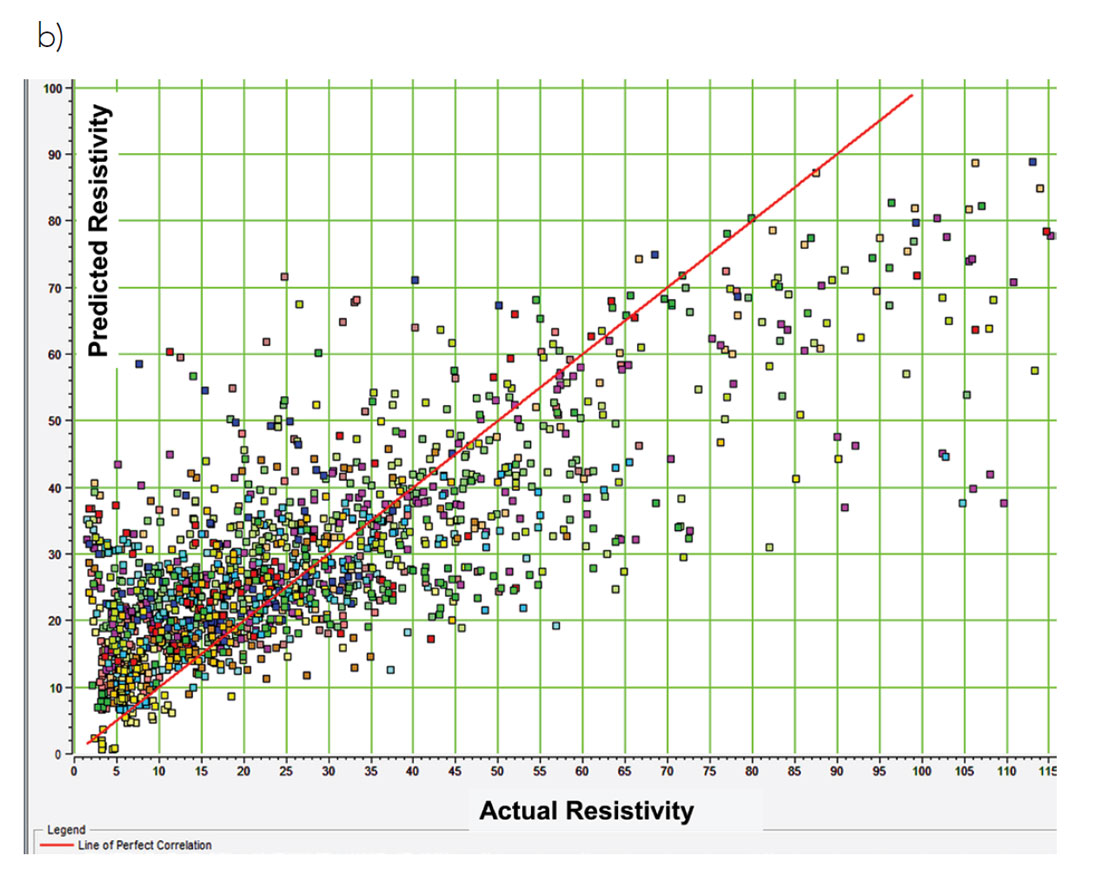
Five of the top seven attributes from the NNA are from PS seismic. As with the density, there is a tendency to over-predict the lower resistivity values. This causes a slight under estimation of pay.
Results
Example #1 Flank Water
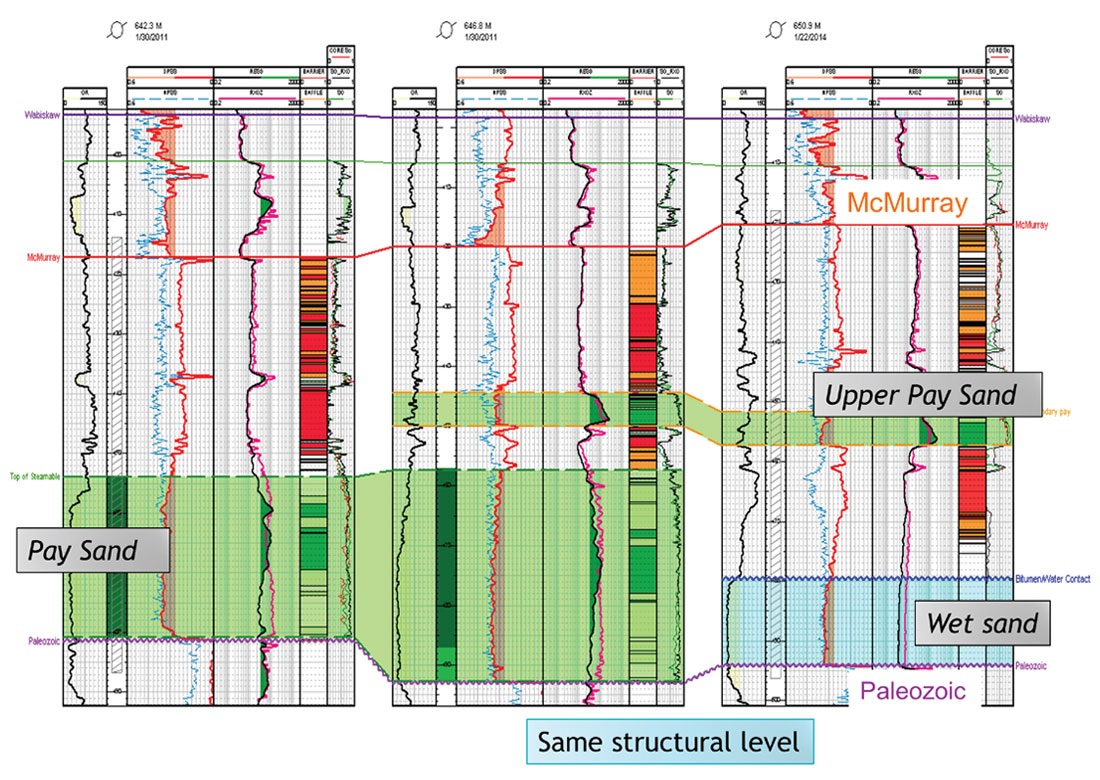
A cross section through the study area where flank water is found at the same structural level as bitumen pay is presented in Figure 8.
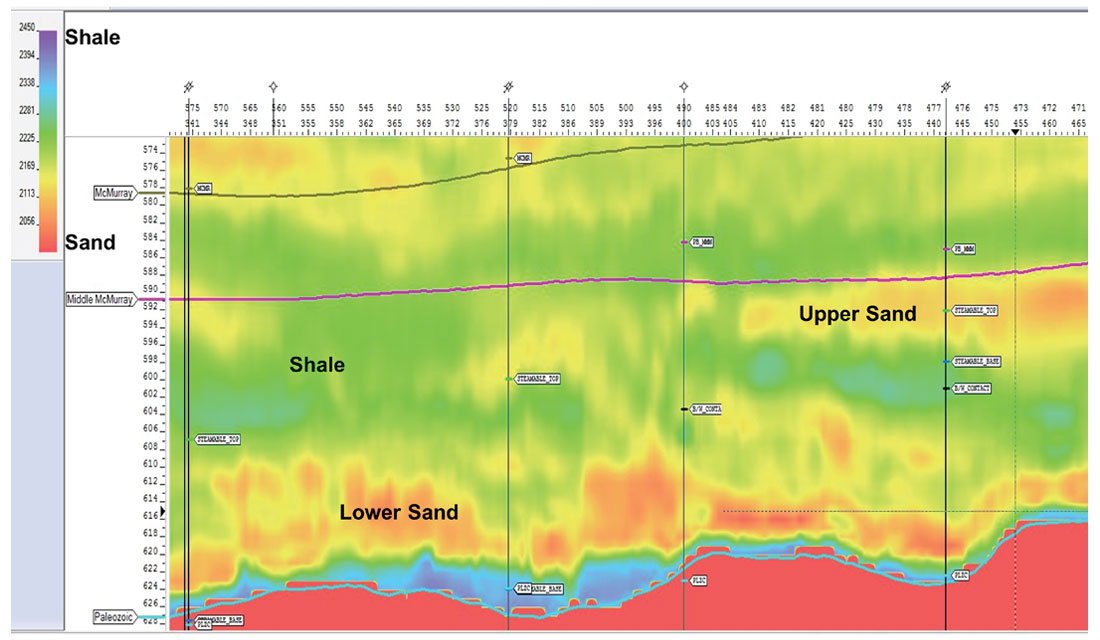
A density seismic section through the same area shows both the upper and lower sands, but cannot distinguish bitumen vs wet sands (Figure 9).
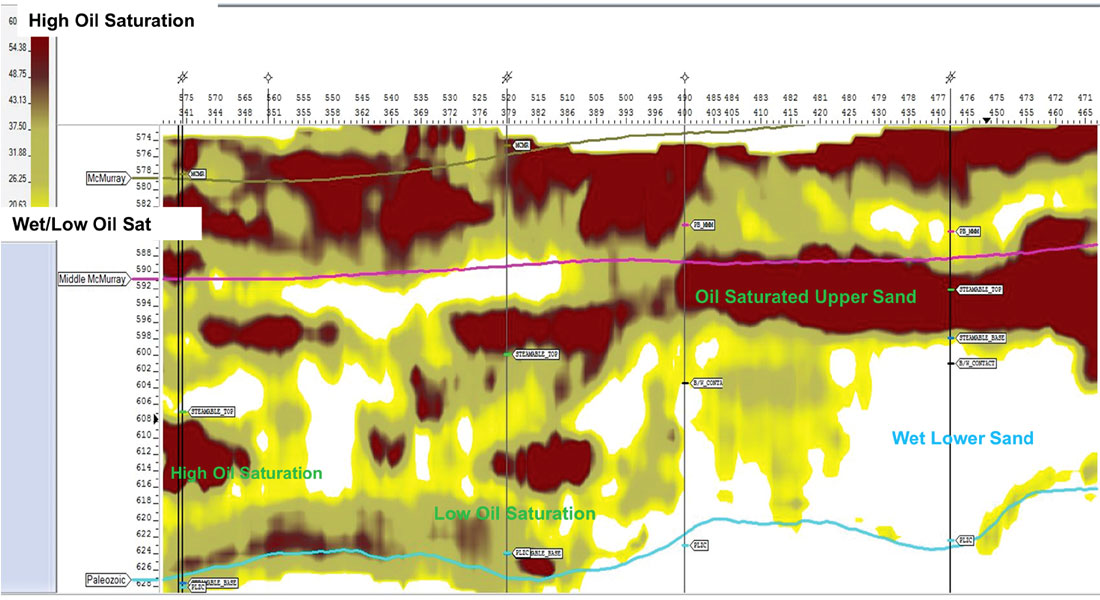
In order to discern the bitumen from the wet sands we must turn to the resistivity inversion. The result is shown in Figure 10.
Note the change from brown/yellow to yellow/white to solid white in the lower sand as bitumen gives way to water. The upper sand has continuous pay and is solid brown.
Example #2 High vs Low Oil Saturation
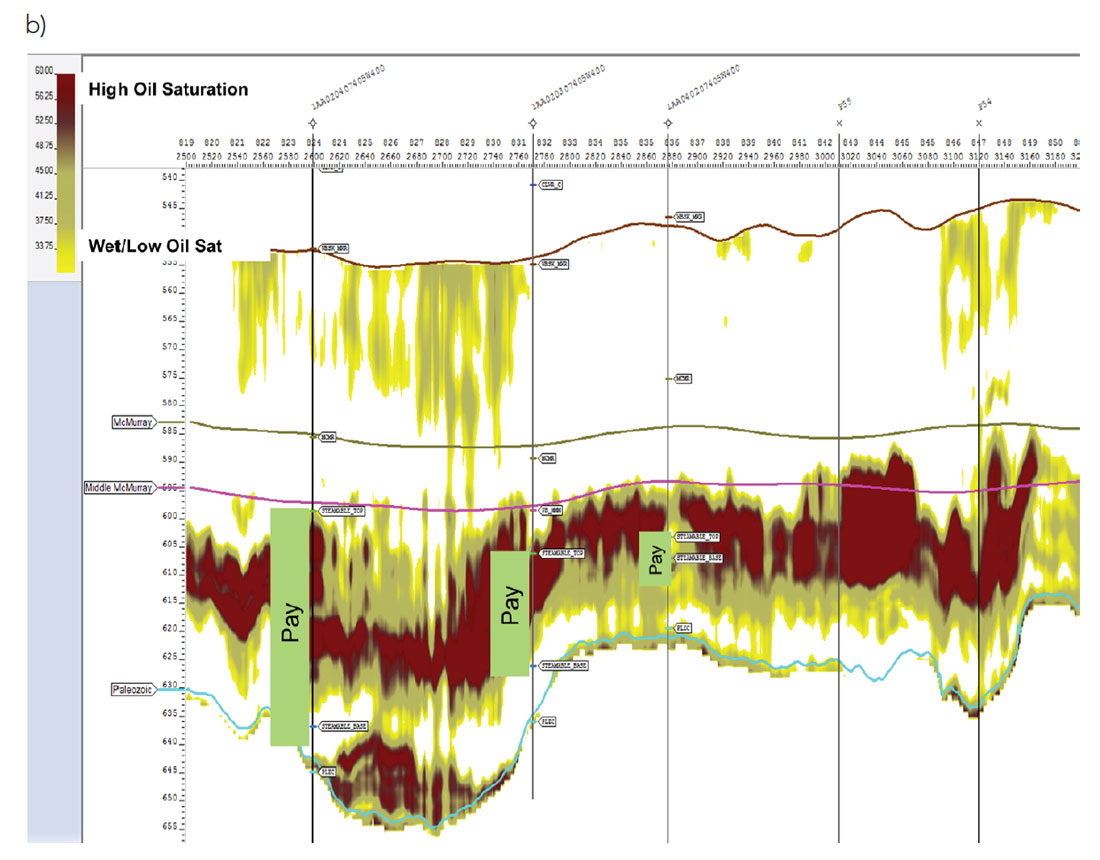
Figure 11 shows a cross section through a Paleozoic erosional low (Cretaceous channel incision) and the lateral terrace. Thick pay exists in the channel, but the lower sand has high salinity and lower oil saturation and shows up only on the RXOZ log.
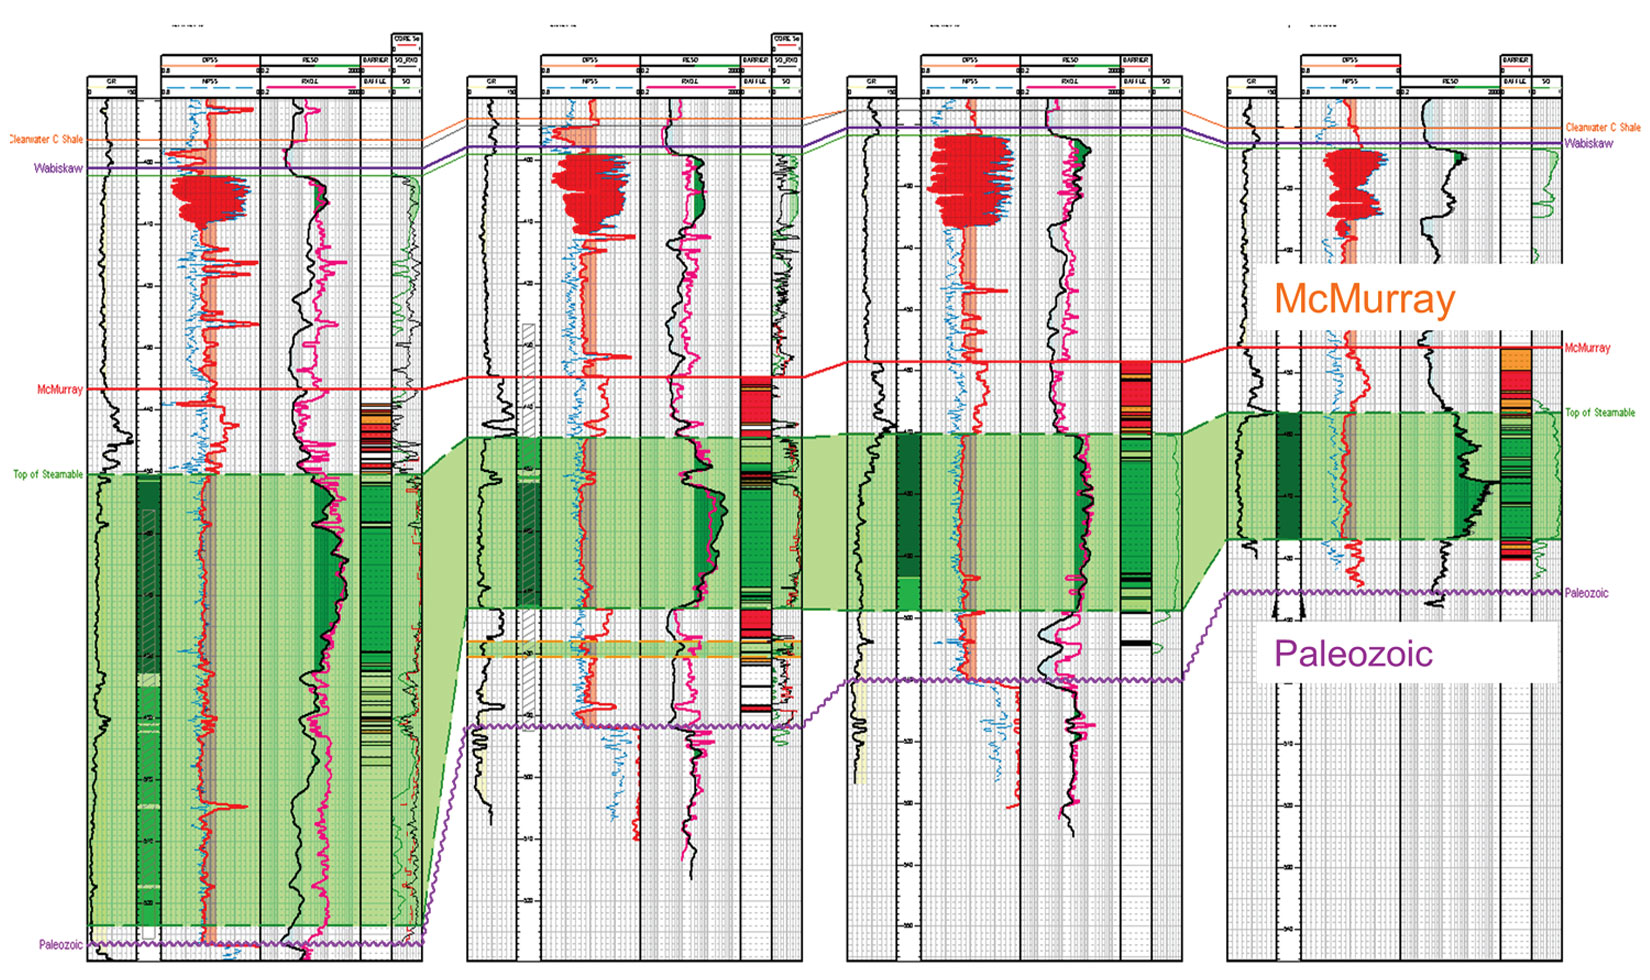
In the westernmost well there are two sands. The upper sand, which continues to the east has high resistivity on both the RESD (red) and the RXOZ (green) logs. But the lower sand, which is restricted to the deepest part of the channel, has lower oil saturation and is indicated by higher resistivity on the RXOZ log only.
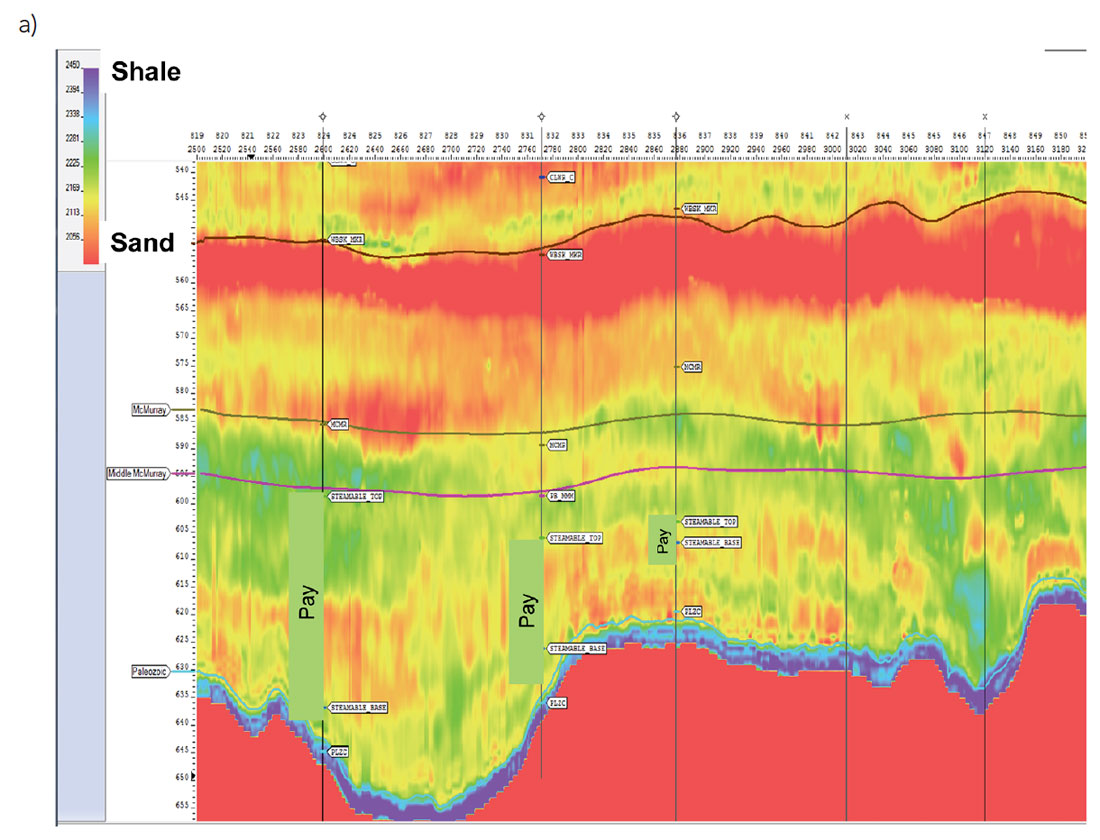
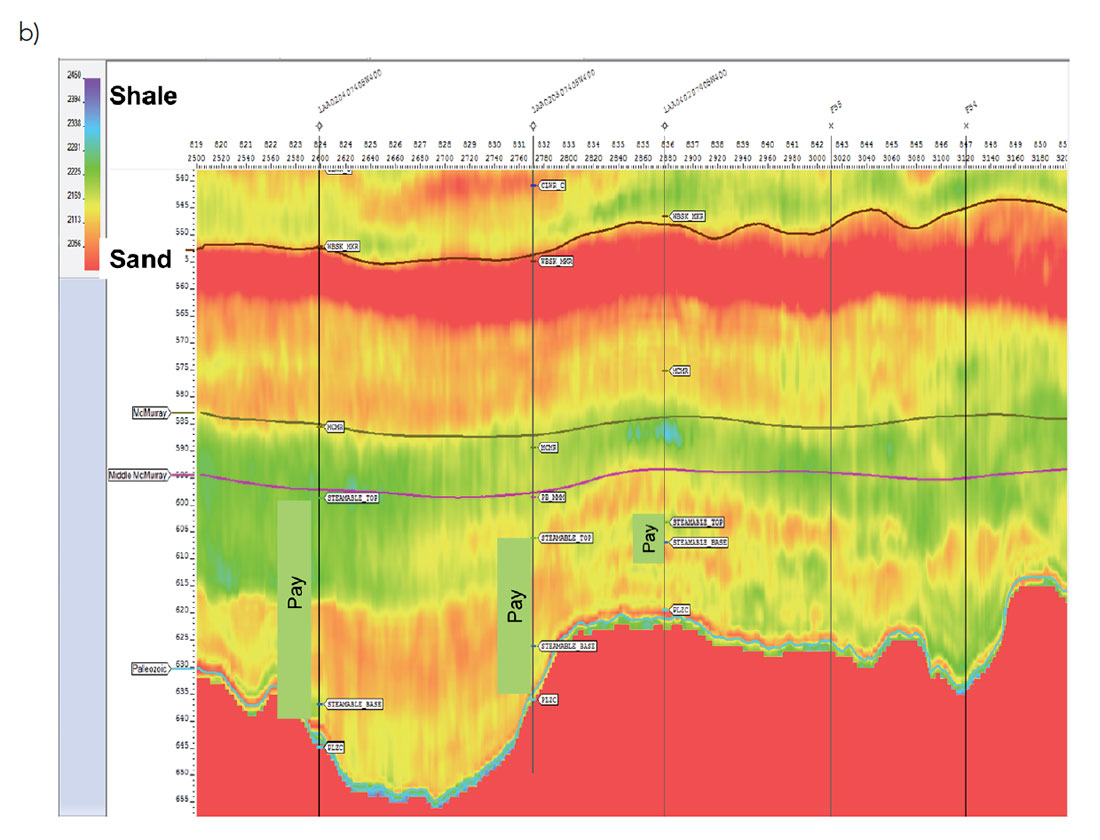
Density inversions corresponding to this cross section are shown in Figure 12.
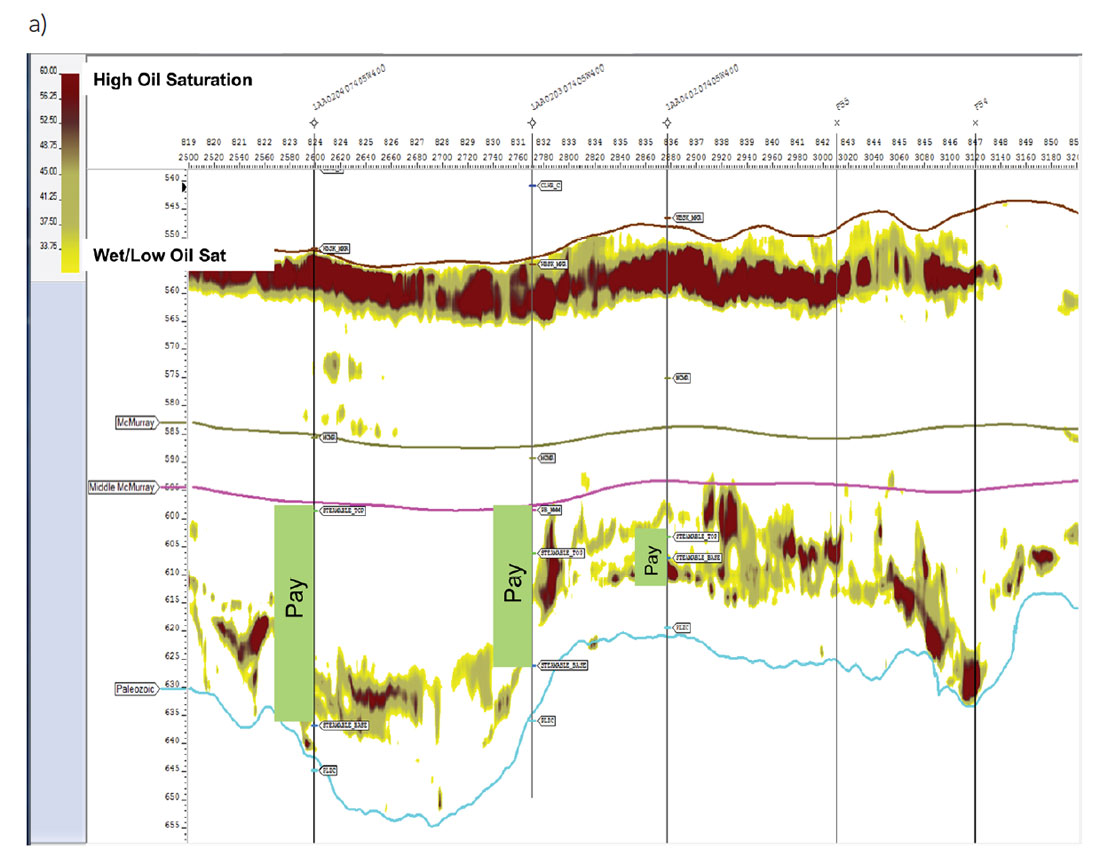
We now need to look at the resistivity inversions to discern pay. Both the upper and lower sand have bitumen, but the lower sand has lower oil saturation, as shown by the RXOZ log on the western well in Figure 11. Resistivity inversions are shown in Figure 13.
Applications
Density and resistivity volumes can be combined in a number of ways to map pay, which can be used in turn for well design, pad layout and reserve estimation and mapping of a bitumen/water contact. This technique has indicated pay where no well control exists. This is being tested by drilling this season. In addition, because the resistivity inversion relies on the shear properties that bitumen imparts to sand, the loss of these properties with SAGD production allows for a method of mapping the steam front using 4D seismic.
Conclusions
The joint PP-PS inversion of the prestack seismic data produces the best estimates of P-impedance, S-impedance and density, allowing for more accurate and reliable reservoir characterization of the Athabasca oil sands reservoir.
Neural network analysis is used to enhance the resolution of the elastic properties estimated from joint PP-PS prestack inversion, and to estimate petrophysical and engineering properties such as porosity, resistivity and saturation. In all neural network analyses we find that the most significant seismic attributes include converted-wave information.
Some of the results of this study are:
- Converted-wave seismic data have a major role in oil sands reservoir characterization;
- Estimated density seismic volume allows the differentiation of reservoir from non-reservoir;
- Estimated resistivity can discriminate bitumen sand from water sand;
- The combination of resistivity and density can be used to map pay and calculate volumetrics;
- Near wellbore resistivity inversions can accurately map pay in high salinity/ low oil saturation areas.
Understanding the reservoir heterogeneity will have a significant impact on the appraisal and development of the bitumen-saturated sand resource.

Acknowledgements
We acknowledge and thank the following organizations for their support: Devon Canada Corporation and Terra-IQ Ltd. Graham Cain at Devon has provided invaluable support and in addition has invented various methods of statistically evaluating the accuracy of the predictions based on the inversion volumes.


Join the Conversation
Interested in starting, or contributing to a conversation about an article or issue of the RECORDER? Join our CSEG LinkedIn Group.
Share This Article